Article
Are we there yet?


Article
Read more
4 March 2020
The short answer is: “Not quite”. And while we see examples of very promising modern machine learning experiments that are bound to prove valuable in the future, several traditional approaches are still proving very hard to beat.
Traditionally, demand forecasting in the context of sales and operations planning has been supported by various time series methods such as Exponential Smoothing Models (ESMs) and ARIMA models. Given the importance of running an efficient supply chain, a lot of focus has been given to how the analytical aspects of demand forecasting in an sales and operations planning (S&OP) context can be enhanced.
Whenever a new technology has emerged (especially one with such fancy lingo as “convolutional neural networks”, “support vector machines”, “gradient boosting” etc.), organisations have naturally been interested in exploring if and how it could help them enhance the analytical aspects of demand forecasting in S&OP.
The technology currently getting the most attention is arguably artificial intelligence, and in industries where the supply chain is such an important driver of both cost and value, a lot of attention has been given to how artificial intelligence can reduce cost and increase value throughout the supply chain. (As a historical side note, it’s somewhat puzzling why AI is considered “new” when the origin coincides with the advent of ESMs in the late 1950s.)
A key process in optimising the supply chain is sales and operations planning,and perhaps the most critical piece of information in the process is an estimate of future demand, which also explains the continuous search for demand forecasting excellence.
So here we are – a new technology based on data showing tremendous potential and a key business process relying heavily on data. Two key ingredients of a match made in heaven, right? Well, not quite. Below, we will look at why this is not the case just yet, but also what companies can already do today in order to prepare for when the match becomes a heavenly made one. Hopefully, this will enable readers to separate fact from fluff.
First, let’s look at why artificial intelligence is getting so much attention. Here it’s important to realise that what most people are referring to when they talk about artificial intelligence is really the subset of artificial intelligence called machine learning. But what is it then that makes machine learning such a hot potato? Machine learning allows us to use data and statistical methods to solve problems using computers in a manner different to how we usually use computers and data to solve problems.
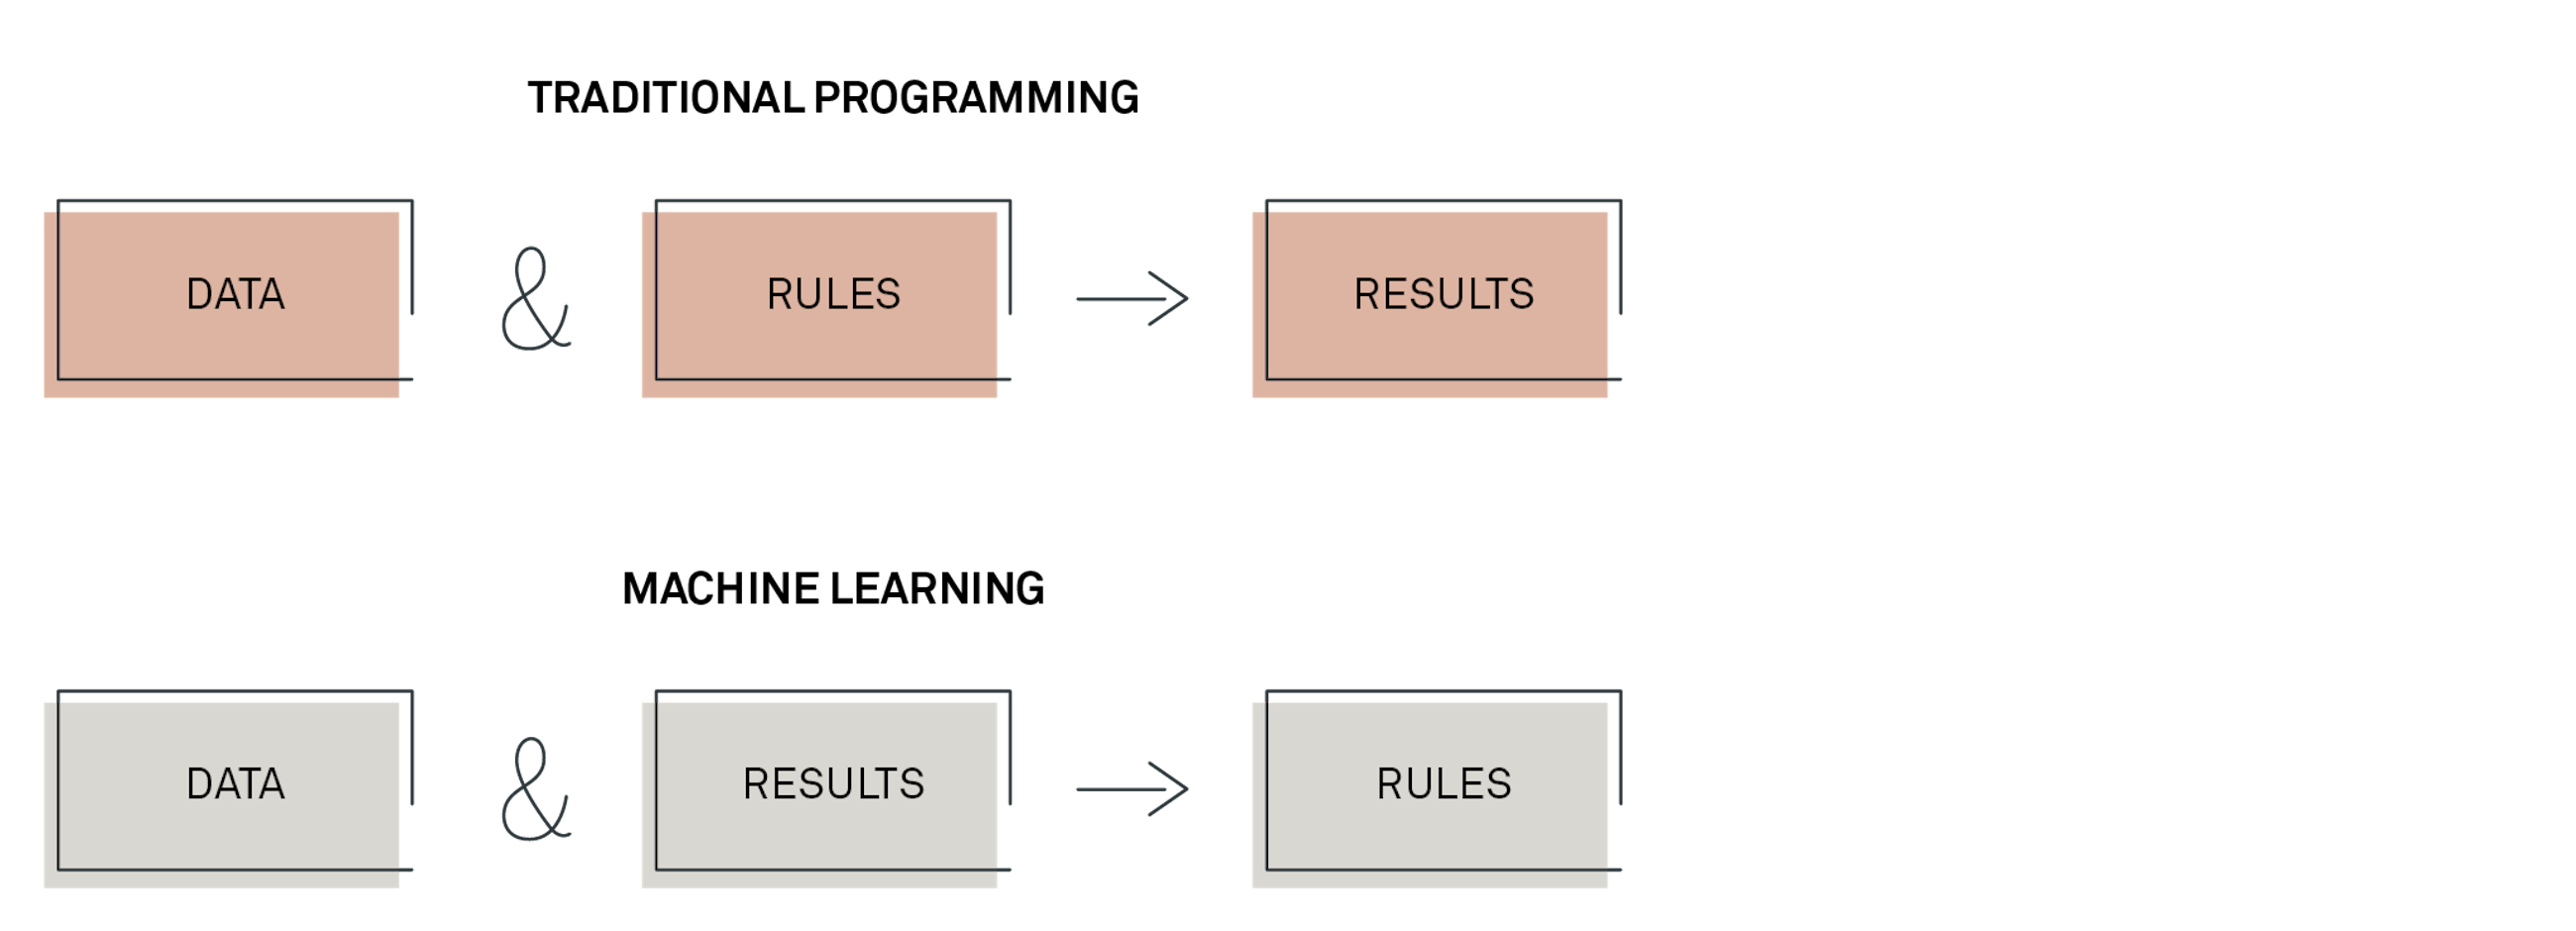
Everyone working with data has done some programming. Creating a new column in Excel which is the sum of two other columns is also programming. In traditional programming, the way you get results is to apply rules – documented or experience-based – to data. In machine learning, the chain is a bit different in the sense that we use data and knowledge about past results to train the computer to identify the behaviour generating results. Put differently, we tell the machine how to learn from data, and it will then identify the rules driving results on its own.
The reason why this is so powerful is that it enables us to deal with problems that were hard – or even impossible – for computers to solve before. As an example, look at the picture of the number 4. The picture consists of 28x28 = 768 pixels. To represent the picture as something a computer can understand, we convert each pixel to a number indicating the colour intensity. How would you solve the problem of using a computer to recognise that digit?
In a traditional paradigm, one would have to define if-then rules covering all possible combinations of pixels and colour intensity. That’s a lot of if-then statements. Additionally, a system that is only able to recognise the number 4 has little use. Wouldn’t you also want to be able to recognise the remaining 9 digits? The point is that the number of if-then rules would explode, making it impossible to solve this problem in the old paradigm.
In machine learning, what you would do instead is to collect data with pictures of digits and information on which number is in the picture. You then input this data into an algorithm that will then learn which characteristics of a picture correspond to the number 0, to the number 1 and so on.
As an example, look at the picture of the number 4 below.
It’s no wonder that people working with demand forecasting are looking to machine learning: “How can we use machine learning to identify and exploit patterns and separate signal from noise in our data?” However, there are some important characteristics of machine learning that one should be aware of and how they compare with how we work with data and S&OP.
These characteristics matter individually, but some of them also exacerbate each other. However, before shedding some light on some technical considerations, it’s important to remember that the key question is not technical. The key question is how much we gain in terms of forecast accuracy from introducing new technology. Especially new technology that might add layers of complexity on top of what we are doing today.
To ease the comparison, the following assumes that we are working with time series data, i.e. data measured equidistantly across time with the typical frequency in S&OP being monthly. It also assumes the somewhat artificial (pun intended) distinction between traditional time series methods and modern machine learning methods. One could argue that since traditional time series methods also try to identify patterns in order to predict the unknown, they can in fact be considered machine learning. The following, however, assumes that traditional time series methods and machine learning are different beasts.
The first characteristic of machine learning models relevant here is that they are famed for being very data hungry. It obviously depends on the data and problem at hand, but suffice to say that you don’t get very far using for instance a neural network on the 36 months of data you often have to contend with when working with data for demand forecasting. This is not a function of the data being time series data but the number of data points. I’ve come across examples of neural networks being used for forecasting in high-frequency domains such as energy consumption, where you have data at an hourly frequency or higher. In this scenario, the number of data points can quickly run into the hundreds of thousands.
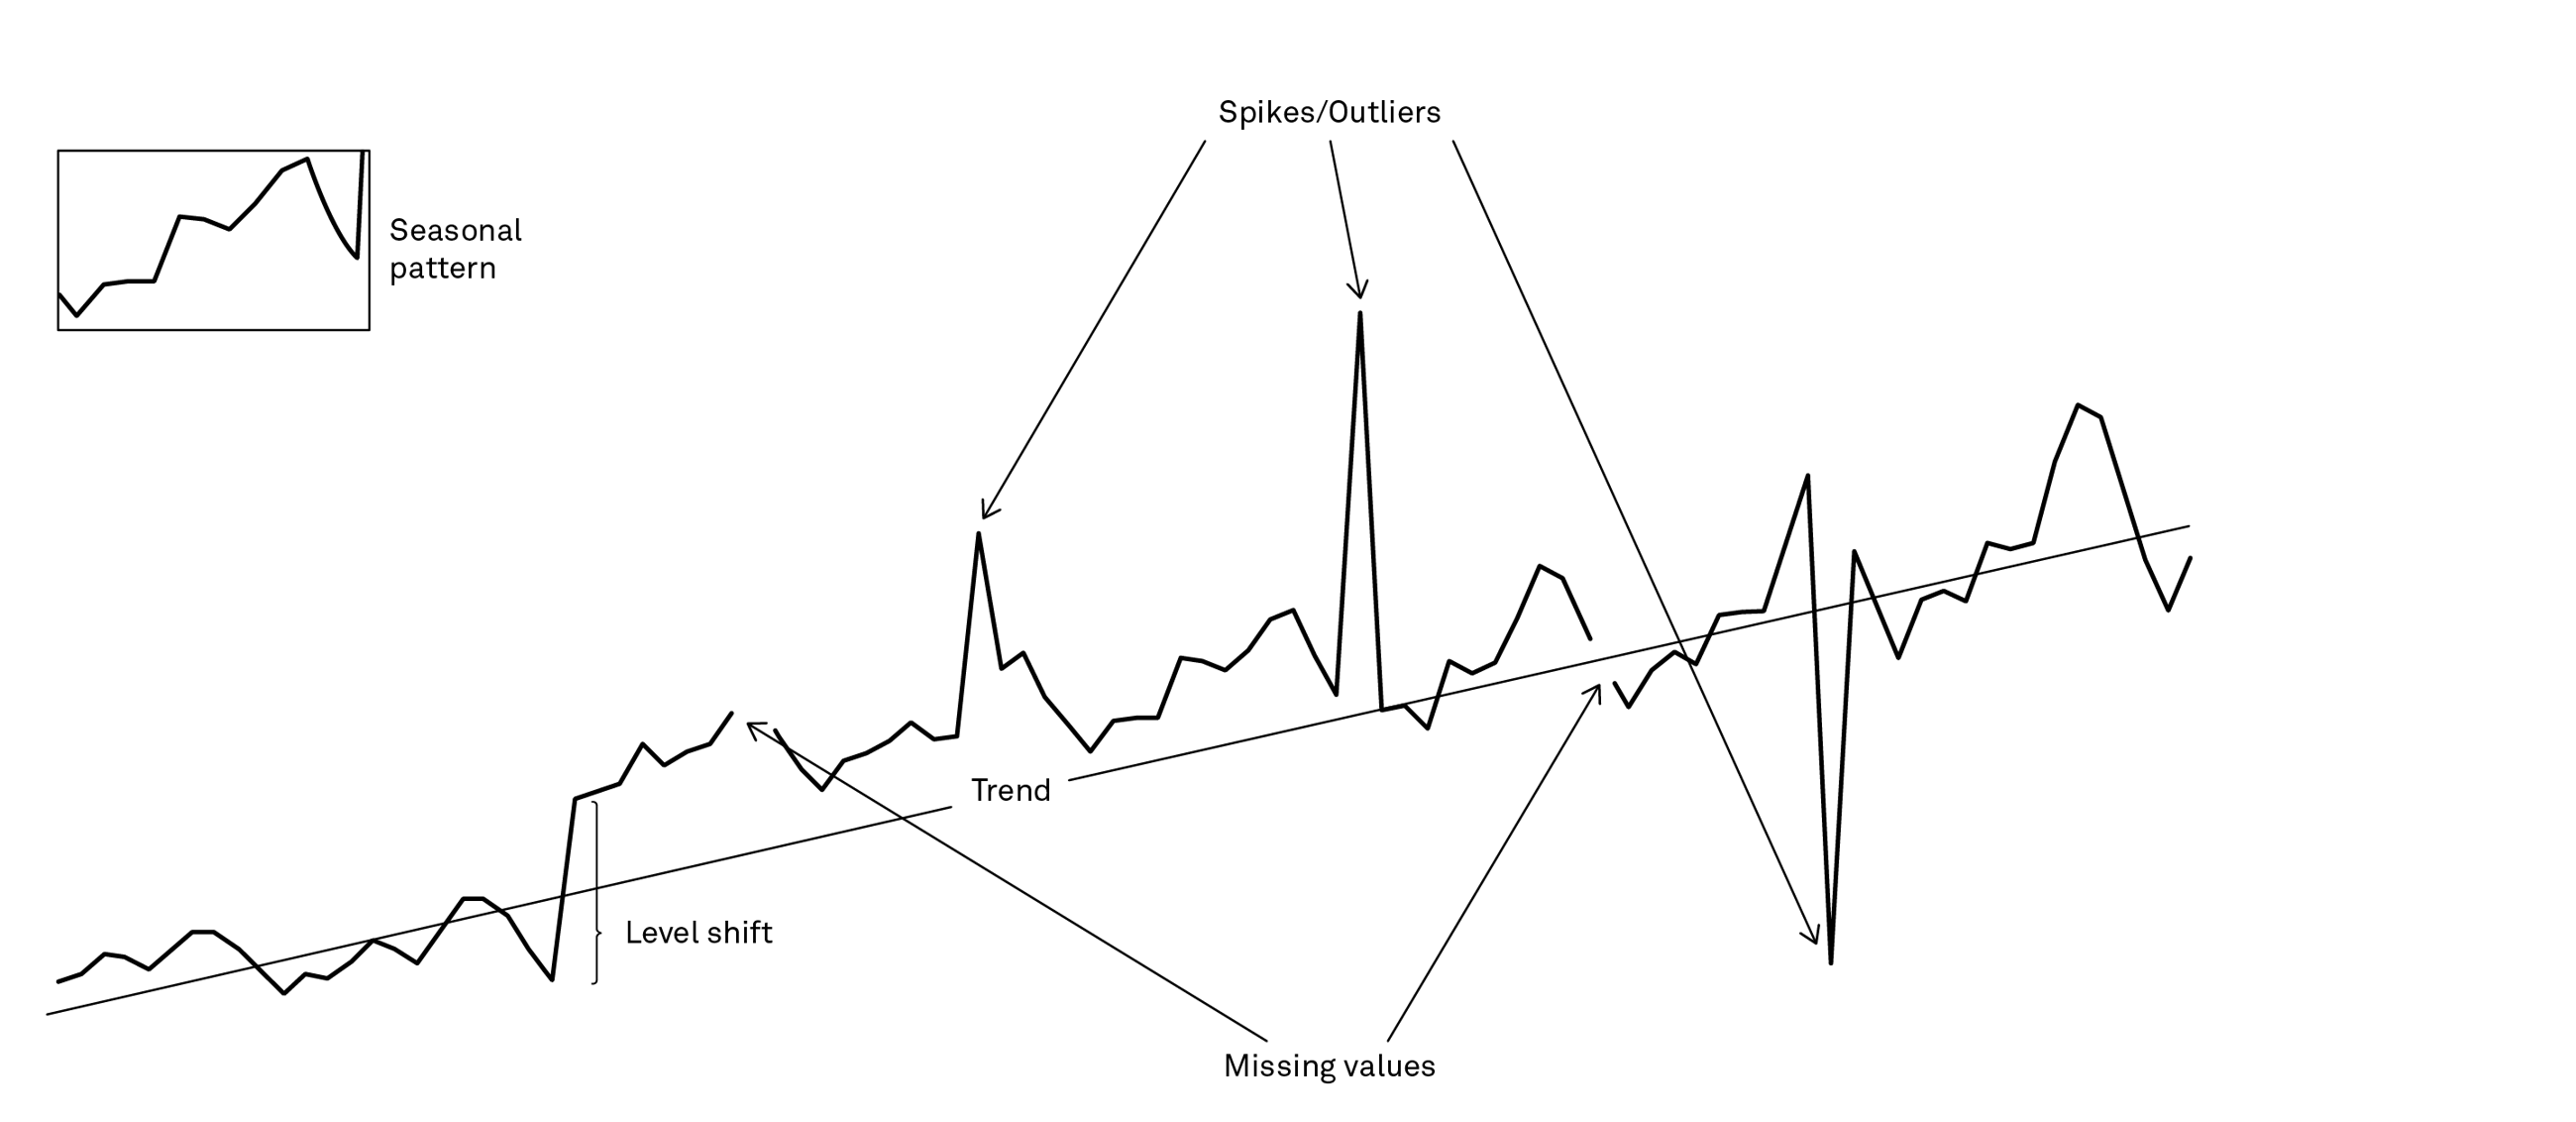
Remaining in the realm of a single time series, what is also characteristic about some machine learning models is that they do not have a concept of time. Traditional time series forecasting methods, on the other hand, are very much “time aware”. They are essentially creating forecasts that are just weighted averages of the past, where recent periods are given a larger weight than more distant periods, also considering factors such as trend and seasonality. If you want to use machine learning models, you will need to make them time aware by engineering your data in a way so that they explicitly contain seasonal factors and trend and making sure that more recent periods are more important.
Some machine learning models such as Long Short-Term Memory (LSTM) models are of course able to accommodate this, but it’s not standard for all machine learning methods. Additionally, you will need to figure out how to deal with both missing values and outliers. So therein lies the rub – a lot of stuff happening at the level of the individual time series but not a lot of data to be able to separate the signal from the noise.
So far, we’ve only considered a single time series. However, when working with demand forecasting, we often work with data at the item/location level, where several thousand different time series are quite common. This means that our entire set of data potentially can be quite huge. In other words, we are entering the domain of “large-scale forecasting”.
The big question then is: Couldn’t we just use machine learning on all that data? In theory, the answer is yes. For practical purposes, it’s not as straightforward as that. The output of our efforts is fed downstream through the planning process, where planning is done for each item/location combination. This requires that forecasts are generated at this level. Obviously, this can be achieved by using machine learning models, but it might require some tweaking, depending on the actual model used. Also, since time series in the current context tend to be short, it’s often a requirement that our modelling setup is updated, once new data becomes available – for instance monthly. This is somewhat different from how many traditional machine learning systems get updated, which is when your model monitoring shows signs of degrading performance.
The above needs to be seen in combination with other requirements that we have for the output for planning purposes. Sales and operations planning is essentially a negotiation process, and to facilitate negotiations, we often want information on what drives the forecast – what are the effects of trend, seasonality, promotions etc. In other words, how do we enable the generation of interpretable output which accommodates different effects of demand drivers for each item/location combination? It’s not enough to state for example that our sales generally have an upward trend.
We need to be able to have different trend information for each item/location combination. Additionally, since part of the subsequent planning most likely involves inventory planning, we need some measurements of forecast uncertainty as input to inventory planning. The traditional time series methods provide confidence intervals for the forecasts we can use. How can we get confidence intervals for our forecasts – for each item/location – if we use machine learning models?
The above points to some technical questions which the use of machine learning in the context of S&OP must be able to answer. However, even in those instances where these technical questions have been answered, evidence has indicated that more complex machine learning models in fact do not produce more accurate forecasts. Some papers show the opposite for smaller problems involving one or just a few time series, but the fact of the matter is that in the domain of large-scale forecasting, more complex models do not yet consistently outperform simpler models in terms of forecast accuracy.
The keywords in that last sentence are “simpler” and “yet”. In this context, “simpler” refers to time series models ranging from a random walk to various ESMs and ARIMA models. If you haven’t previously considered time series methods to support your demand planning activity, the good news is that there are a lot of options to choose from, if you want to pursue this area.
Most planning software vendors have some capabilities in this area, but more specialised vendors such as Autobox, Forecast Pro and SAS also have offerings in this space. If there’s a preference for open source technology, which is the de facto technology standard in machine learning, Rob Hyndman’s Forecast package in R could be an option to pursue. Another open source option could be the Facebook Prophet package (running both in R and Python), which offers a novel approach to time series forecasting. Aspiring as well as experienced data scientists have competencies in either R or Python, making open source tools a natural starting point. A somewhat advanced approach to complement traditional time series methods is to work with hierarchical forecasting – across time, geography, product categories etc.
The obvious benefit is having forecasts that “add up” across the different levels in the hierarchy. The perhaps not so obvious benefit is that you can exploit the fact that the signal-to-noise ratio often is higher at more aggregated levels of the hierarchy and pushes the identified patterns in the forecasts at the aggregated levels down to forecasts at the disaggregated levels that will feed into downstream planning activities.
The word “yet” is important because while machine learning might not be a viable option now, a lot of research, development and experimentation are being done in this area. Given how machine learning has been successful in other business and data domains, the bet is that it will happen in S&OP at some point. Amazon, for instance, already has a commercial offering called DeepAR. However, some evidence suggests that performance is still underwhelming compared to simpler methods.
See for instance this comparison of DeepAR and Facebook Prophet.
The most promising results to date have been the results of the M4 competition by e.g. a team from Uber that developed and implemented an approach involving a combination of machine learning and traditional time series methods. The cost, though, was compute time measured in days rather than hours.
So, while we’re not quite there yet in terms of machine learning models consistently performing well in large-scale forecasting scenarios, there is light at the end of the tunnel. Already now, you can start preparing for what the future holds.
The obvious starting point is deciding what forecast accuracy improvements are worth in your organisation. Armed with that information, you can start exploring the options which are already available today. Given the low barrier to entry provided by access to free open source tools and data science competencies familiar with these tools, this makes a good starting point.


