Article
A road map to a transparent supply chain enabling profit-driven decisions based on one set of numbers

Article
Read more
7 December 2021
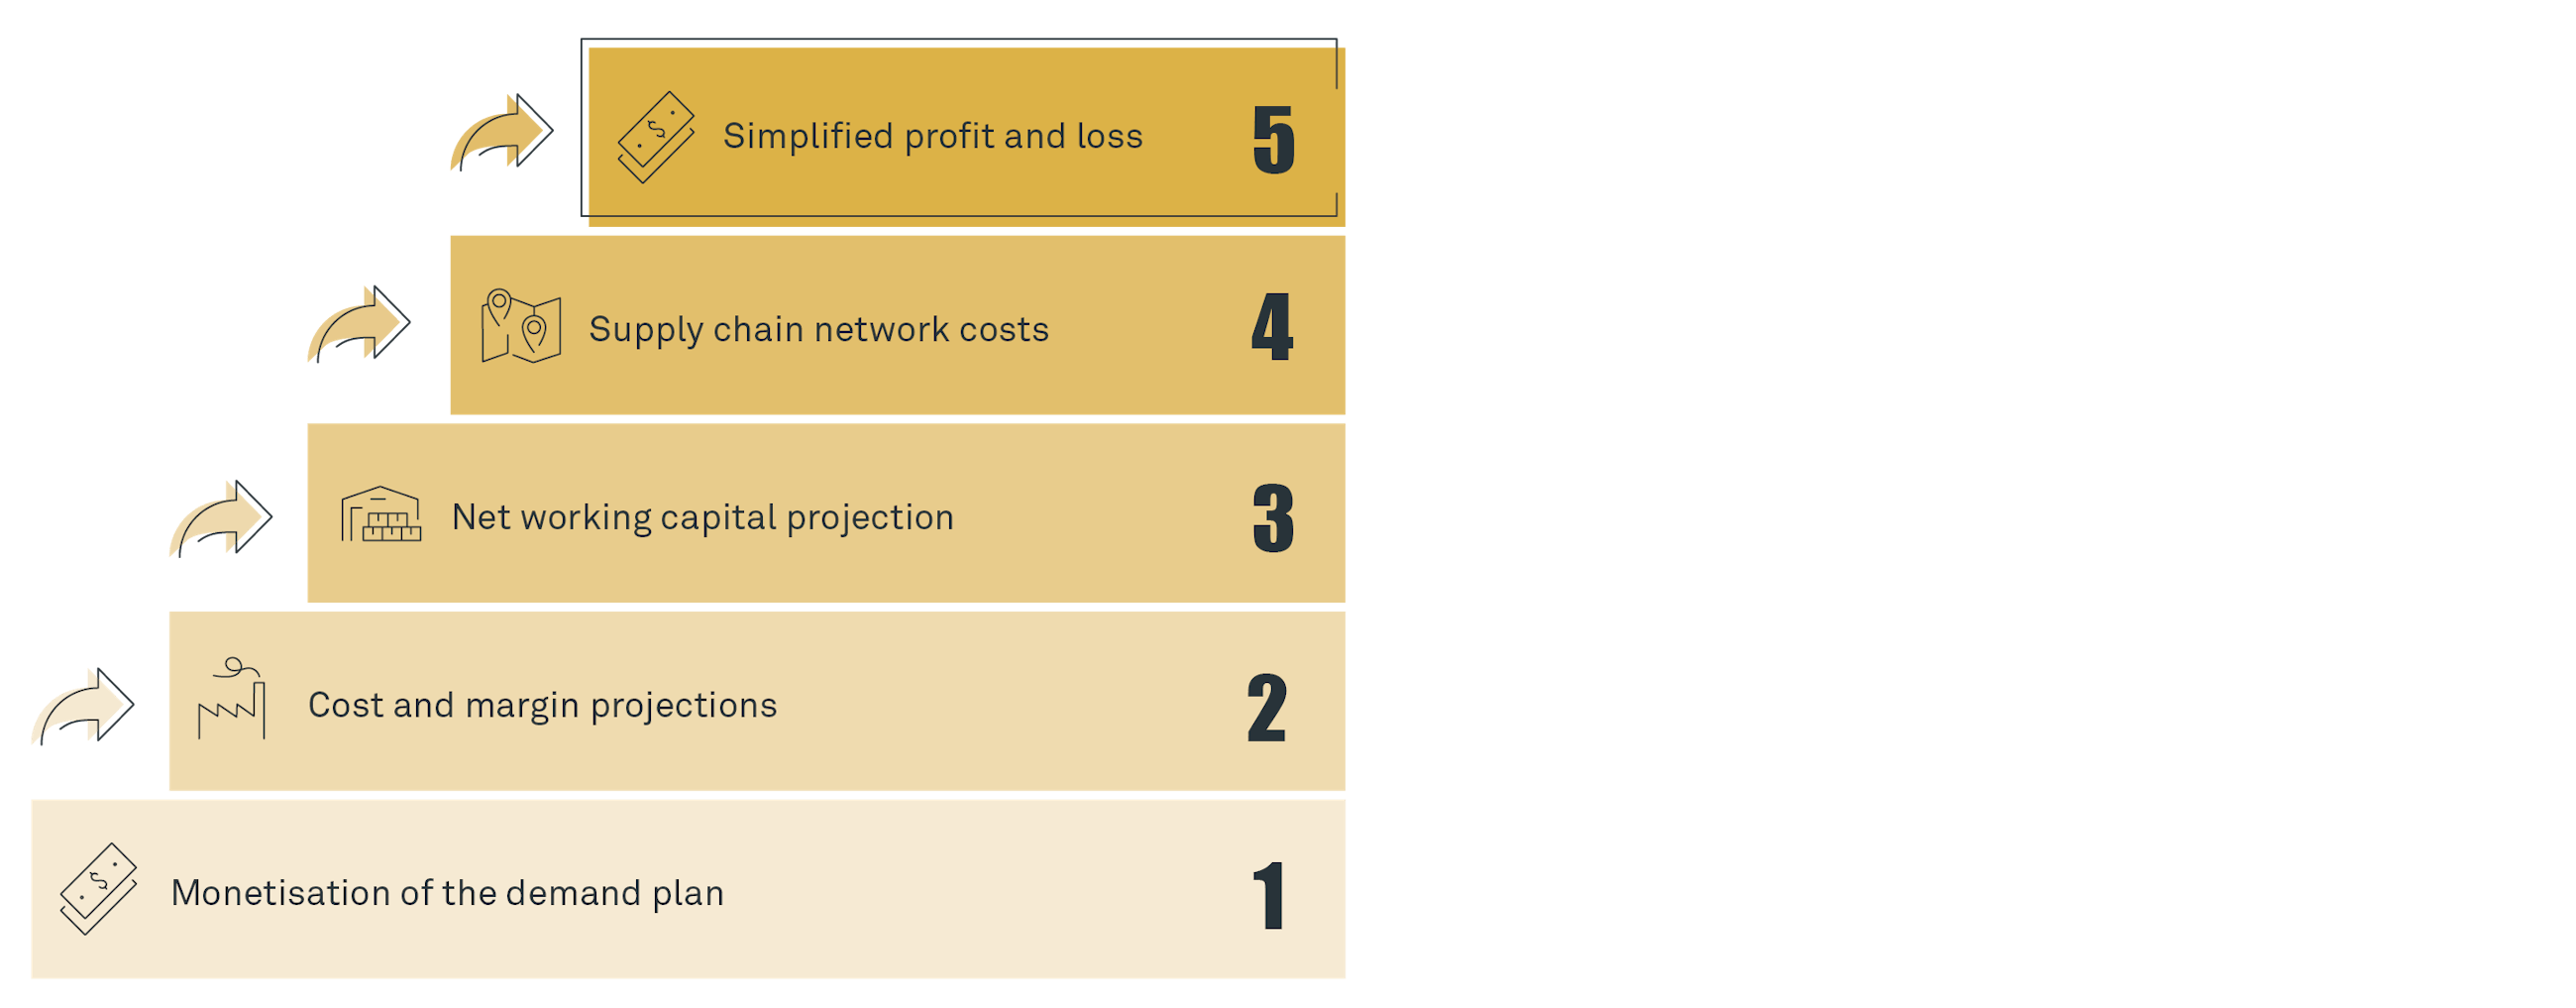
Establishing a profit-driven decision-making process should be at the top of the agenda for most organisations when it comes to planning. However, reaching this stage is not easy and should be considered a continuous journey. To support and ease this journey, Implement has developed a five-step approach of getting to Integrated Business Planning.
This article focuses on a client case where the fifth step of the journey towards integrated business planning was successfully implemented. The step covers a simple P&L that can support companies in visualising different scenarios of expected cash flow and earnings together with expected costs.
We refer to this integration of processes between operations, sales and finance as integrated business planning, or in short, IBP. IBP and S&OP are not necessarily different. However, we see IBP as a natural extension of the S&OP process, where financial planning is highly integrated into the Sales and Operations Planning process.
A supply chain director
The case considers a European-based company with a global footprint and revenue of approximately EUR 2.5 billion. The company operates in the commodity sector meaning that it is affected by a volatile market price. It is also within the process industry, relying on expensive assets where capacity increase comes at a huge cost. This leads to a scarce supply because most of the companies in this area are behind on the capacity curve (i.e. not investing in new capacity unless the utilisation of the new machinery will also be close to its maximum). This also means that the entire produced quantity can usually be sold.
Consequently, customer prioritisation becomes the major lever with which to steer the business. The prioritisation can be made based on relevancy of the customer, strategic fit or expected profit. Around 80% of the available supply is allocated to customers based on contracts negotiated the year before. Therefore, the company goes through an annual planning cycle to identify the unconstrained demand and the expected production output in order to allocate the volume to individual customers for maximising long-term profitability.
In the past, this process was done primarily in Excel and based on historic figures, i.e. profitability per customer from the previous year. As a result, profitability steering was less effective and very time-consuming due to a lack of transparency and frequent data inconsistency. In addition, the company was unable to quickly simulate the volatile market price scenario to manage the risks and prepare contingency plans. Therefore, the company decided to implement SAP IBP as their new planning tool and to modify existing processes to take advantage of the tool’s capabilities.
SAP IBP supports planning in volume as well as financial figures, which bridges the gap between volume and profitability planning. In addition, its strong calculation engine enables simulating and comparing different scenarios in order to mitigate risks and identify opportunities.
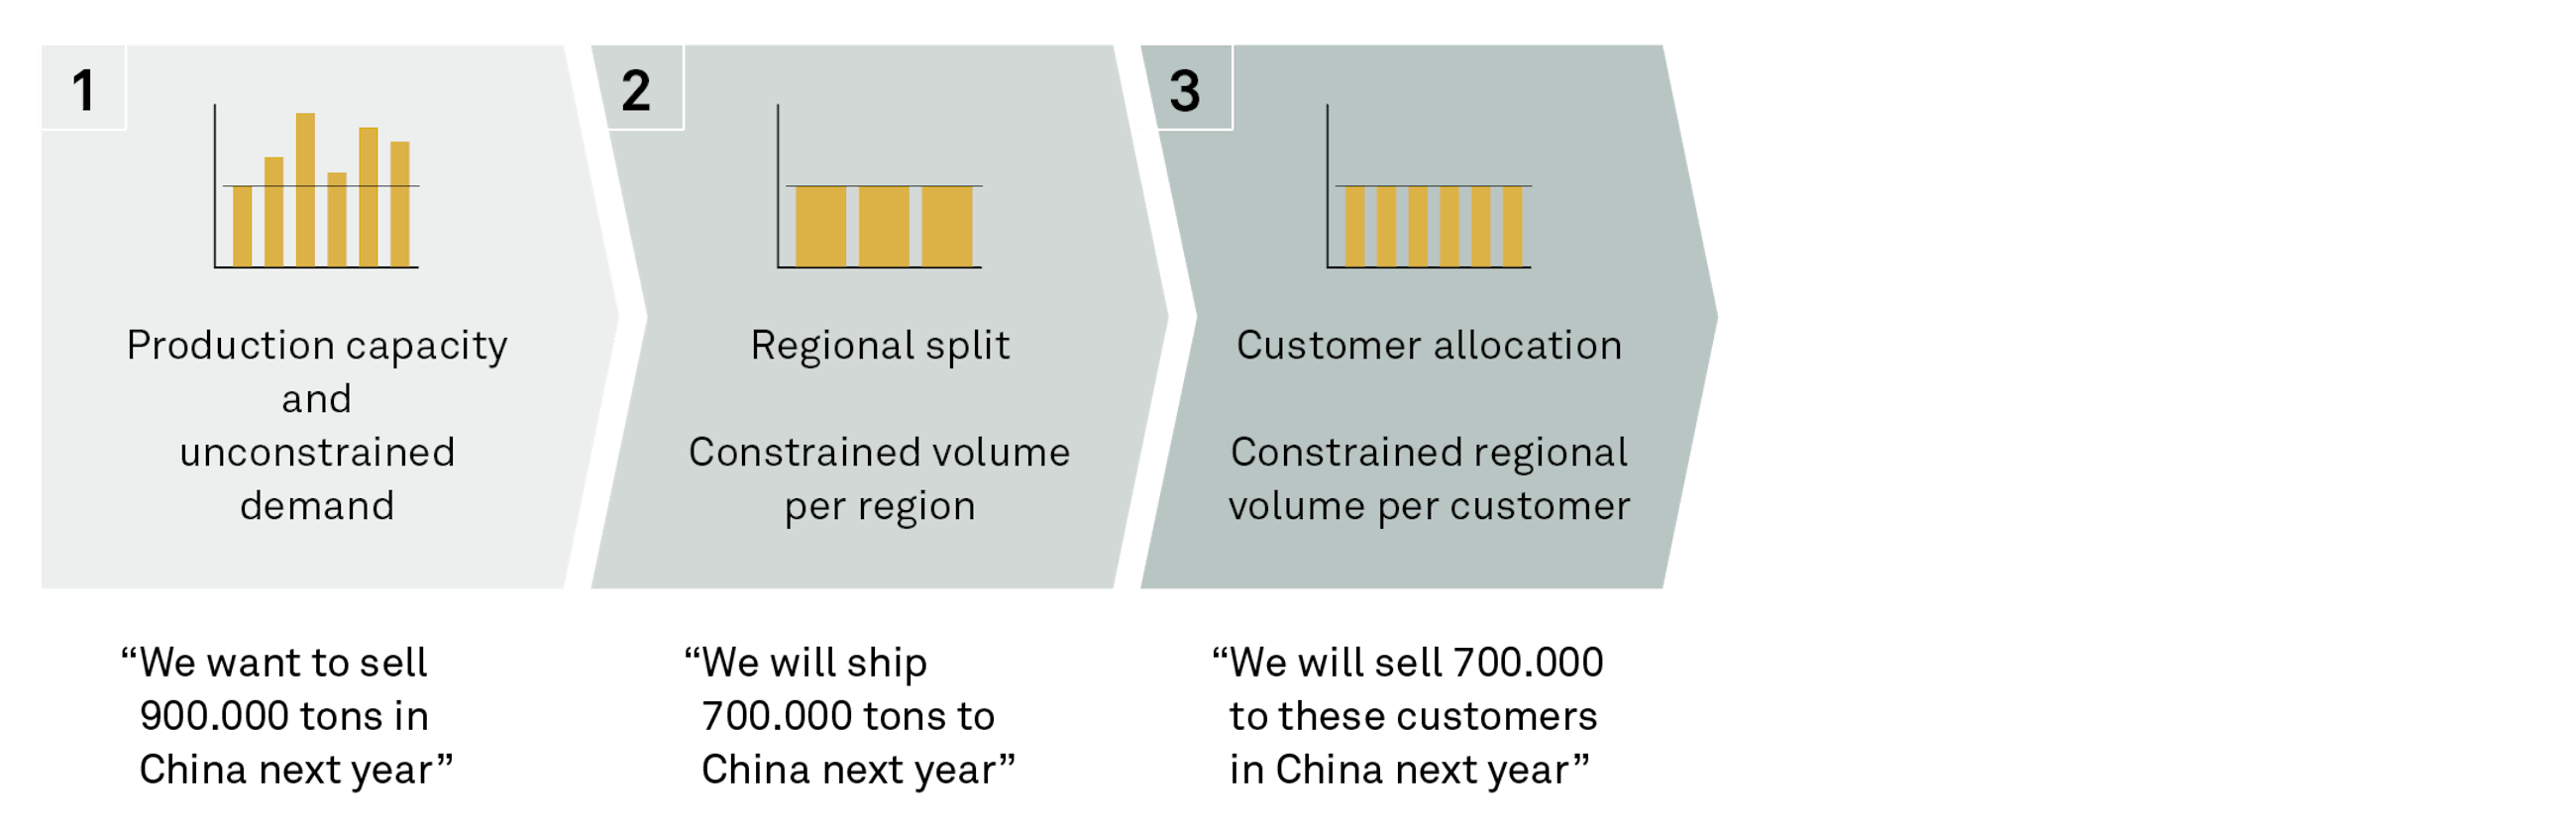
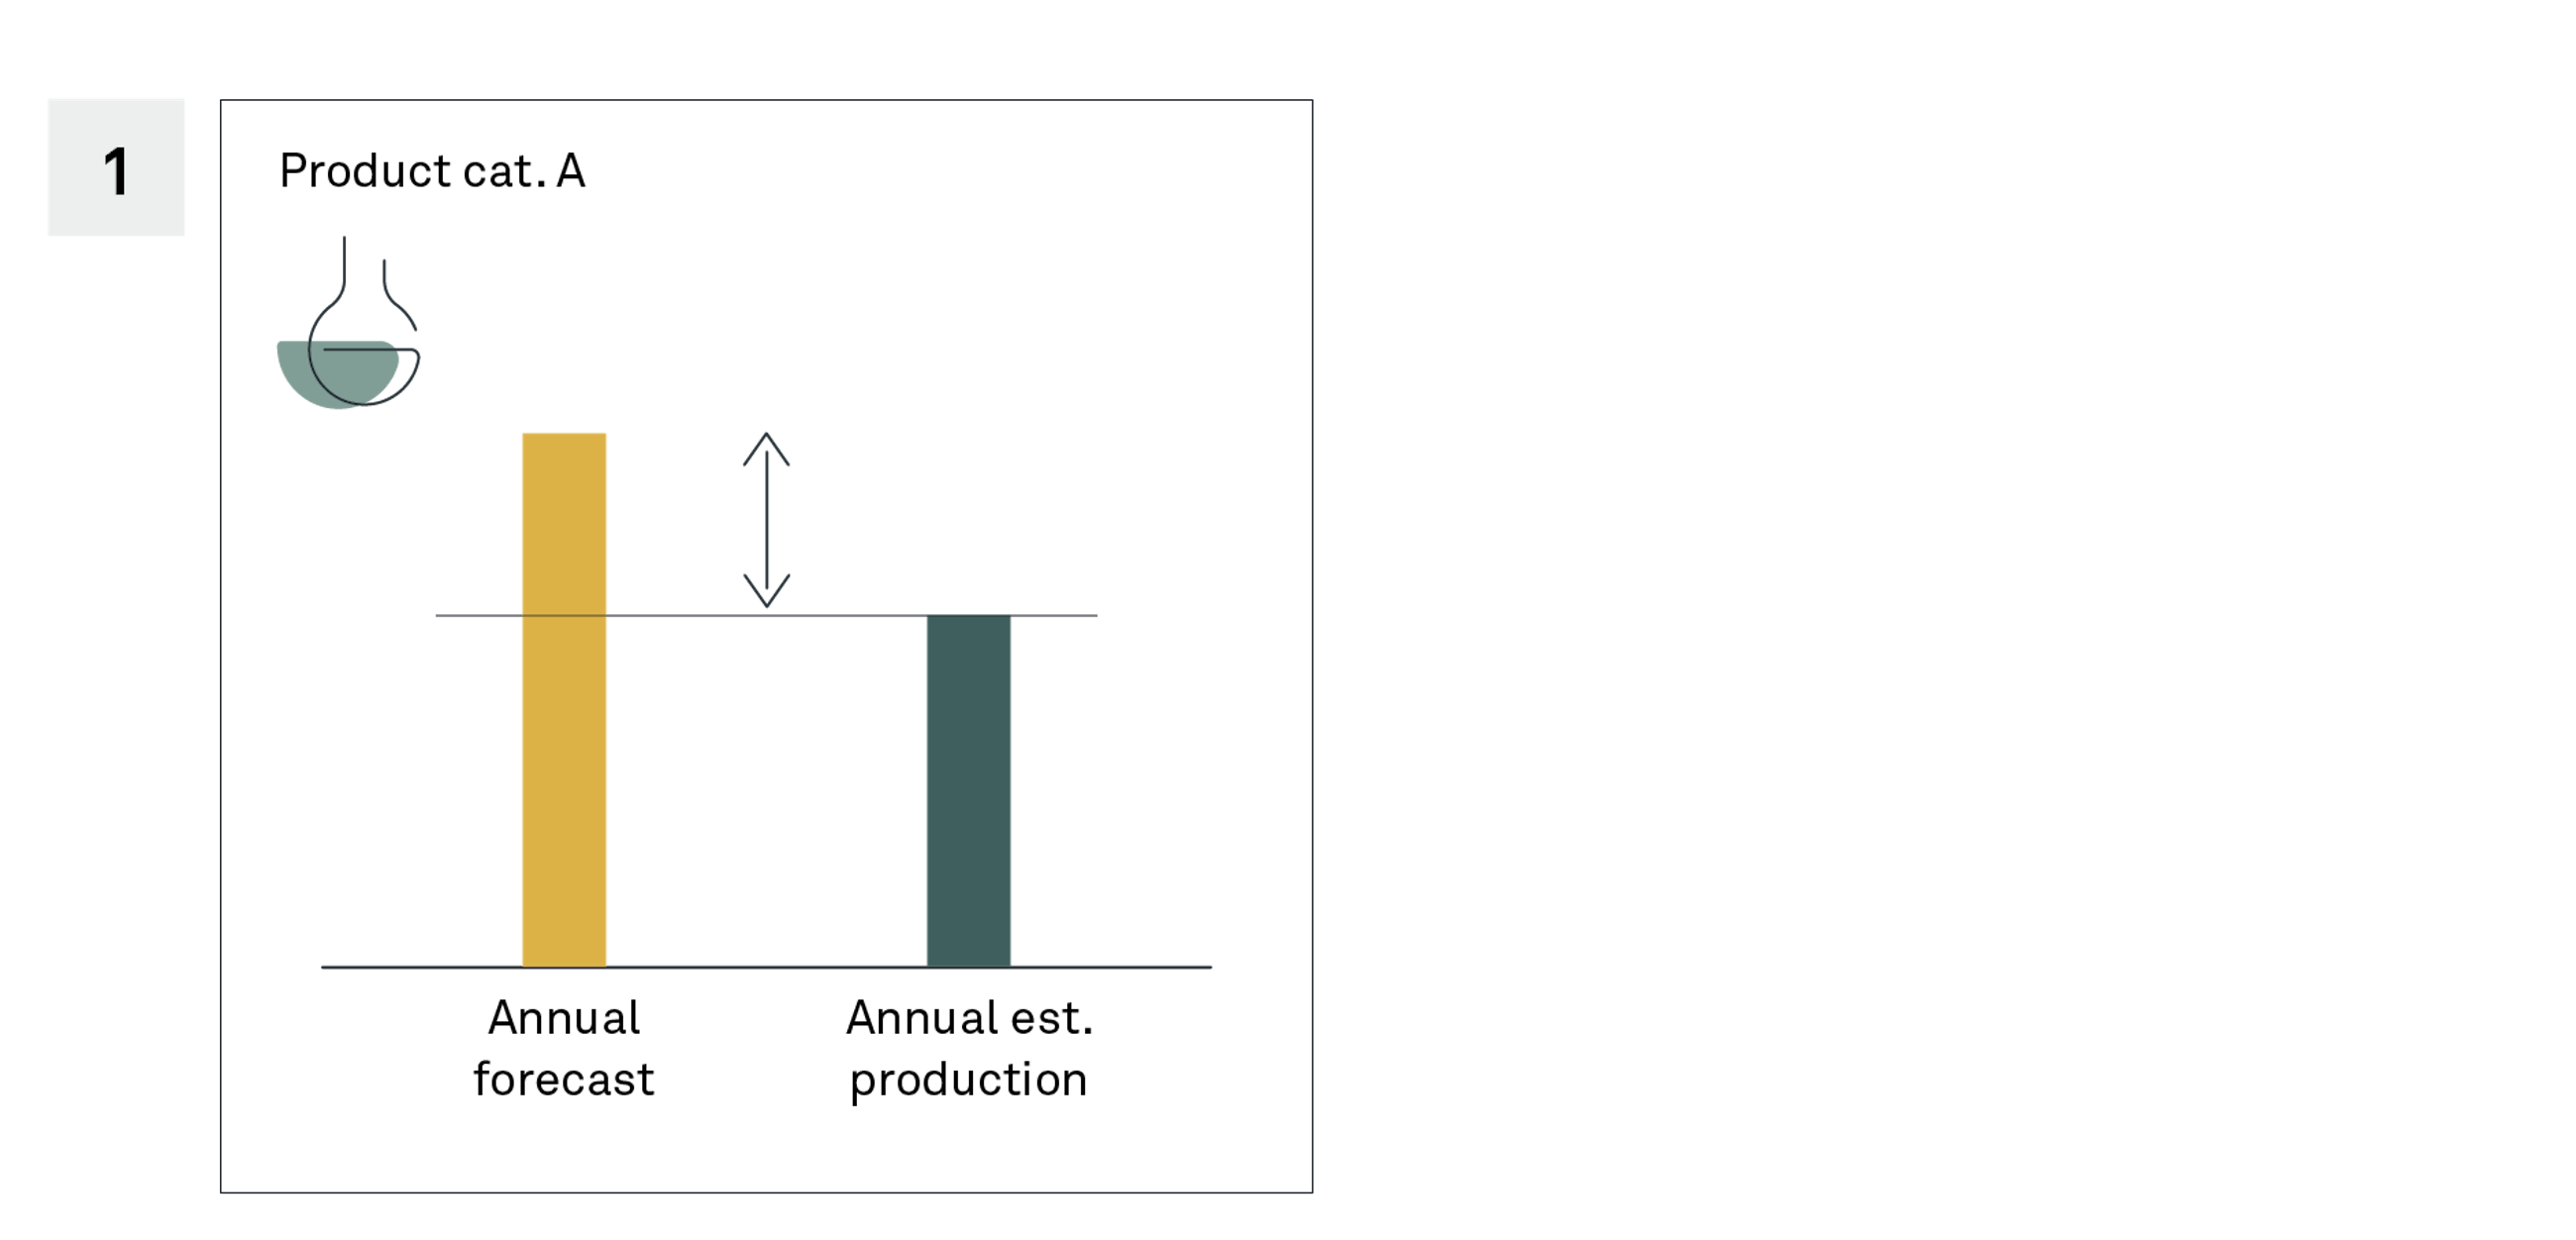
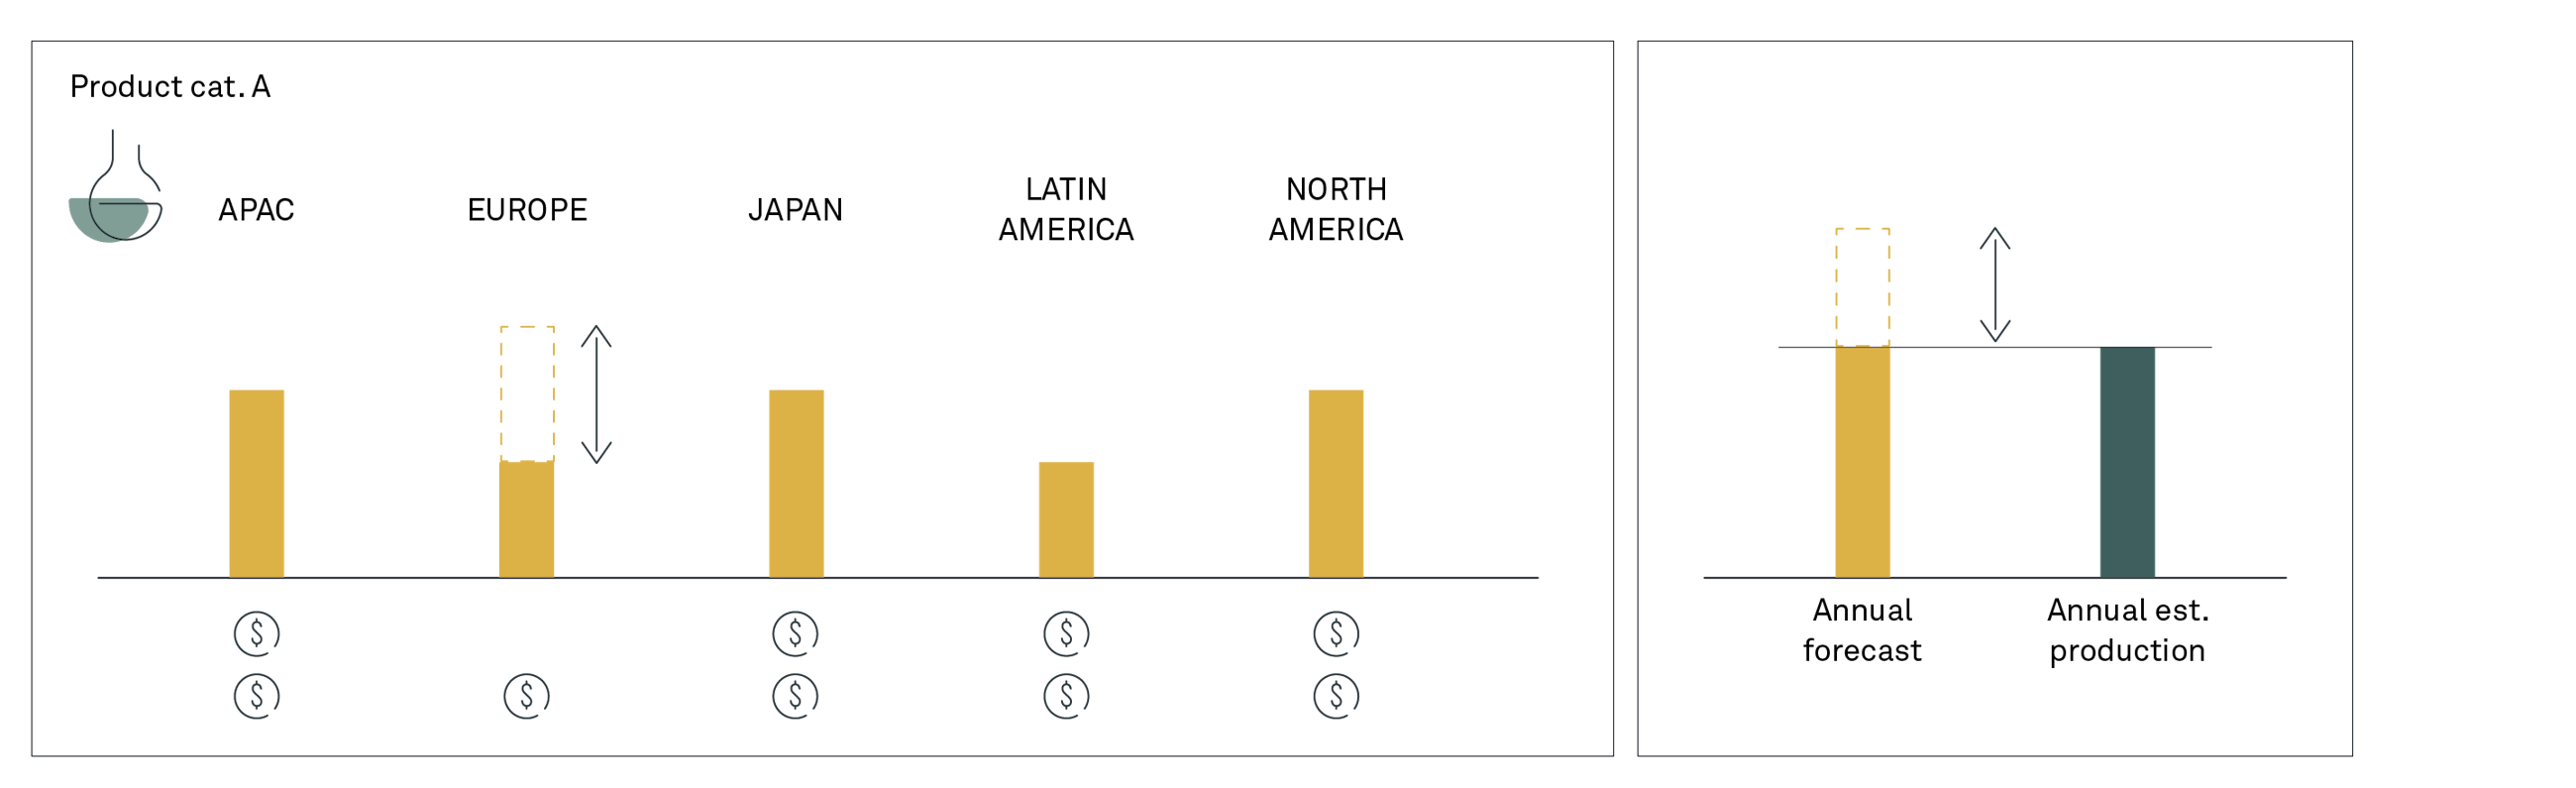
In the first step, the company identifies the total production per product category and the unconstrained demand per individual customer and product for the following year. The illustration below shows that for Category A, the Annual Forecast (unconstrained demand) is higher than the Annual Estimated Production. This means that some of the customers will not be supplied.
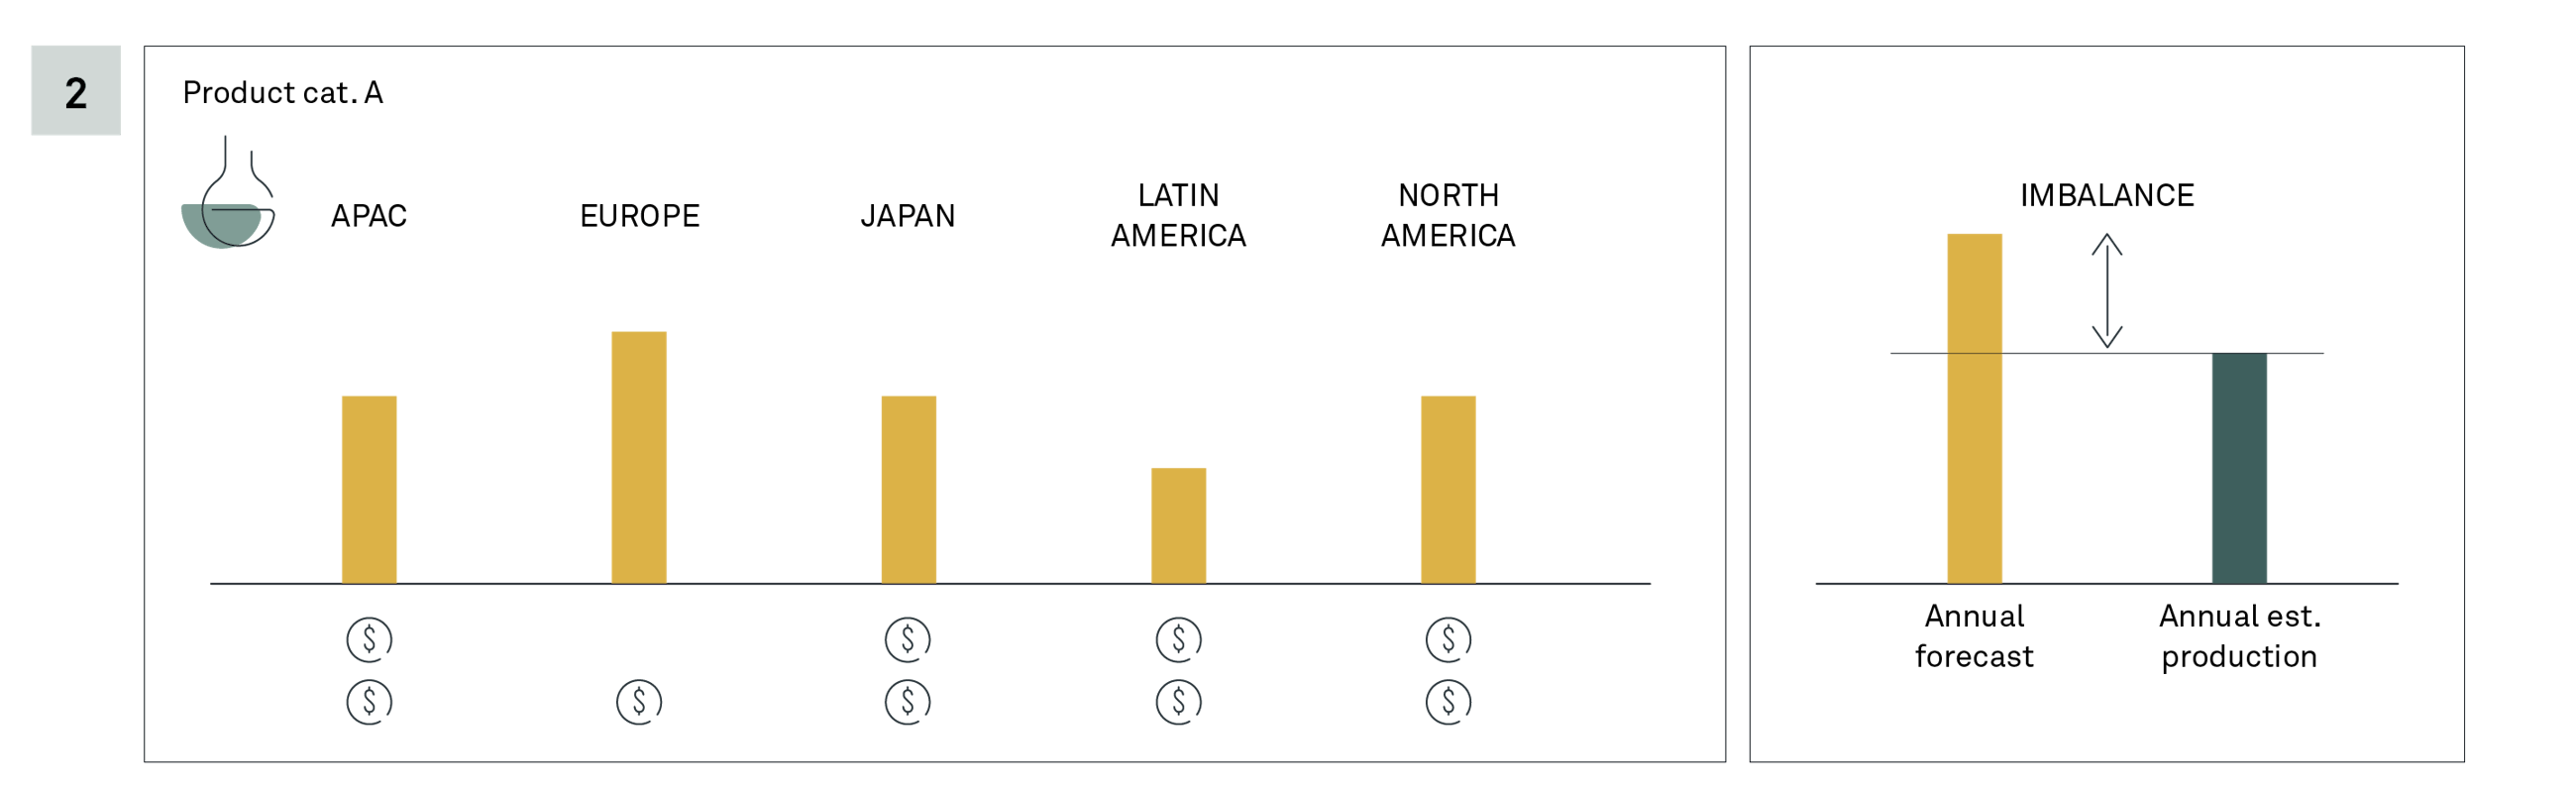
In the second step, regional market price projections are carried out. It is possible to work with multiple scenarios, considering different price and cost projections. This highlights the markets that are less profitable in purely financial terms. The illustration below shows how the contribution margin of the European market is lower than that of the other regions.
Based on the expected profitability and strategic direction of the company, a consensus scenario is chosen, and demand is cut from certain regions. In the illustration below, Europe has been drastically reduced, until the Annual Forecast and the Annual Estimated Production are balanced.
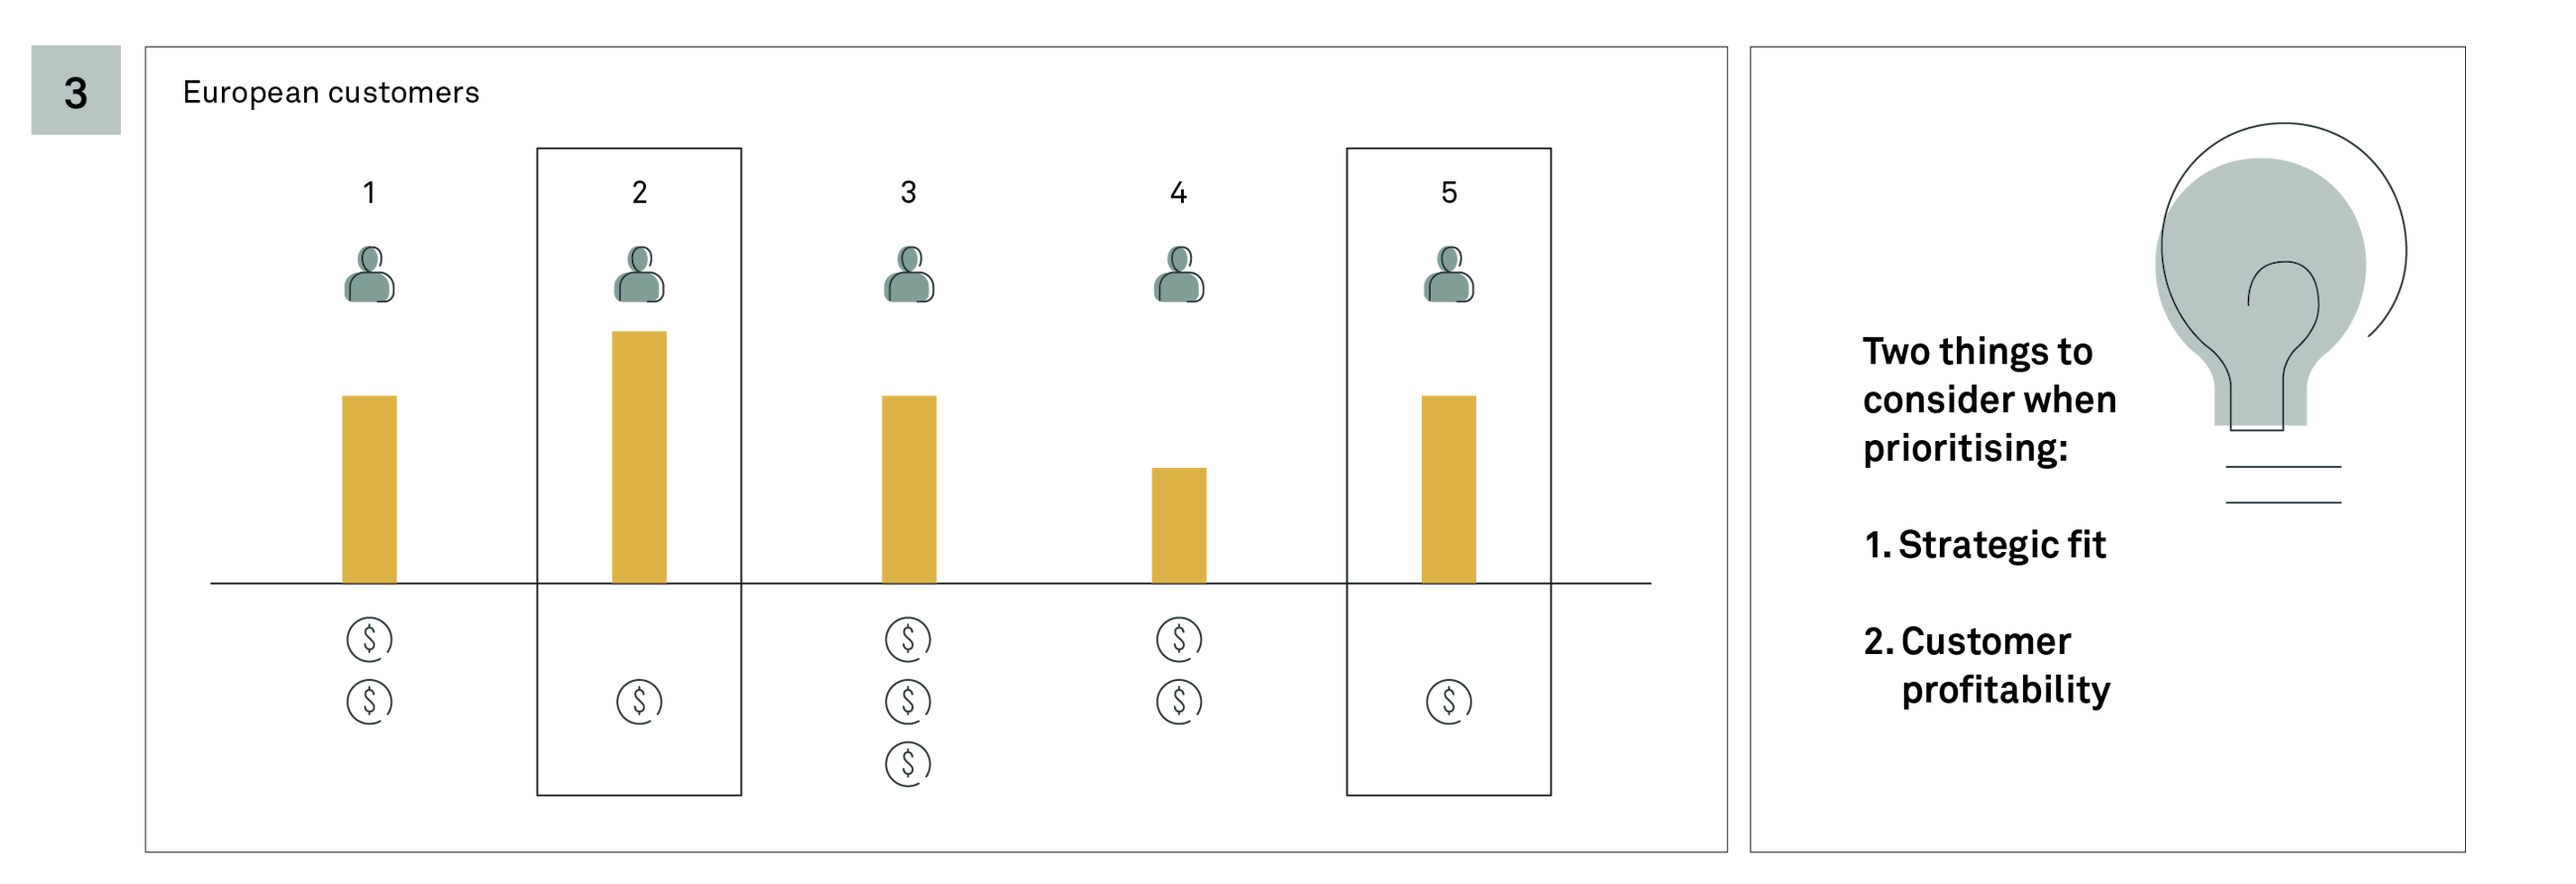
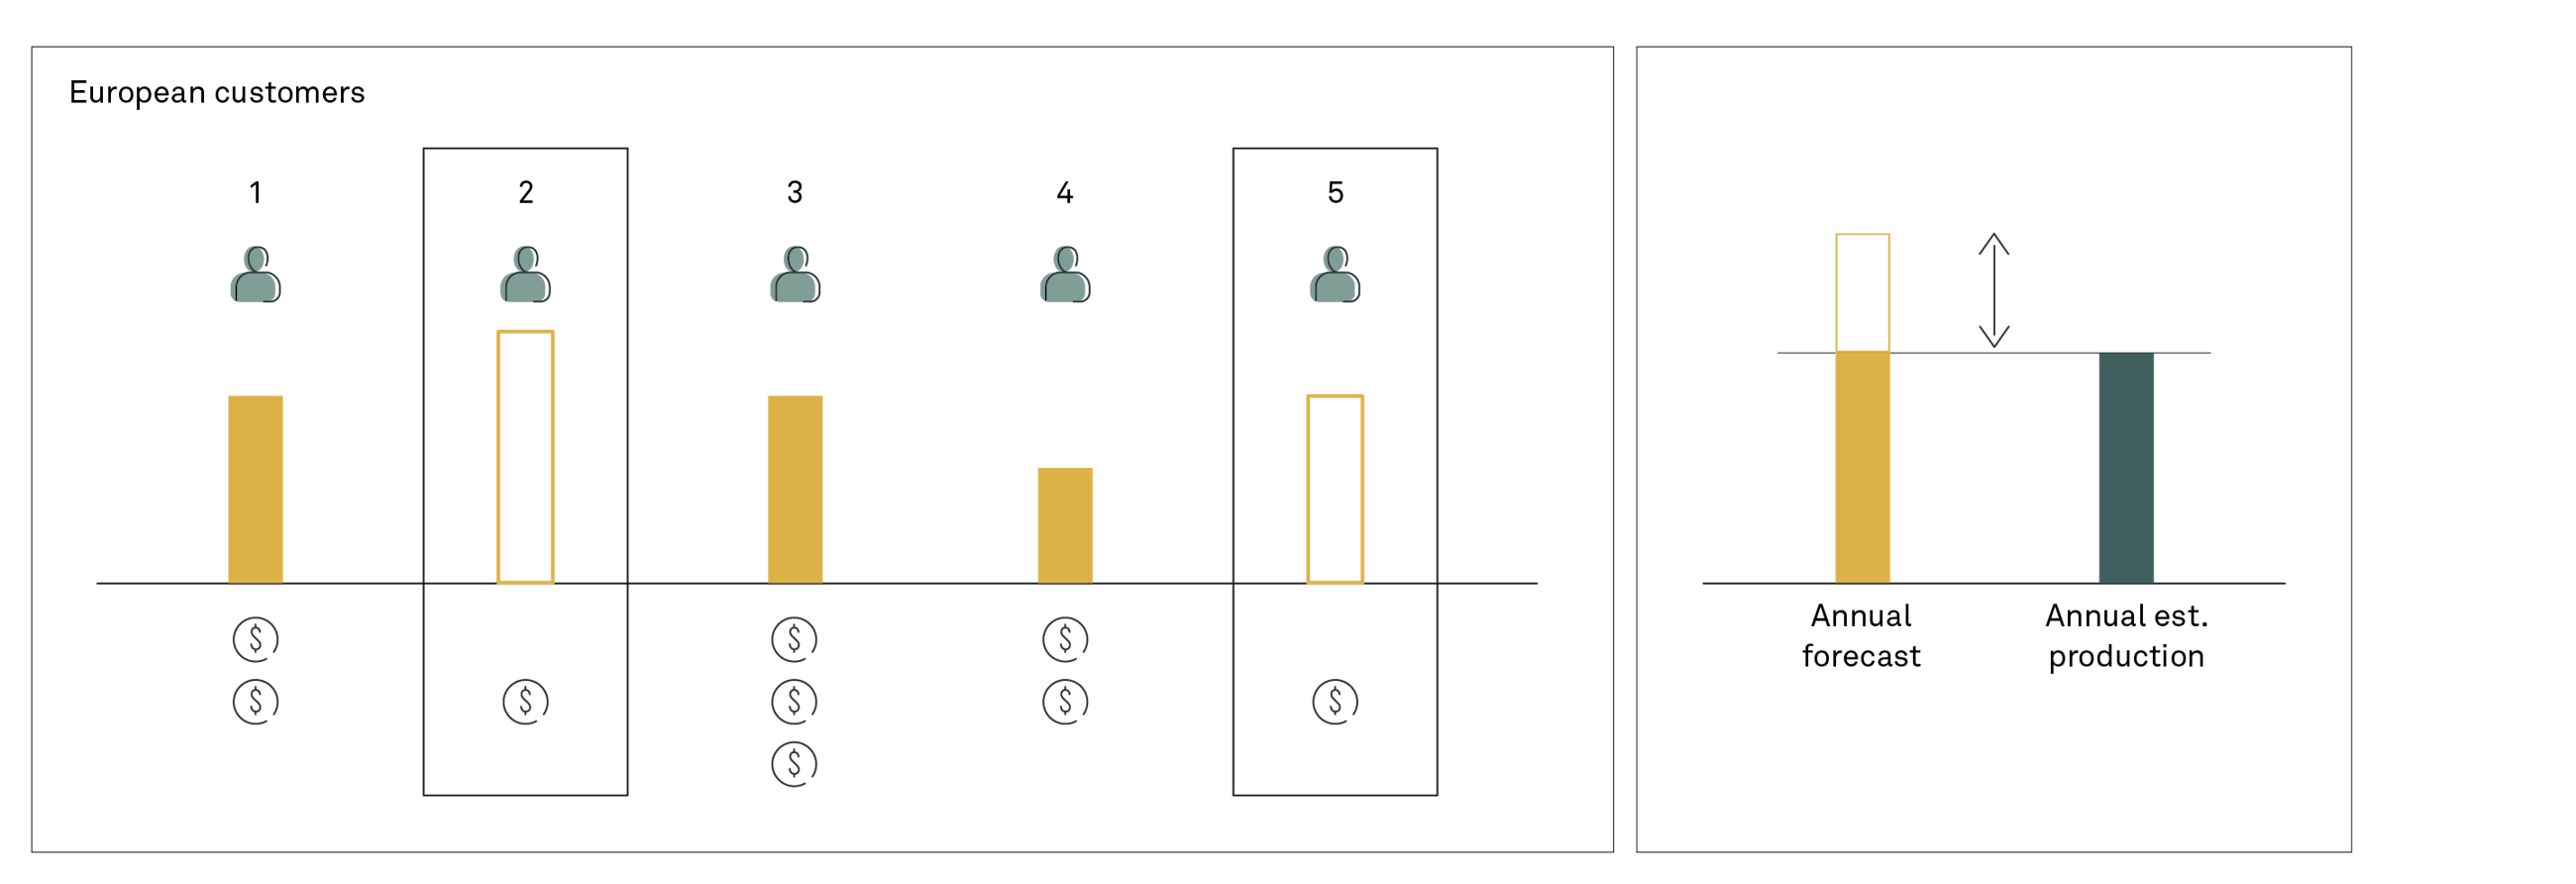
For the regions where demand has been cut, a further allocation has to happen. This takes place in step three. For the region “Europe”, within product category A, customer allocation takes place based on profitability and strategic priorities of customers, i.e. allocating to a growing customer, entering a specific market etc. The illustration below shows how customer no. 2 and 5 are less profitable and deemed not relevant from a strategic point of view.
The forecast of these two customers is reduced in order to balance regional demand with allocated demand. Overall, the Annual Estimated Production now matches the Constrained Demand. This forms the basis for the contract negotiations taking place by the end of the year.
Once contracts have been signed, this allocation is then utilised in the Tactical Planning process which is the weekly planning process.
The above illustration is a simplified example. In reality, the expected profitability of a customer for next year is only one input to the planning process. The strategic fit, i.e. the long-term potential for profitability, plays a vital role. For instance, it is possible to grow customers that are not currently profitable but considered strategic. Allocation can be done to less profitable customers to enter a new market. Allocation can also be done to customers that are less profitable but not subjected to price and cost changes and so forth.
As an outcome of the process, there is a bottom-up plan that can be easily aggregated as required for decision-making. In addition, top level adjustment can be made, e.g. regional allocation, which is then rooted at the lowest level, e.g. customer split.
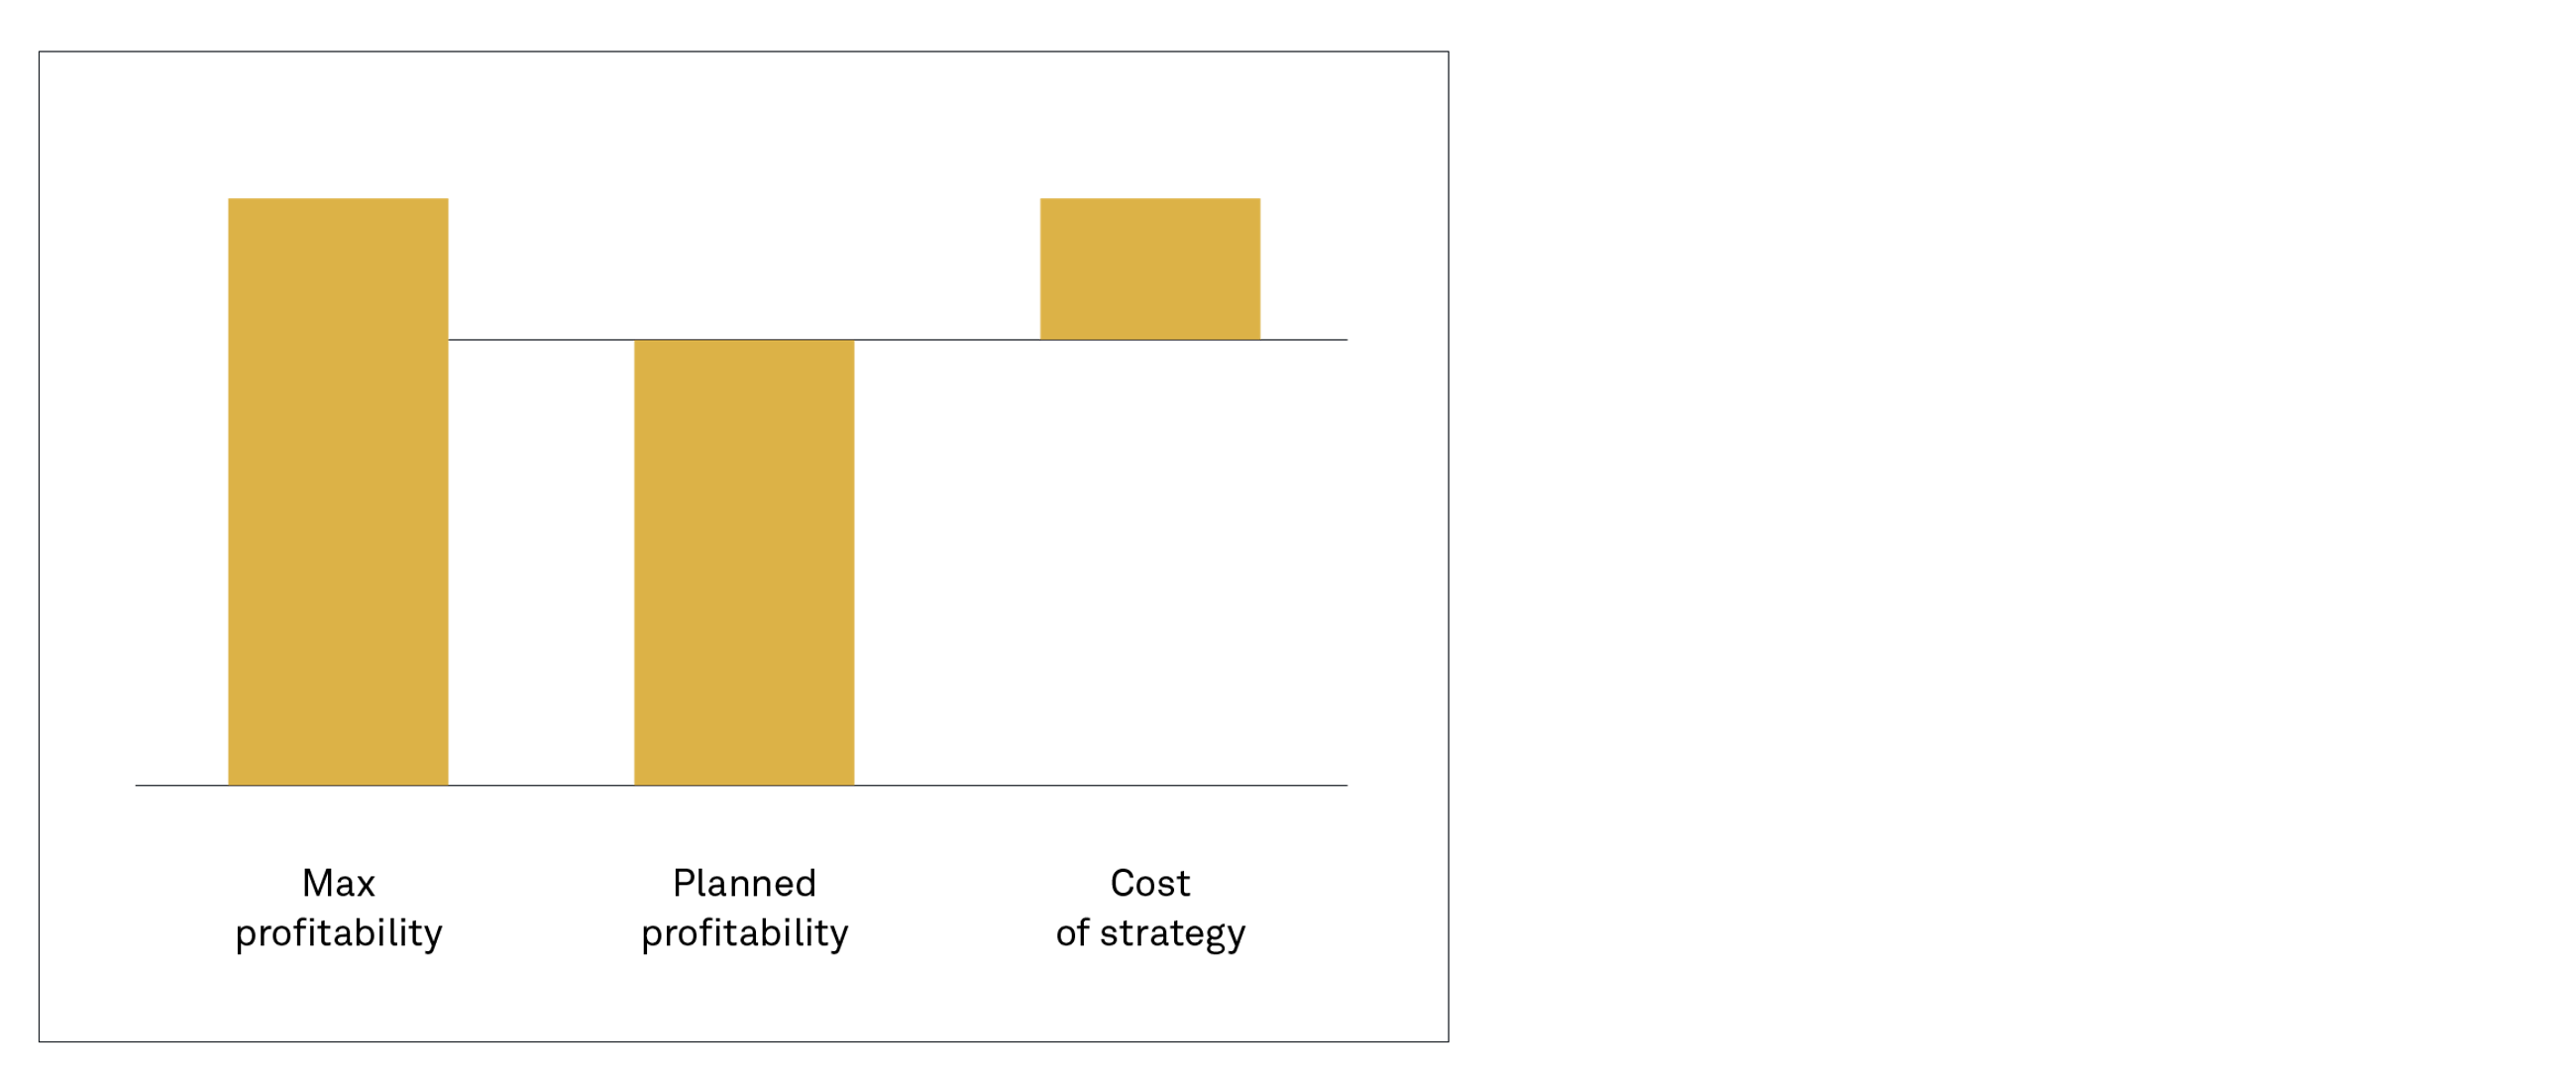
The Annual Planning process bridges the strategy of the company with the more operational plan providing to the CXO level the impact on profit of the strategic decisions and to the sales force a detailed plan to execute. For instance, this specific company calculates the “cost of strategy”. By comparing the Maximised Profitability Scenario (i.e. all volumes allocated to the most profitable customers) with the final annual plan (where strategic fit is also considered), it is possible to discuss the consequence of the strategic choices based on numbers and not just gut feelings. The decision of the final annual plan is an iterative process which considers market price scenarios, strategic direction and customer profitability.
In order to support this process, a profitability calculation was implemented in SAP IBP at a granular level. For each product-customer combination, a detailed price and cost breakdown was done. As a result, a simplified Profit and Loss view was available for each product-customer. Starting from a gross price, the following elements have been included in the profitability calculation:
The impact of the project was threefold:
The process owner says: “We now have sales, production and deliveries planned in the same system providing us with the needed transparency into our business.” And that is exactly what we have focused on.
After going live with the new processes and system, the process owner claimed that: “IBP is a major step in terms of data management, availability and creating reliable data-driven decisions. The tool and process we are implementing now is also giving us the possibility to develop new capabilities in the future such as working with long-term strategic plans and related decisions.”