Article
Gaining a competitive advantage by managing and governing complexity


Tool
Read more
8 December 2020
Adding too much product complexity can have devastating results, while managing complexity can become a competitive advantage. In 2003, LEGO was on the verge of bankruptcy1. It had struggled to keep up with the changes facing the toy industry in the 1990s and responded by diversifying its product portfolio. This led to increased costs, while the sales failed to grow accordingly. When a new CEO took over in 2004, a set of actions were taken to save the company and reduce soaring complexity, such as focusing on core products and reducing the number of components2. LEGO managed to turnaround its bleak economic outlook to significantly increase growth and profits3.
As the LEGO case illustrates, there is a potentially large business impact to be achieved when working with complexity reduction. It is not only for companies that are already struggling; managing and governing complexity can be beneficial for all companies. Below, we give you an introduction to the subject of product complexity management and show how managing complexity in a good way can boost both sales and margins.
Generally, complexity can be split into two types: product-related complexity and structure-related complexity. Product complexity can be e.g. the number of products, the number of components they consist of or raw materials used. Structure complexity can be the number of factories, markets, warehouses or suppliers. If poorly managed, complexity leads to increased costs and decreased customer value proposition. This article will treat the subject of product complexity.
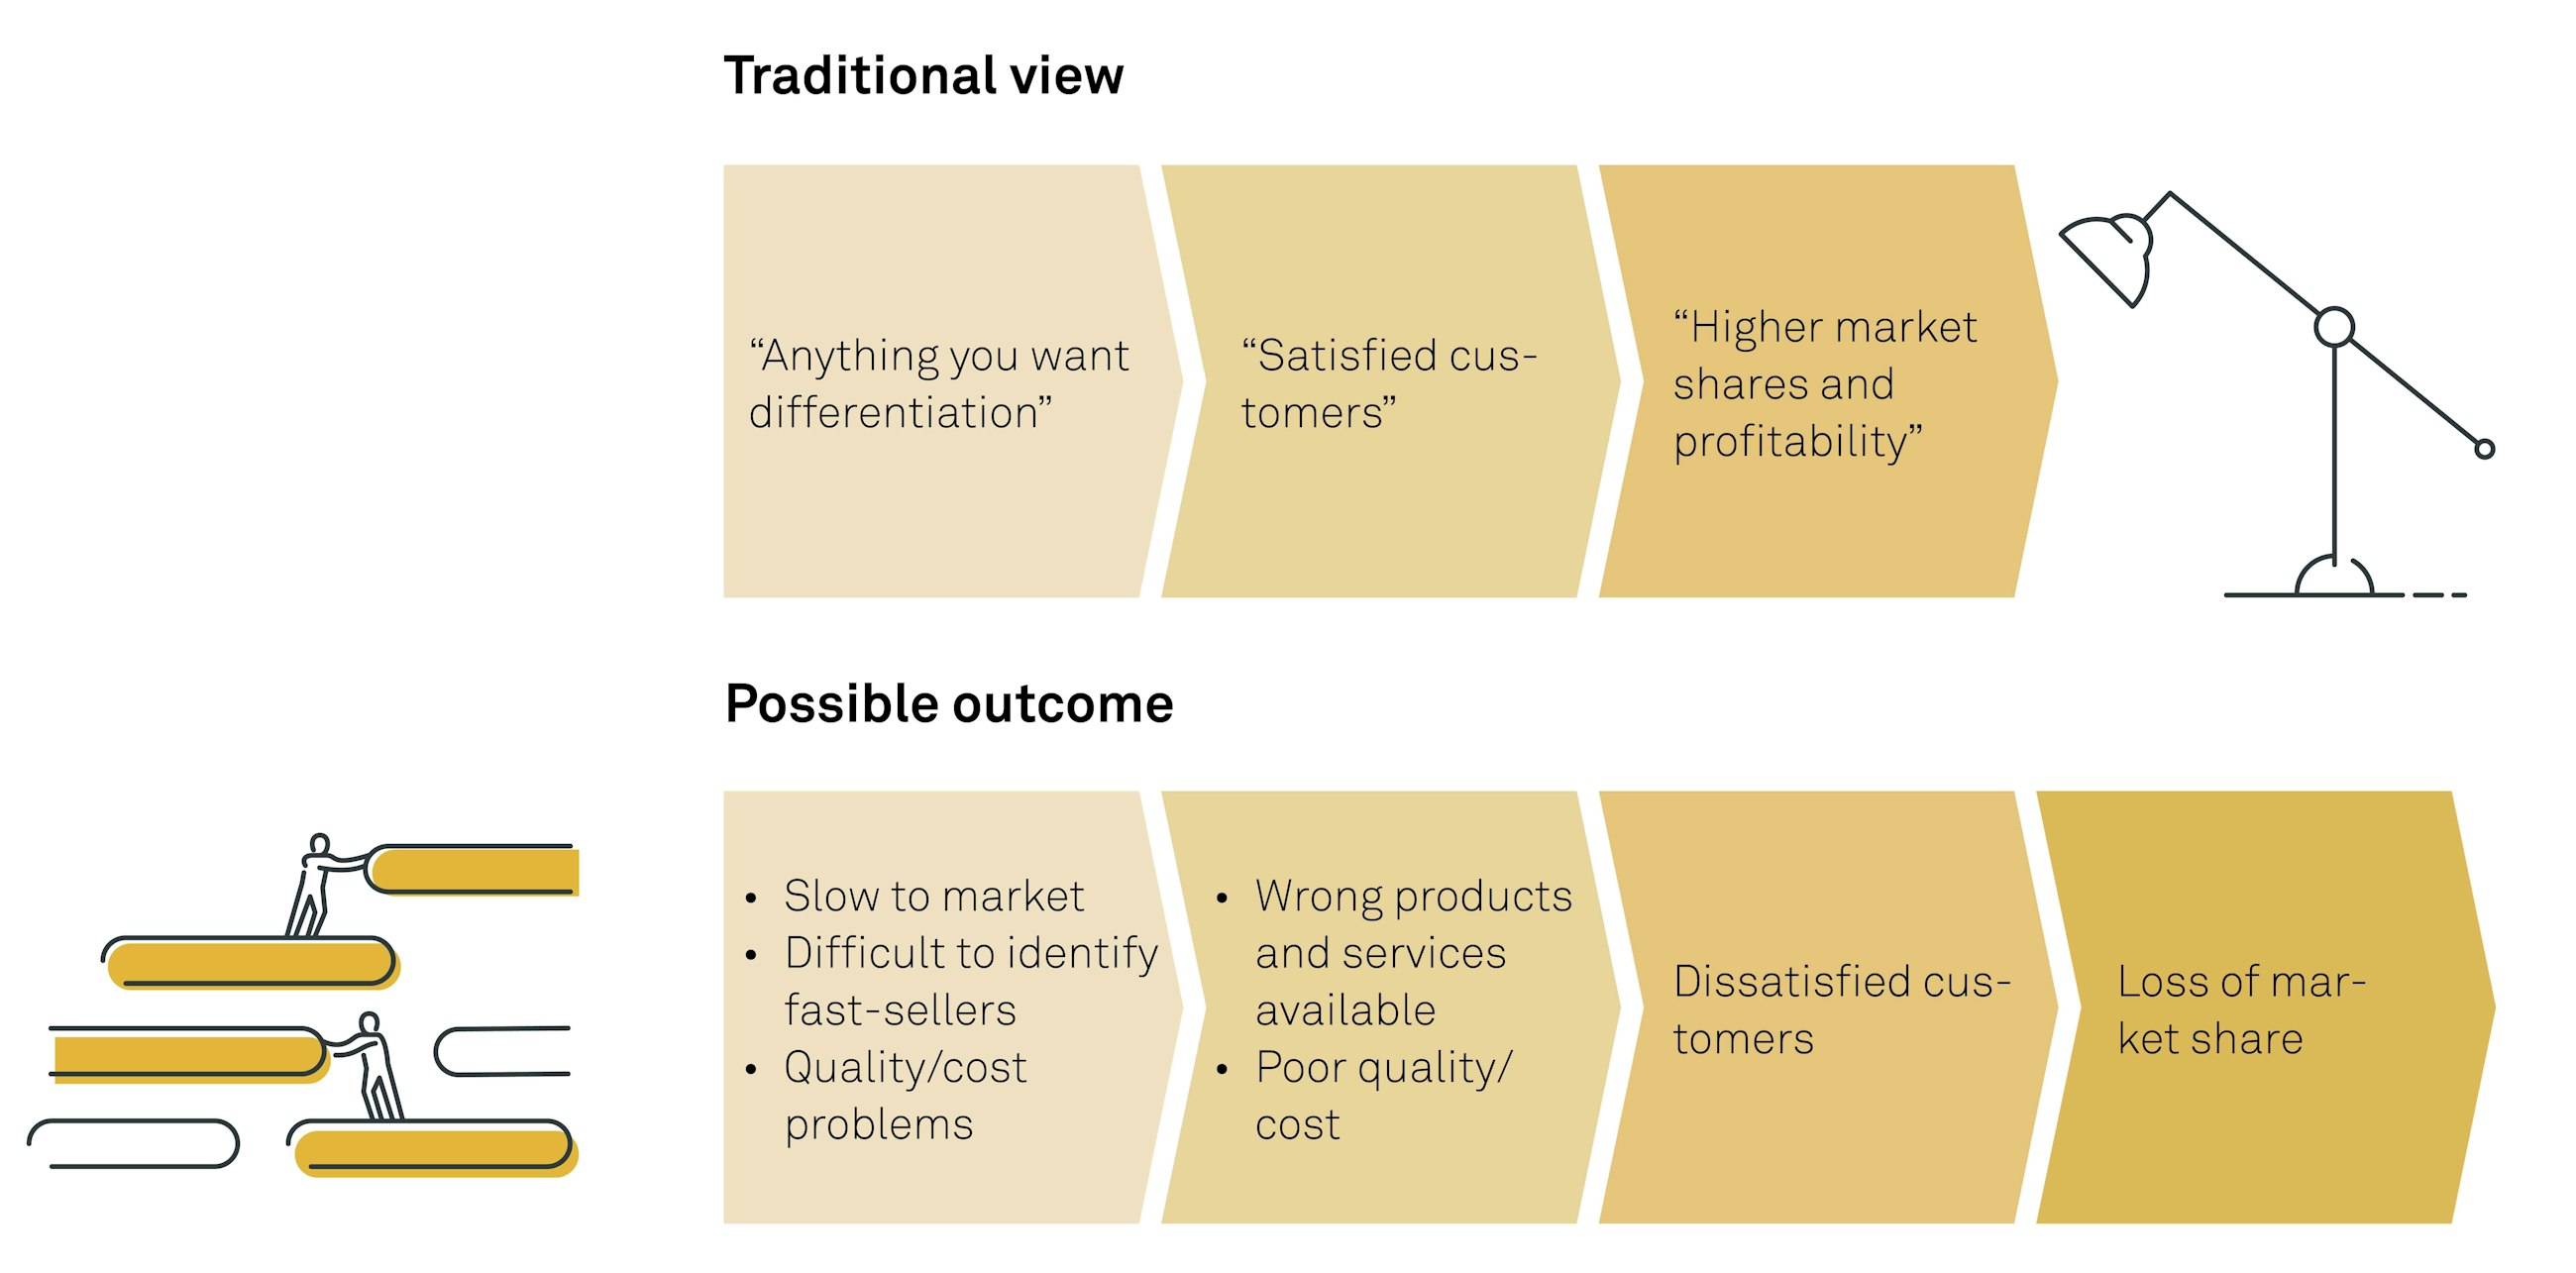
The road to product complexity is often paved with good intentions. While the traditional view might be focused on differentiating and giving the customer what they want, consumer experience orientation can inadvertently lead to increased complexity with adverse effects.
Extending and tailoring product offerings will increase sales in the short term. However, speed to market and innovation can suffer in the long run with a high and increasing complexity, impairing customer experience.
Complexity usually builds up over time. Many smaller decisions along the way can end up leading to an excessive amount of product complexity.
Below are examples of actions that add complexity:
For companies in a turnaround situation, managing complexity reduction can be an effective way to decrease cost and create value. It can be seen as part of the key lever of value creation in the Turnaround Toolkit described in previous articles about Turnaround management.
For LEGO, managing complexity was an essential part of its turnaround.
With too much complexity, the whole value chain is affected. Increases in cost and decreases in efficiency and effectiveness make their way into the different parts of the value chain, as seen below.
These are some of the effects added complexity can have. Adding product complexity in one part of the chain can have a ripple effect on the whole value chain, making it even more important to manage appropriately.
Different aspects of the business are affected differently. In the organisation, complexity can lead to loss of focus and engagement. Financially, high complexity usually comes with increased cost and working capital. For the customer, the main issue can be loss of speed to the market, slow reactions to quality issues and other slow service levels. Interestingly, during our webinar on the subject on 10 September 2020, when asked about what effects of complexity the attendees were experiencing, long lead times and increased costs were the two most common issues.
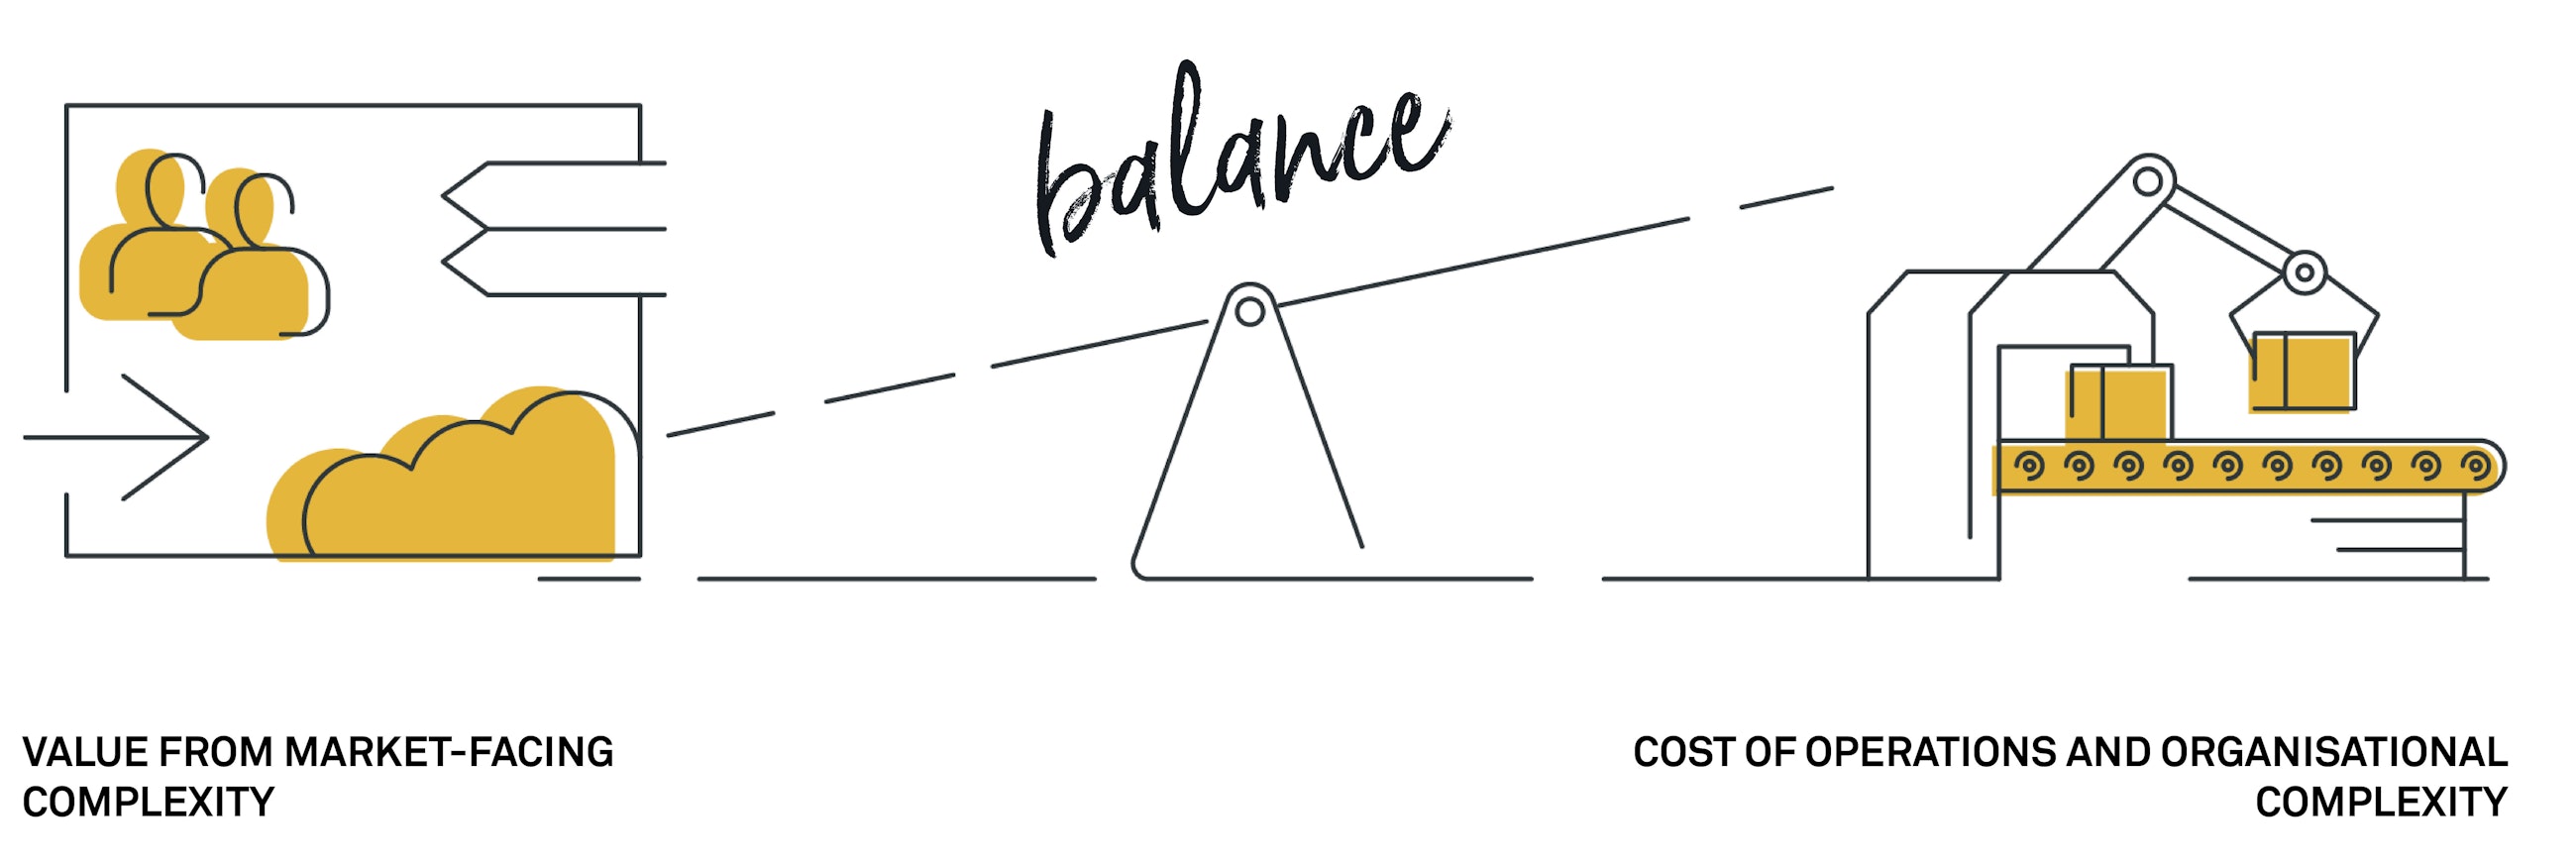
Complexity issues are what it says on the tin. They are complex, as they stem from the many decisions made in various parts of a company and affect speed to market and the whole value chain. When managing complexity, the right answer is not to always decrease complexity as much as possible but rather to find the right level of complexity. To be clear, complexity is not bad per se; it just needs to be managed in a good way.
Sometimes, a little more complexity can be a good thing. For example, despite what Ford used to say back in the day, the modern-day customers would probably not be satisfied with a black Ford Model T and no other options. The key to managing complexity lies in reducing the cost of necessary complexity while simultaneously reducing the level of unnecessary complexity.
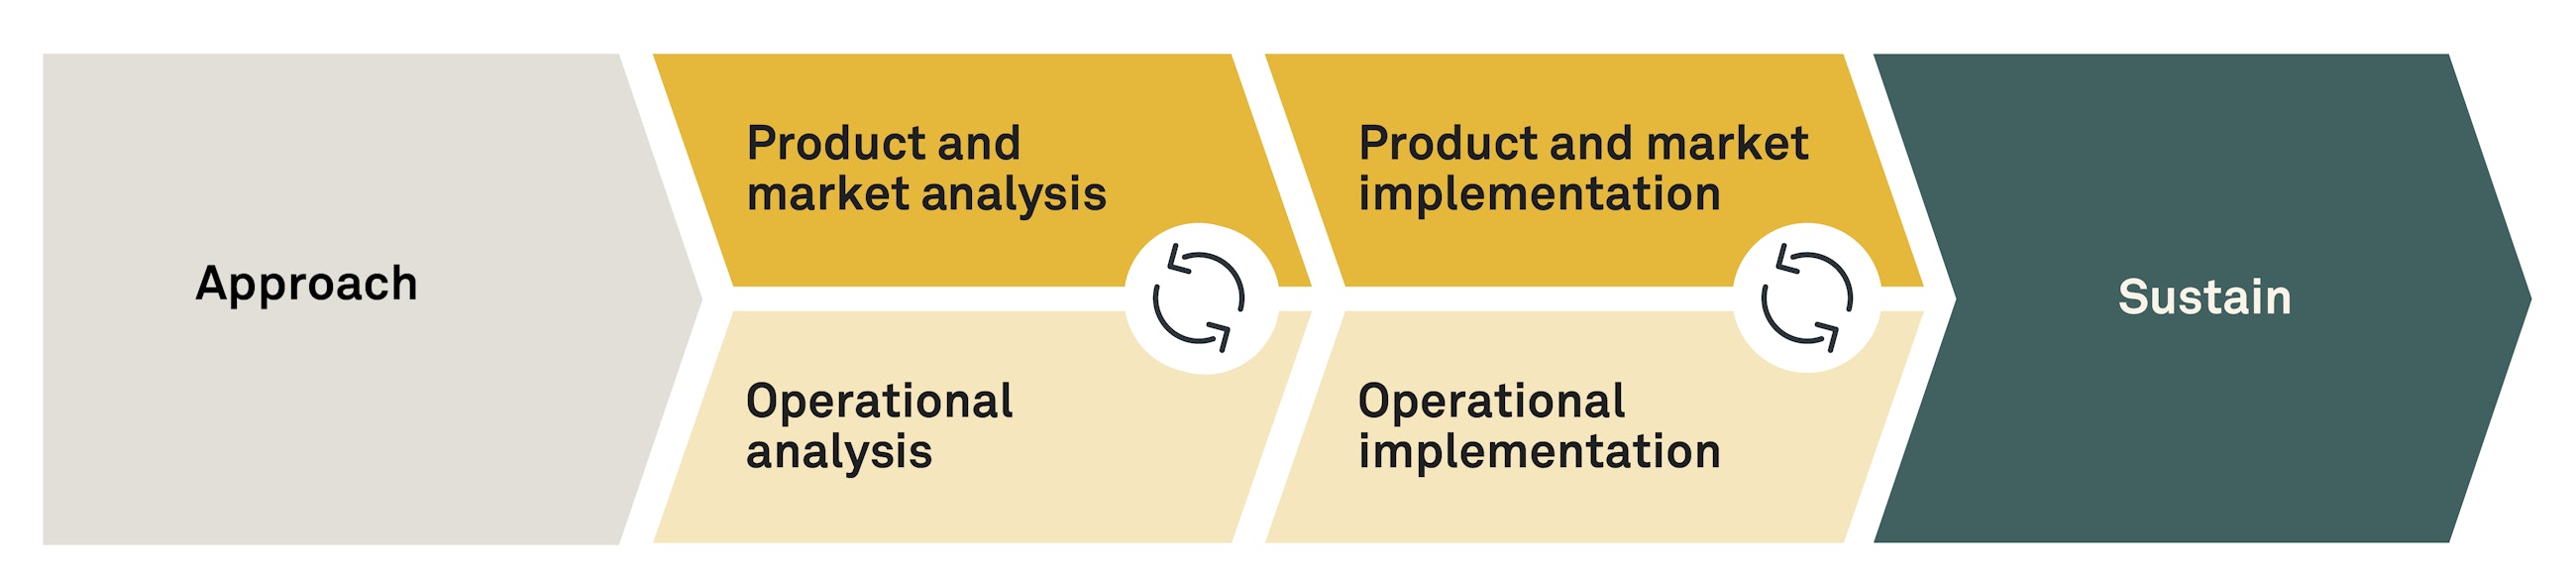
To get the full impact of a complexity reduction initiative, you need to work with the market-facing and the operational perspectives in parallel and iteratively in waves. Complexity reduction is a cross-functional exercise that requires the involvement from both the commercial and operational side to be successful.
Working in parallel ensures that as many operational structural cost elements as possible can be removed while keeping competitiveness.
When complexity has been reduced, it is necessary to sustain the change by establishing governance and measures to make sure complexity is stopped from creeping back in.
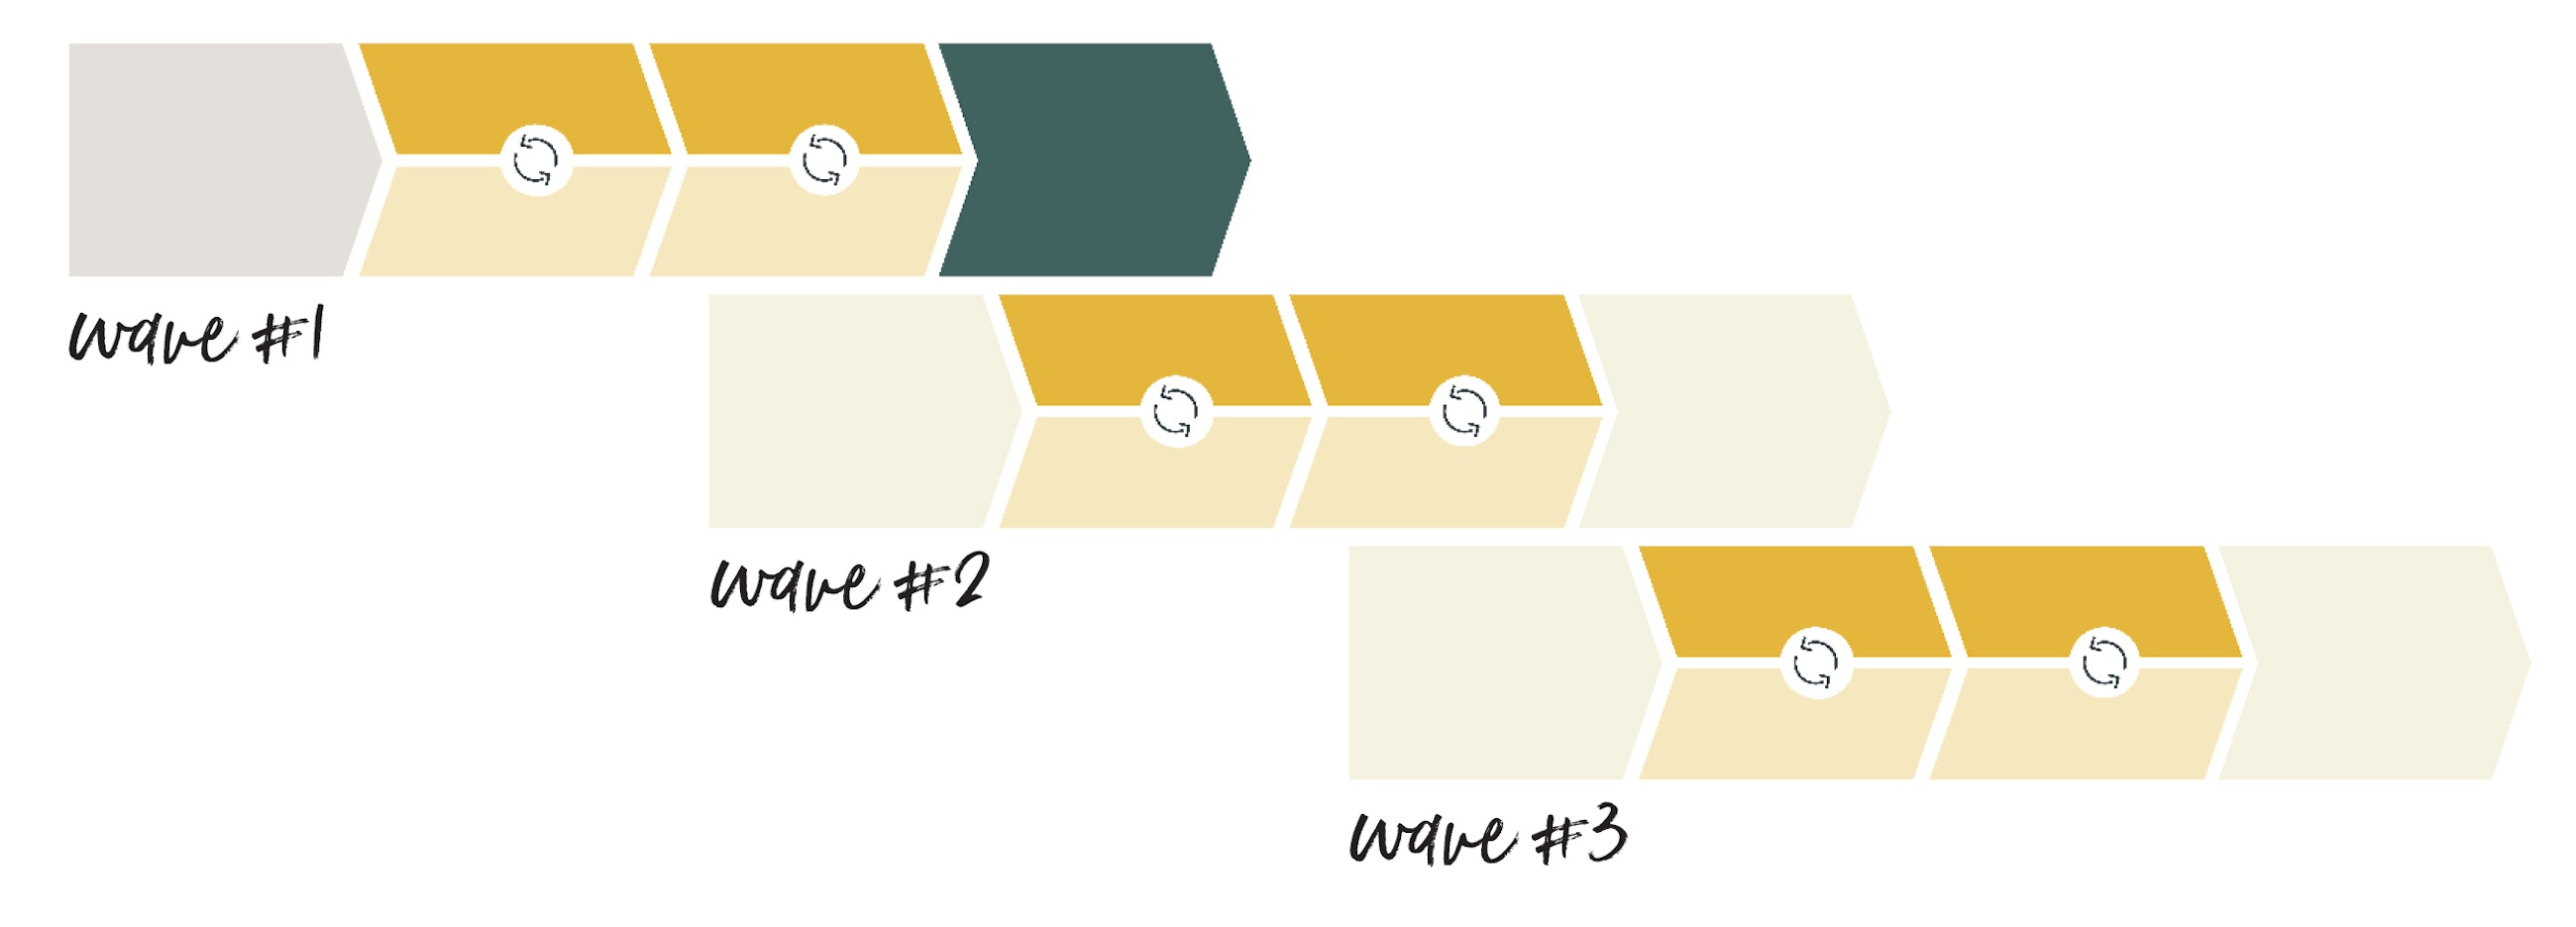
Complexity is best taken out in chunks and not in small increments. It is important to work at scale. However, it cannot be done all at once, so an approach where it is done in waves is recommended.
Each wave enables more structural cost to be removed as thresholds are met. Some examples of actions that can be taken to structural cost when thresholds are met include: reduce the size of a warehouse, consolidate two production lines, remove one supplier, stop using one type of raw material and discontinue one transport lane.
When working with complexity reduction, there are certain tools and techniques to be used for the two perspectives. First, for the outside-in product and market view, the aim is to optimise the product portfolio based on market demands and opportunities within operations.
Examples of possible actions to take with this perspective in mind include:
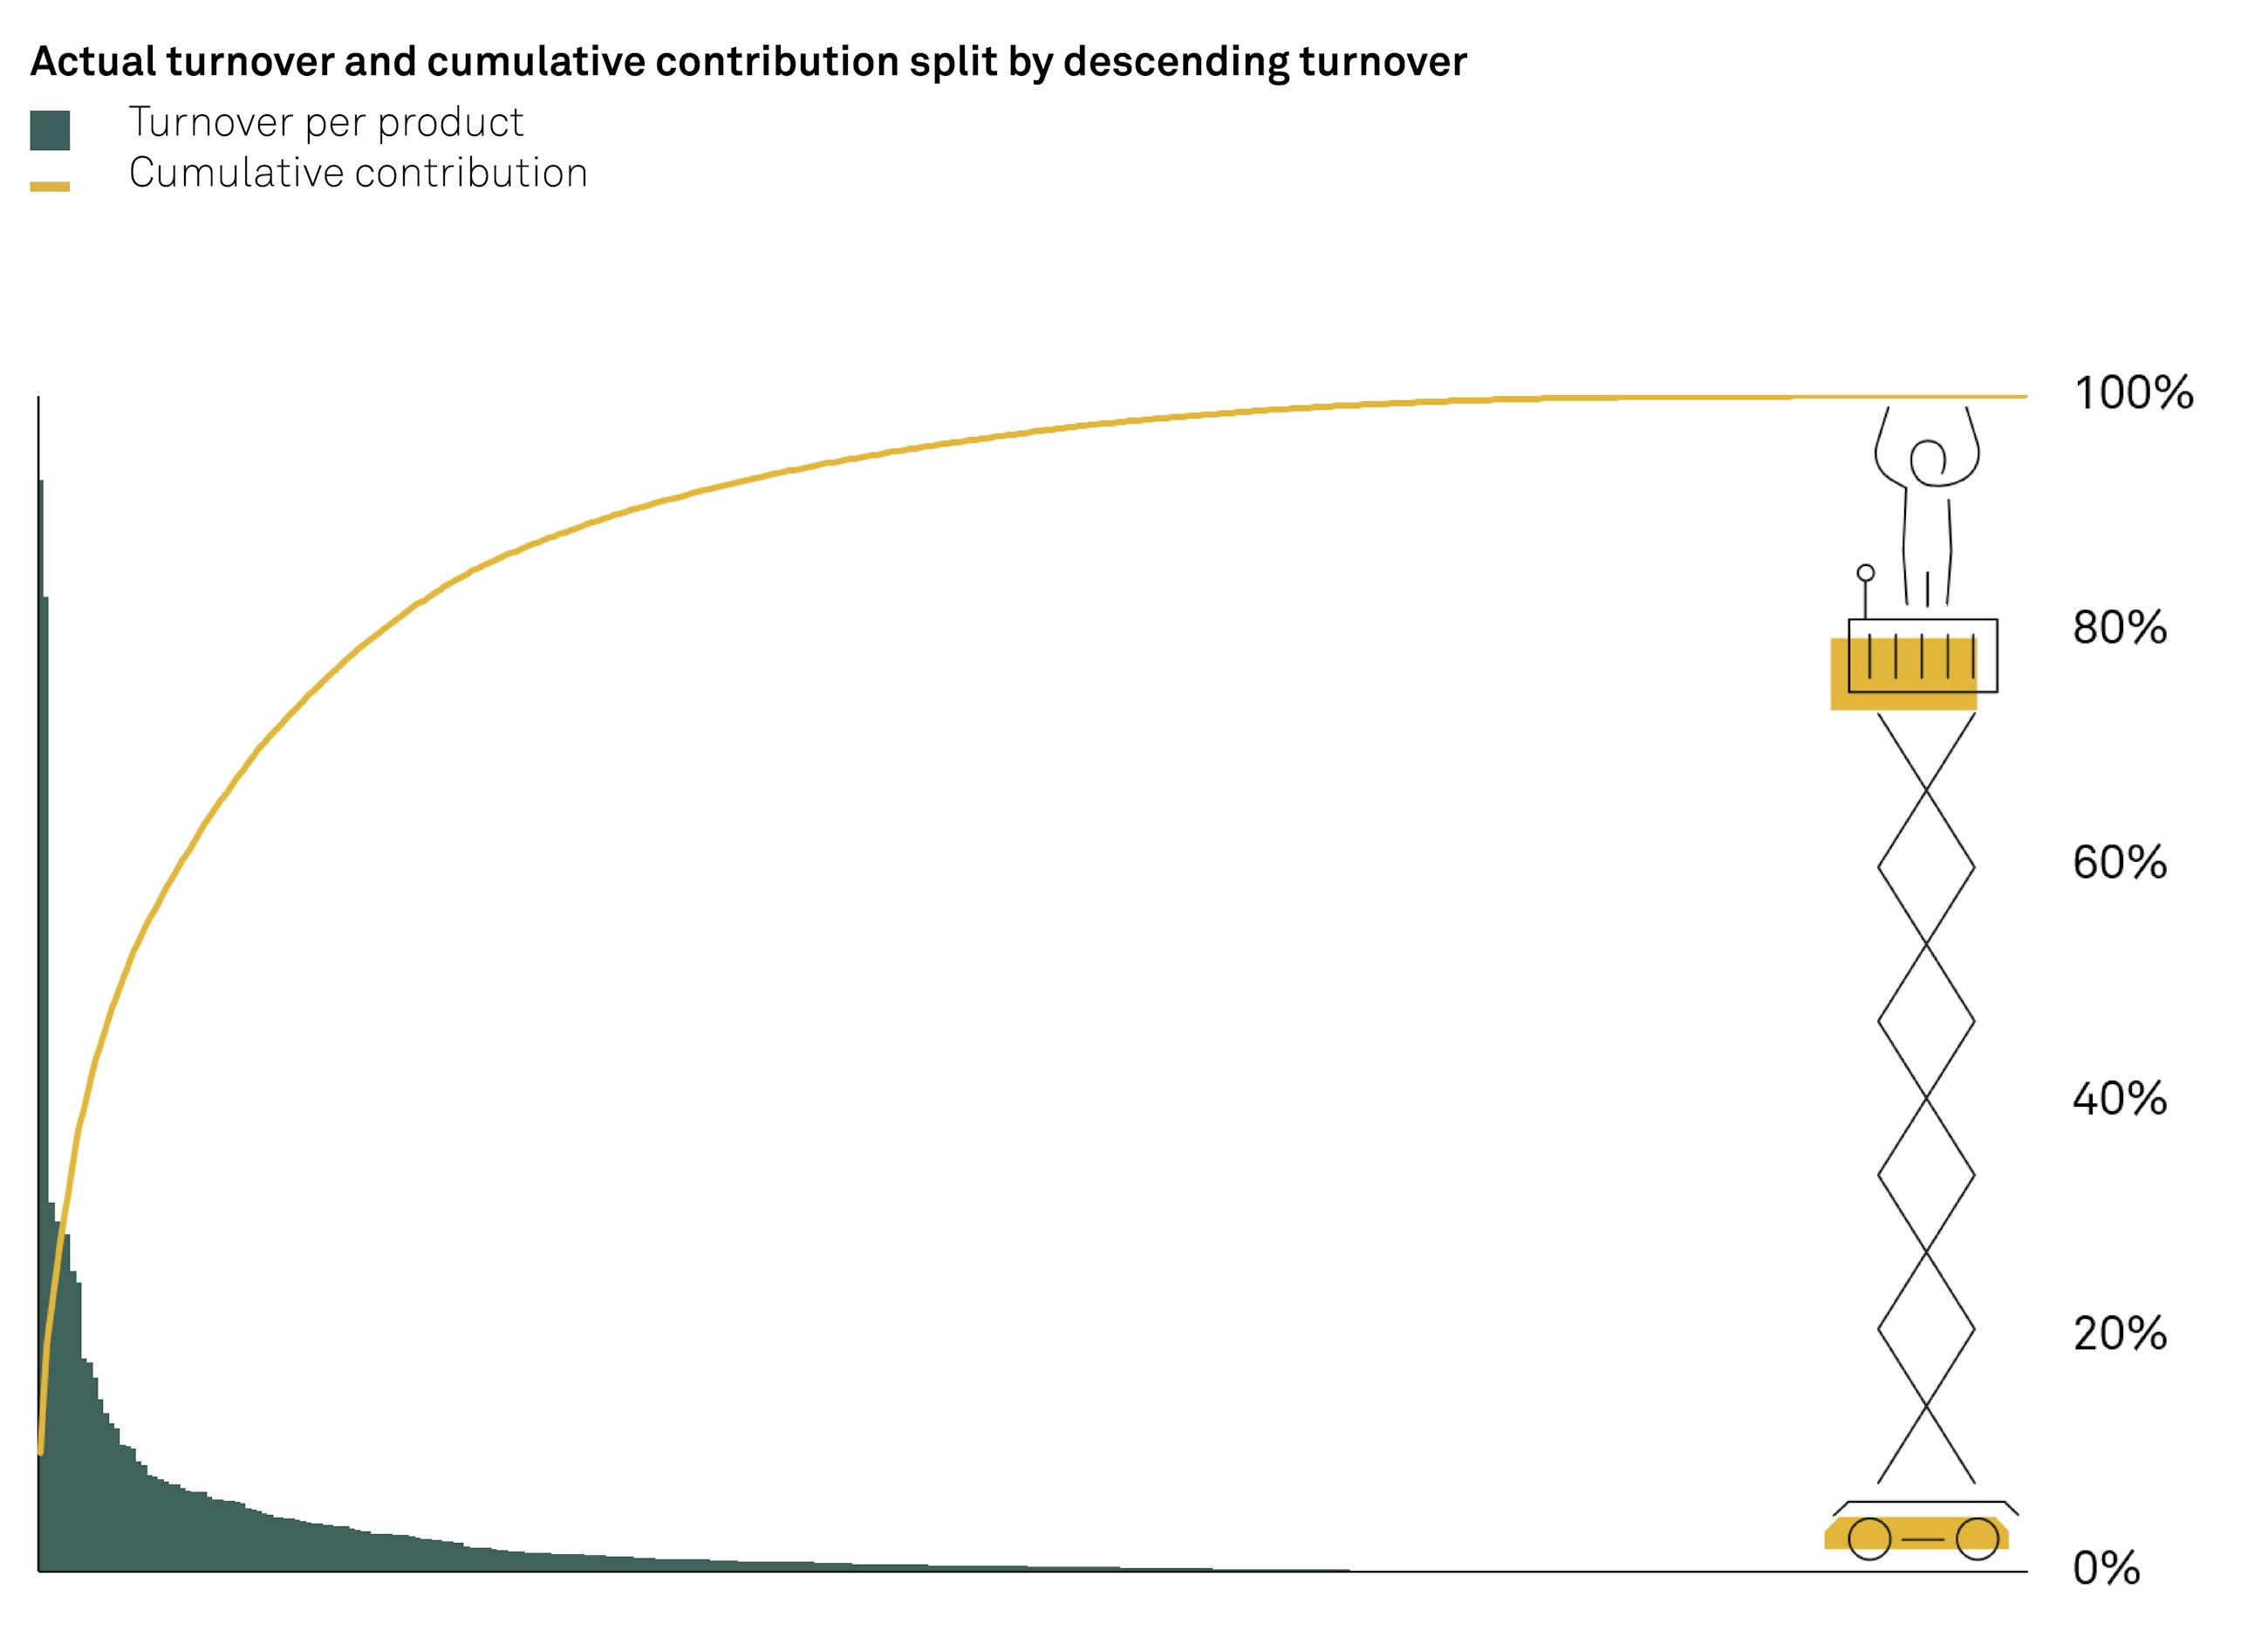
A specific tool and analysis to be done from this perspective is the tail analysis, which reveals the tail products that can be pruned. Through mapping the turnover per product, it becomes visible which products are strong in their value and contributions to sales and which products are weak in this regard. The analysis can assist in building a data-supported foundation to understand which products might add more cost in terms of complexity than they add value in terms of turnover.
Second, the other perspective is the inside-out operational view reducing complexity with operational measures and optimising operations based on suggested new technology modules and product portfolios.
Examples of some actions to take include:
By working with the two perspectives in parallel, complexity can be removed for real, and the benefits can be captured. Benefits include reduced cost and working capital across the whole value chain, increased speed and agility in the market, improved customer satisfaction and increased focus and engagement within the organisation. Now, let us turn to two case examples showing how effective in general this approach can be in practice –the tail-curve analysis in particular.
Case A: An Industrial product supplier managed to cut most of its non-profit-making products while only experiencing a marginal revenue loss and overall profit lift. Here is how it was done. A full review of the business line, approximately 3,000 products, was performed. When doing a tail-curve analysis, it was revealed that 25% of products were actually loss making. Together with regional sales teams, the product management team reviewed this list and decided which products were going to be removed, replaced/merged with similar product, repriced, kept as part of bundled sale or kept in the cases where a new product introduction was expected to increase sales and profits. In the end, 80% of the tail products were discontinued, and the company saw reduced complexity in operations and an increase in profit. A way of measuring cost of complexity per product was implemented to ensure sustainable change.
Case B: Another company used product complexity management as part of a turnaround effort. The industrial plastic component supplier was unprofitable. A tail-curve analysis showed that their low volume components were even more unprofitable than previously known, whereas high volume components were highly profitable. The reason why the low volume components were so low in profitability was that their cost structure and pricing were not aligned. In fact, the fixed cost per unit was a lot higher than the variable cost per unit; however, the pricing was based on a variable cost-plus model. The factory was split into two parts, one for profitable high-volume products and one for unprofitable low-volume products, to increase visibility of performance. Focus of the low-volume parts was to improve component contribution. This was done through adjusting/increasing batch sizes to achieve economies of scale in relation to fixed costs, improving machine set-up time, repricing, swapping/phasing out components and adjusting maintenance and operational schedules to be more appropriate for the low-volume type of production runs. In the end, the company achieved a turnaround in overall profitability.
As shown in these two cases, a tail-curve analysis can be a powerful tool.
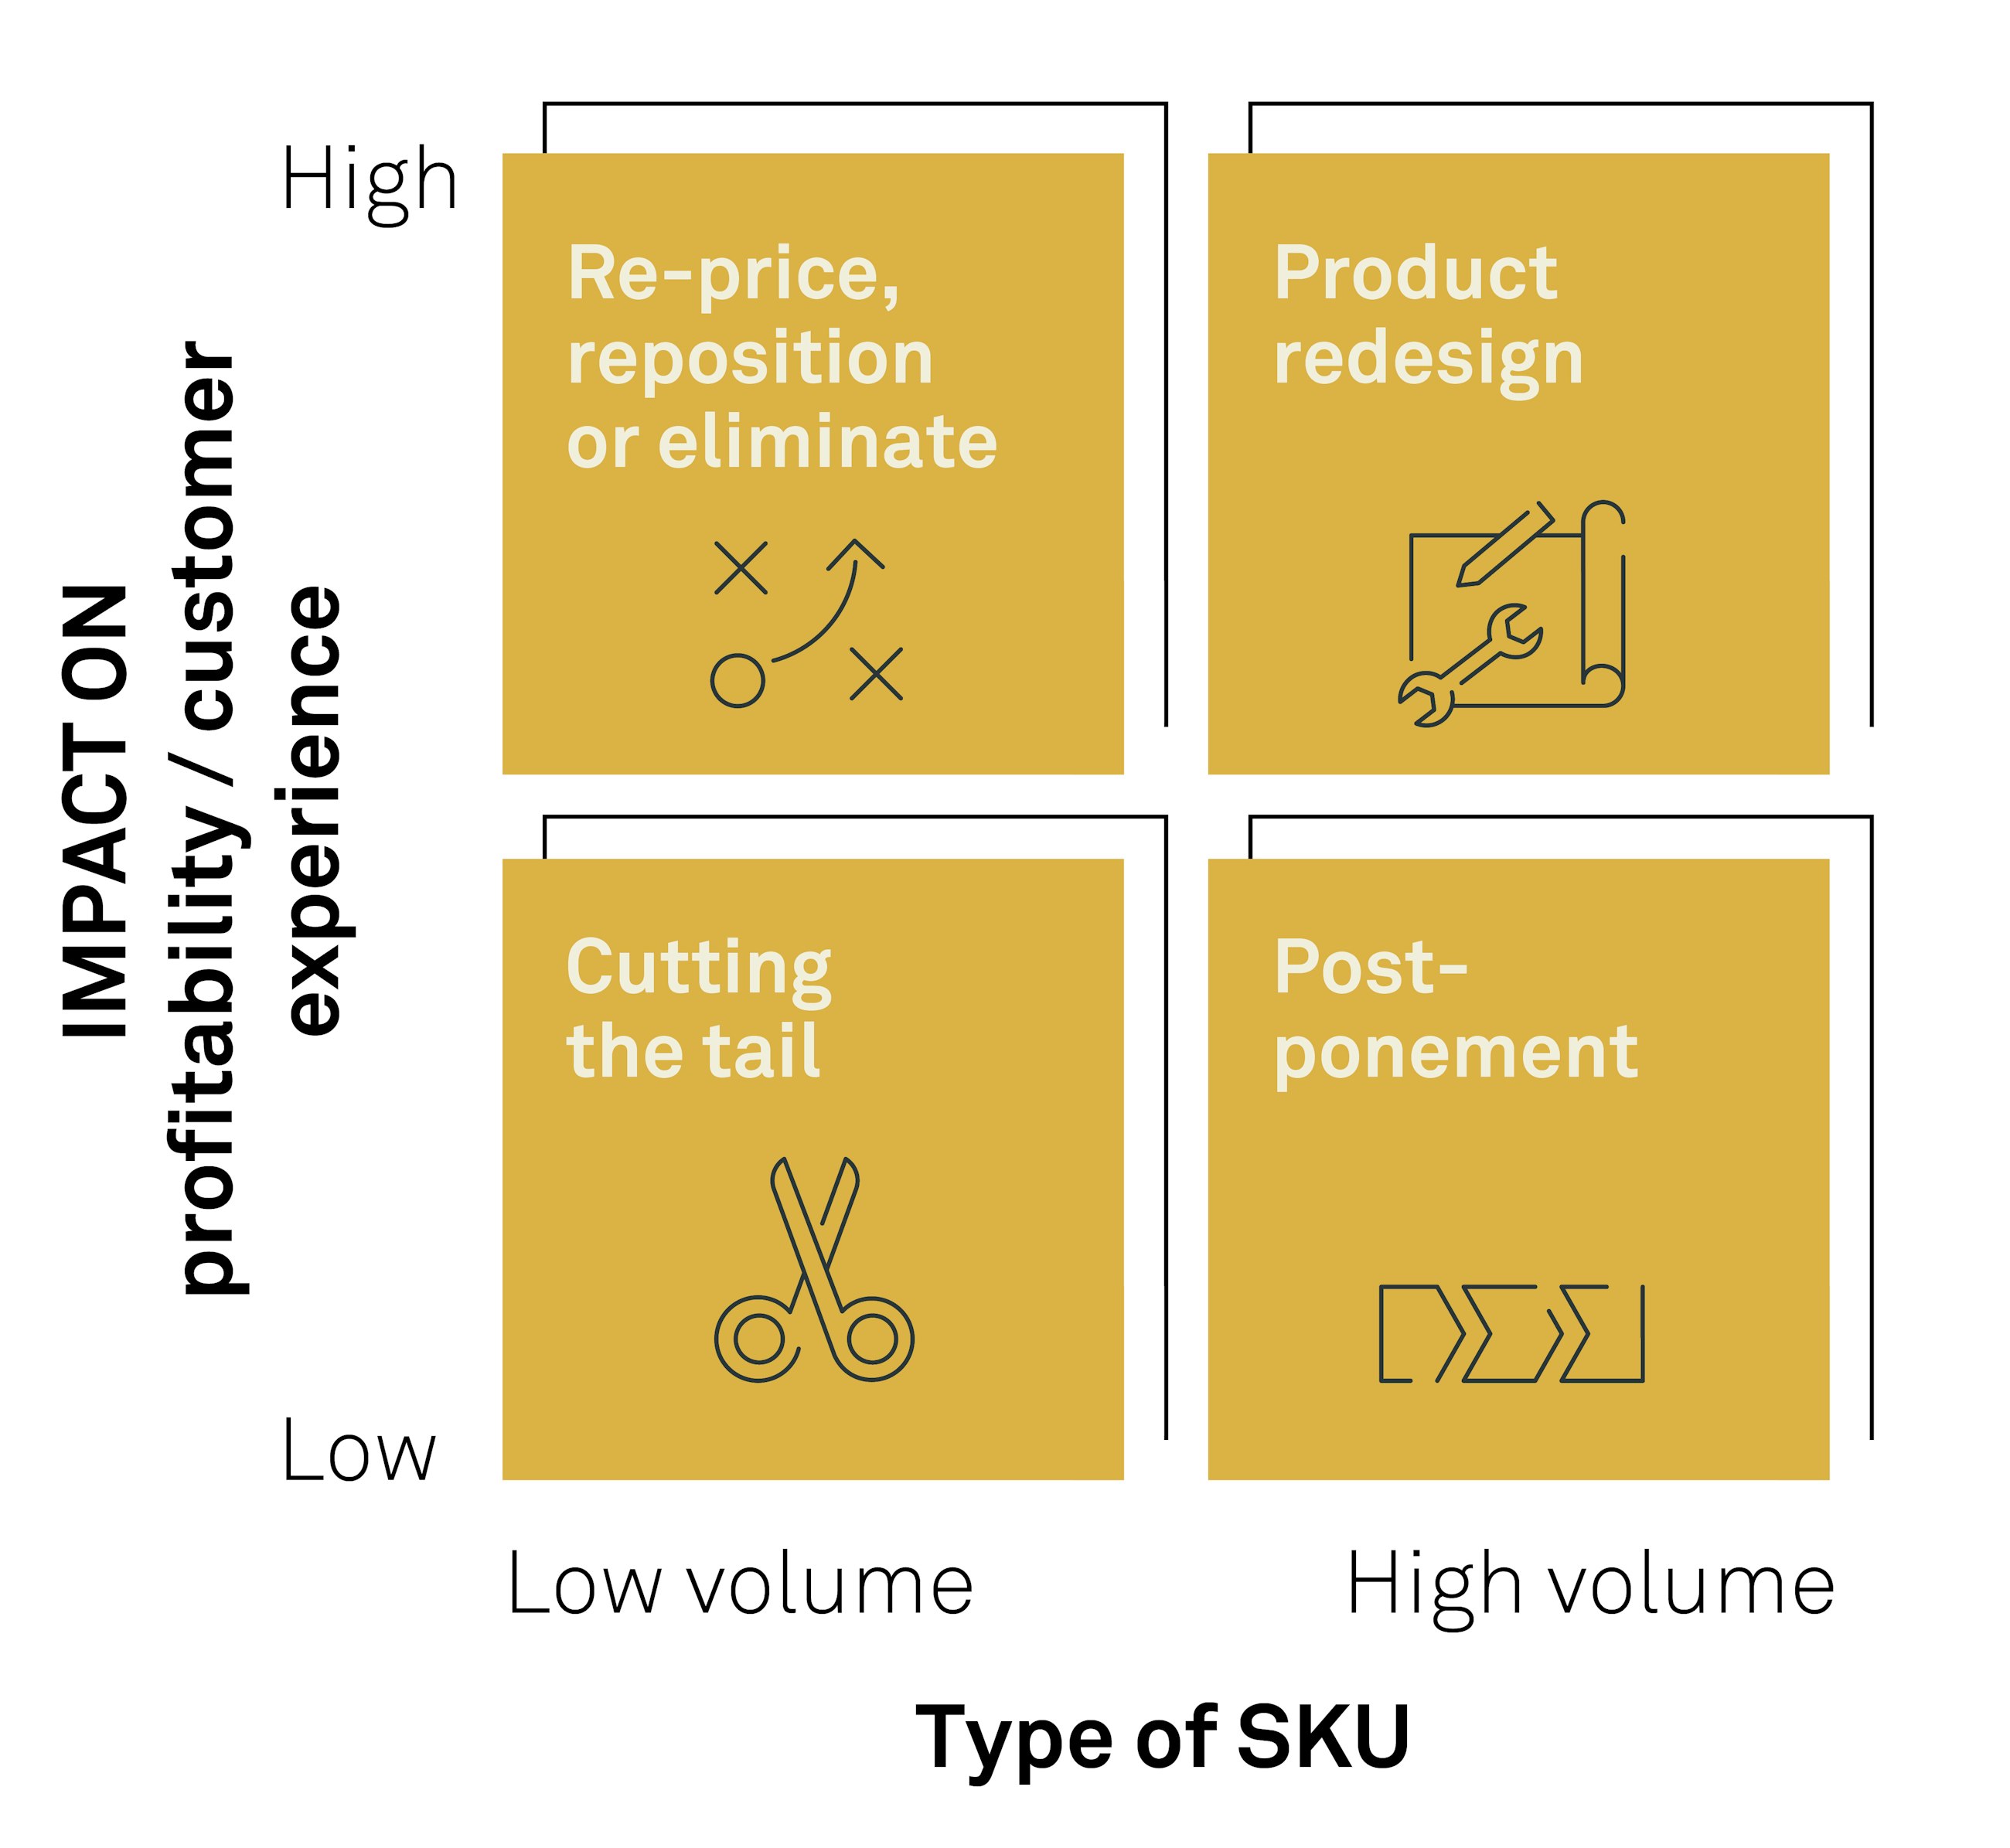
Another tool can be found below. The model illustrates how impact on profitability/customer experience and type of SKU gives an indication of how different SKUs can be managed to reap complexity reduction benefits in a resource-efficient way.
For SKUs with low volumes, elimination should be considered in conjunction with impact on profitability/customer experience, but in cases where impact is high, repricing or repositioning options should also be taken into account. For low-impact SKUs, a cut-the-tail exercise will reduce complexity rapidly and with minimal impact on profitability/customer experience.
For high-volume SKUs, the recommended actions are slightly more extensive.
If SKU impact on profitability/customer experience is low, postponement of customisation to as late as possible in the value chain is advised. This will enable the same number of variants in the end point but still reduce component complexity earlier in the value chain. The reason these components should be kept in focus is that the SKU volumes are high, and their accumulated impact on profitability/customer experience is thus significant.
For SKUs with high volumes and high impact, redesigning products to enable increased modularisation and reusage is the most effective way to reduce complexity. Whilst requiring some initial investment, redesigned products using common components and harmonised platforms will be the most effective way to enable and sustain a lower level of complexity. As an example, the Tesla Model Y shares 75% of its components with the Model 34.
Strategies for different SKUs based on volume and impact as showcased above can be part of effective product complexity management.
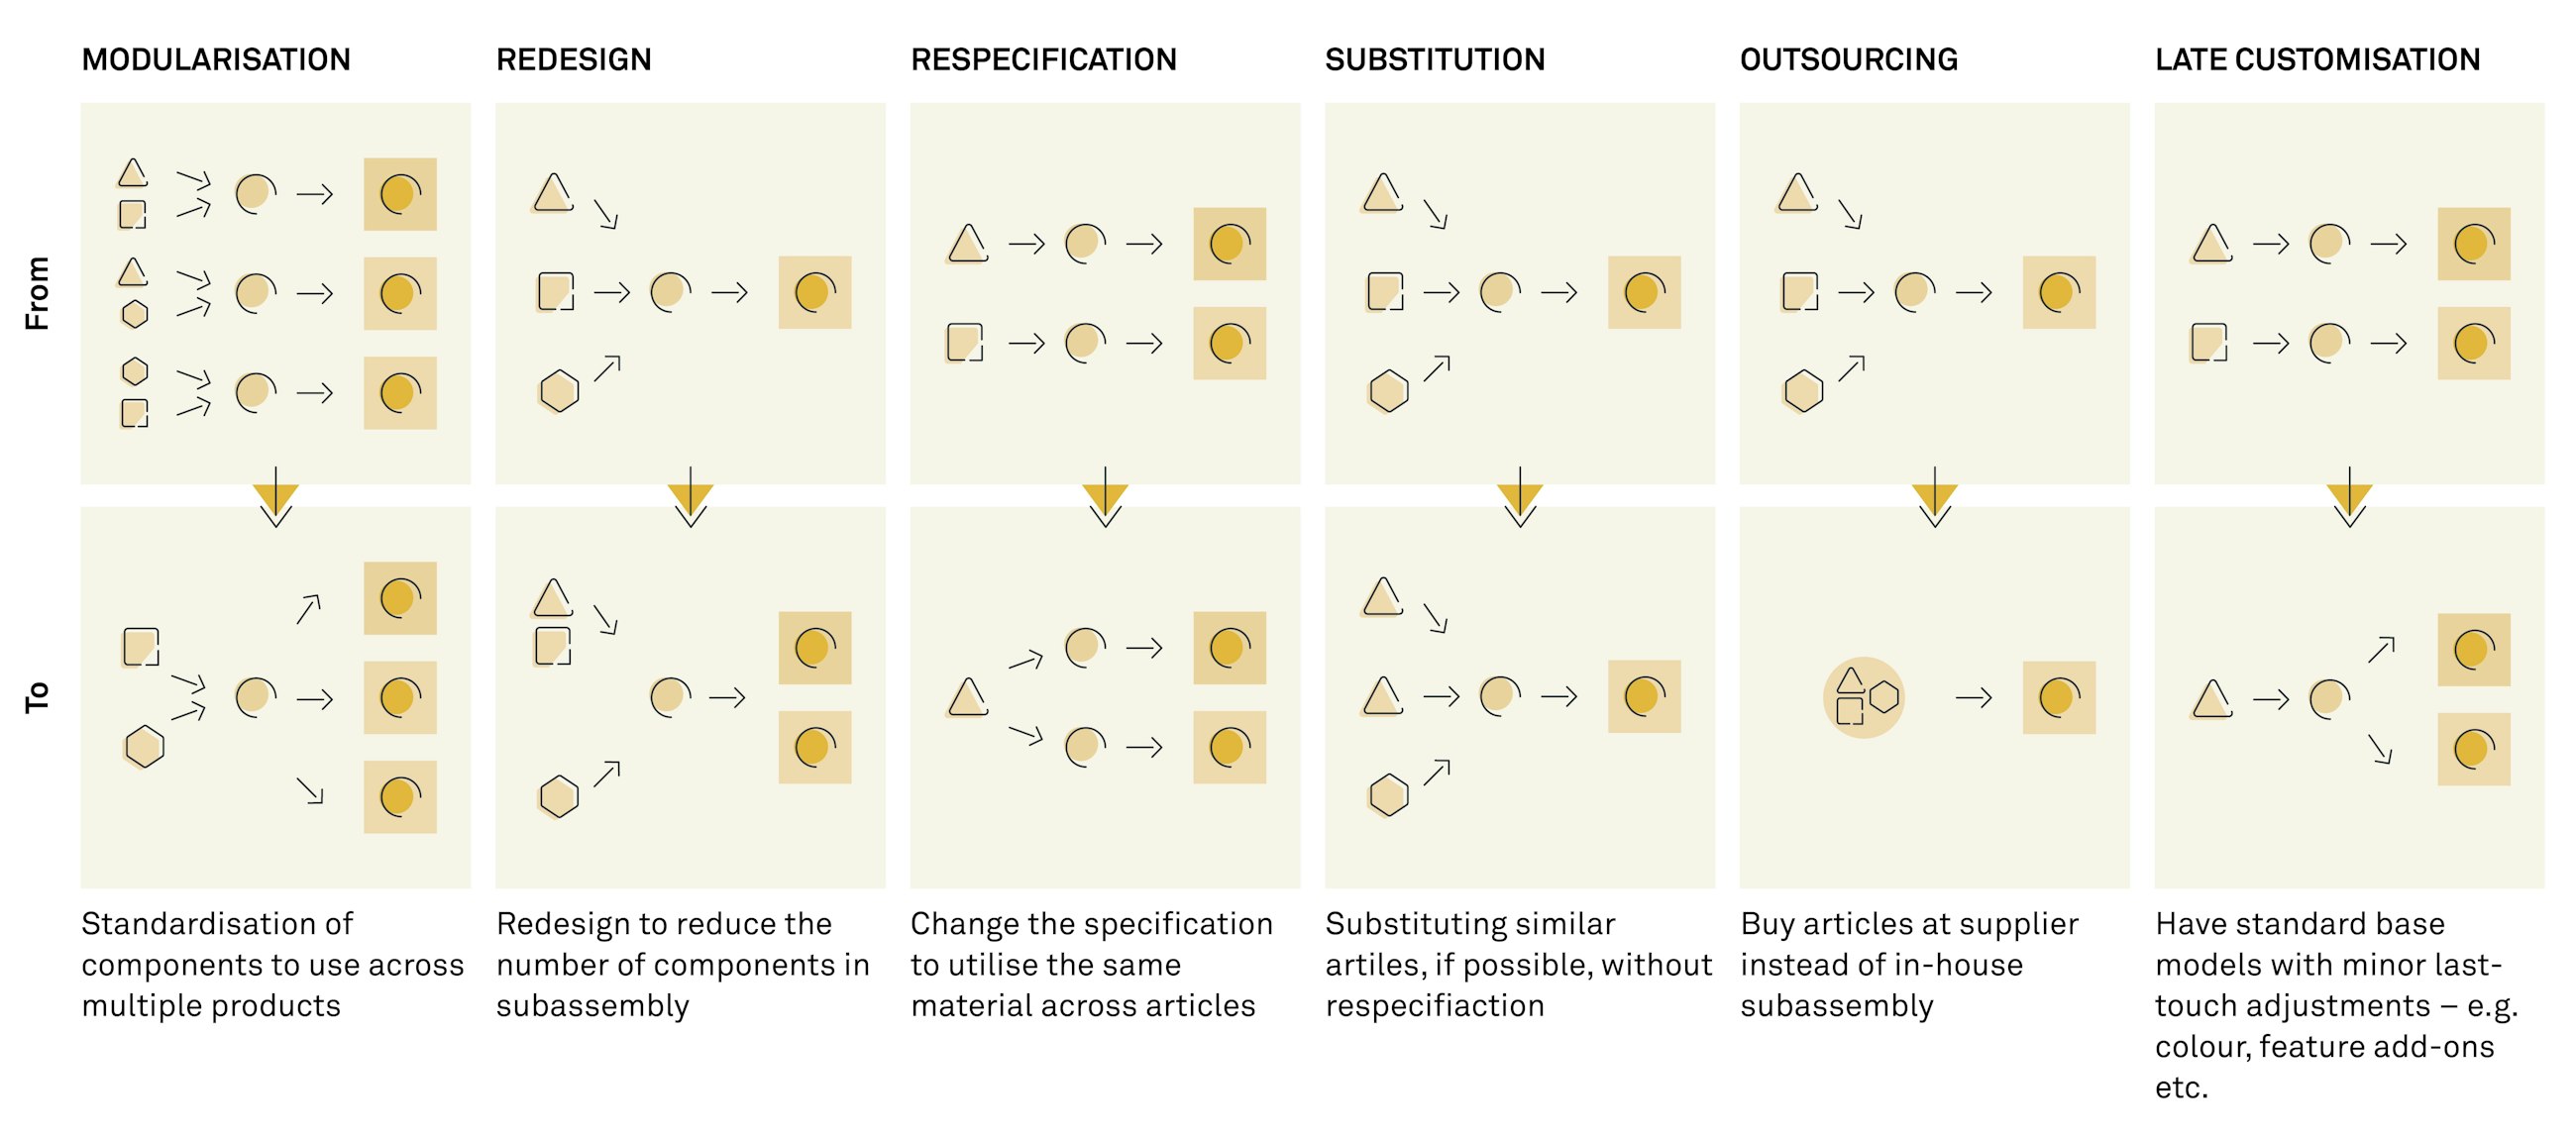
To harmonise platforms and reduce component complexity, several levers are possible to use. The picture below shows a variety of different approaches to do so.
A case example from an industrial goods company shows how modularisation can be used. By reducing the variation of technology modules by 75% through phasing out old modules and increasing reuse, the company was able to reduce the cost of the specific technology by 20%.
Dealing with complexity issues in a company can seem like a daunting task at first, especially if the issues are serious. However, the reward can be great. Besides using tools and techniques like the ones described above, there are a few success factors that summarise the key learnings from this article. In our experience, these factors will increase your chances of achieving the desired outcome.
By managing product complexity, real competitive advantages can be achieved, as shown by the cases in this article.
There are ways to approach the issue of complexity and effective tools to use. Reach out to learn more about how we can help you along on the journey towards effective product complexity management.
1 Wharton University of Pennsylvania. Innovation Almost Bankrupted LEGO – Until It Rebuilt with a Better Blueprint: https://knowledge.wharton.upenn.edu/article/innovation-almost-bankrupted-lego-until-it-rebuilt-with-a-better-blueprint/
2 Starvish, M. (2013). HSB Cases: LEGO: https://hbswk.hbs.edu/item/hbs-cases-lego
3 Wharton University of Pennsylvania. Innovation Almost Bankrupted LEGO – Until It Rebuilt with a Better Blueprint: https://knowledge.wharton.upenn.edu/article/innovation-almost-bankrupted-lego-until-it-rebuilt-with-a-better-blueprint/
4 Tesla Model Y: It's Bigger, Which Means Better To Many People: https://insideevs.com/news/376139/tesla-model-y-bigger-better-profitable/