Article
Five selected features of the 1908 upgrade of SAP IBP

Published
30 August 2019
In August 2019, SAP released the 1908 upgrade of SAP Integrated Business Planning (IBP). We have compiled a staff-picked list of five features of the IBP 1908 upgrade that we think your company can benefit from and that can leverage your supply chain planning to the next level.
Five selected features of the 1908 upgrade of SAP IBP
1. Seamless collaboration with your business partners via Web-Based Planning
Supply chain collaboration can deliver substantial advantages to its partners, and these benefits are expected to increase as sharing information becomes easier and more efficient. With this release, you can seamlessly collaborate with your business partners directly in Fiori, the web-browser interface of IBP.
When you collaborate, it will happen in the Web-Based Planning app, the web front-end introduced with the 1902 release, which allows viewing and adjusting planning data from Fiori without the need to log into Excel. Your business partners will be able to access the Web-Based Planning app and view the planning views that are relevant for your collaboration. Here they will be able to see planning data and to provide their inputs into the key figures for which they have an editing permission.
You can use this functionality, for example, to capture the expected forecast from your customers as well as the expected deliveries from your suppliers. All you need to do is creating a user for your business partner and use one of the newly available business role templates. You also need relevant permission filters to restrict what the business partners can see/edit. This new feature not only allows you and your partners to work on the same data simultaneously, but also allows you to use the exact same user interface, which makes it easier to discuss the data.
Furthermore, we believe that this functionality is not only relevant for inter-company collaborations, but also for internal collaboration. For example, non-key users who need to log into IBP only sporadically and provide inputs on an ad hoc basis could benefit from using this functionality. Furthermore, this could be an easy way to get and share inputs for those companies’ setups with subsidiaries where a full-fledged implementation might not be necessary.
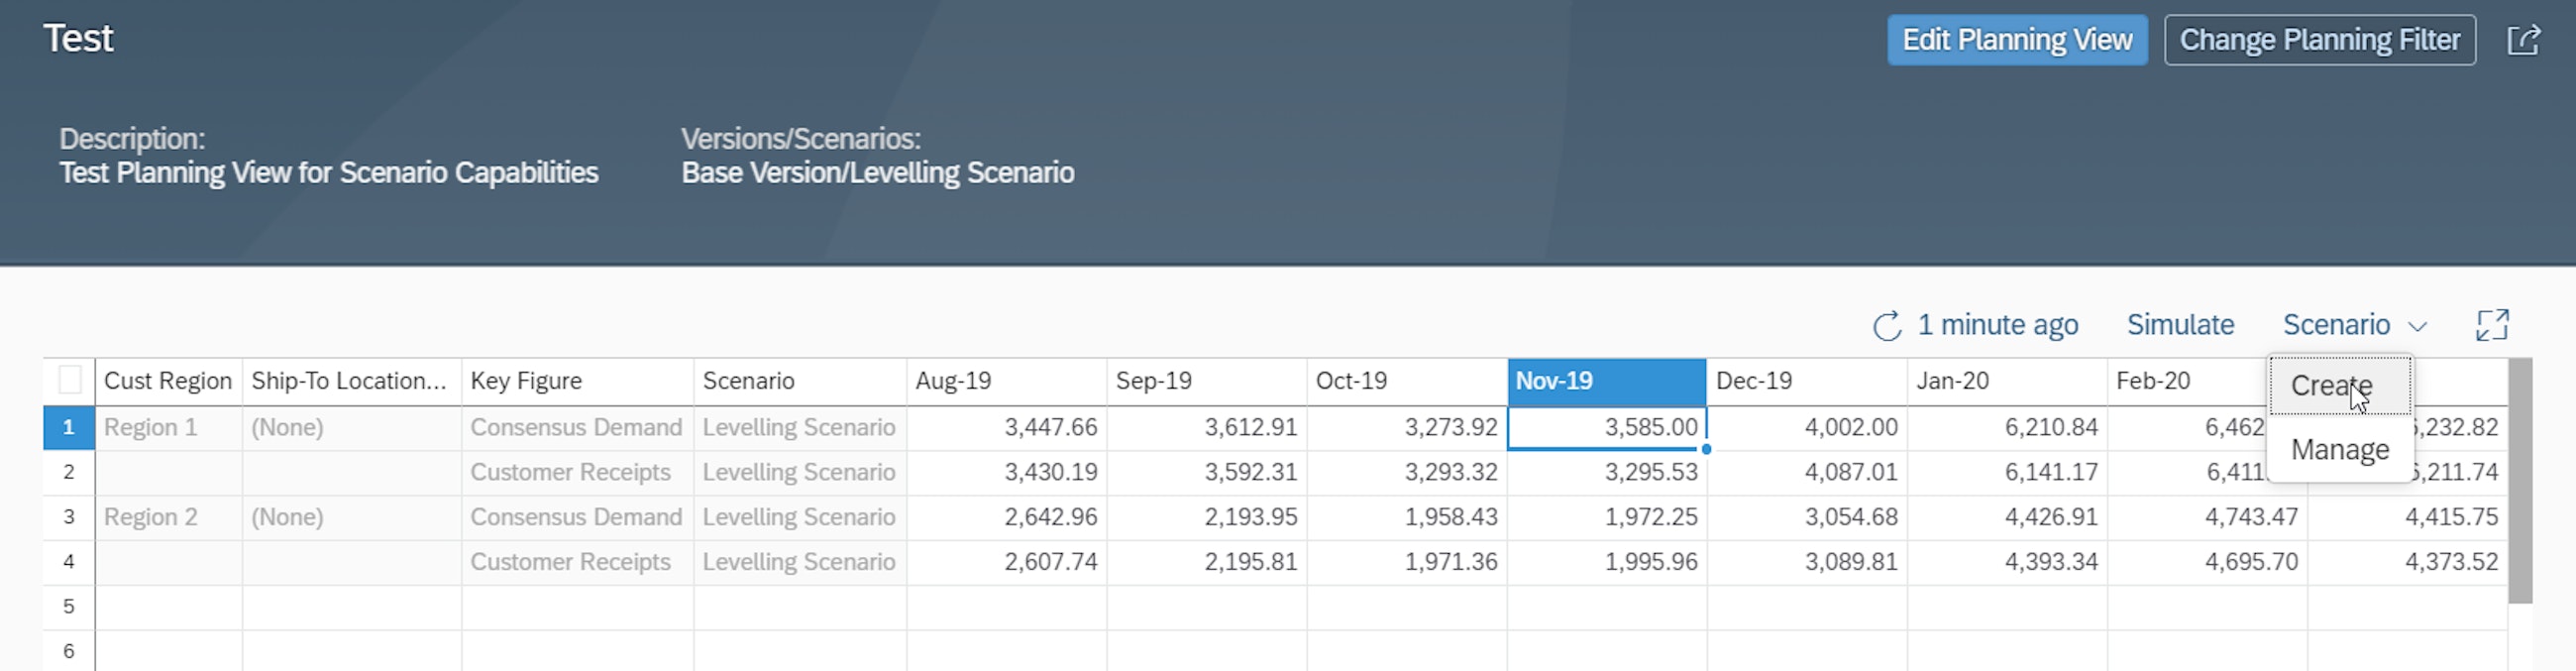
On a more general note, the Web-Based Planning app has gained a number of new features, including column filtering and displaying of fixed values, which definitely improves its usability. The most significant one is the possibility to run simulations and to work with scenarios. Before the 1908 upgrade, only Versions were supported by the Web-Based Planning app.
2. Enhanced navigation of the Supply Chain Network chart
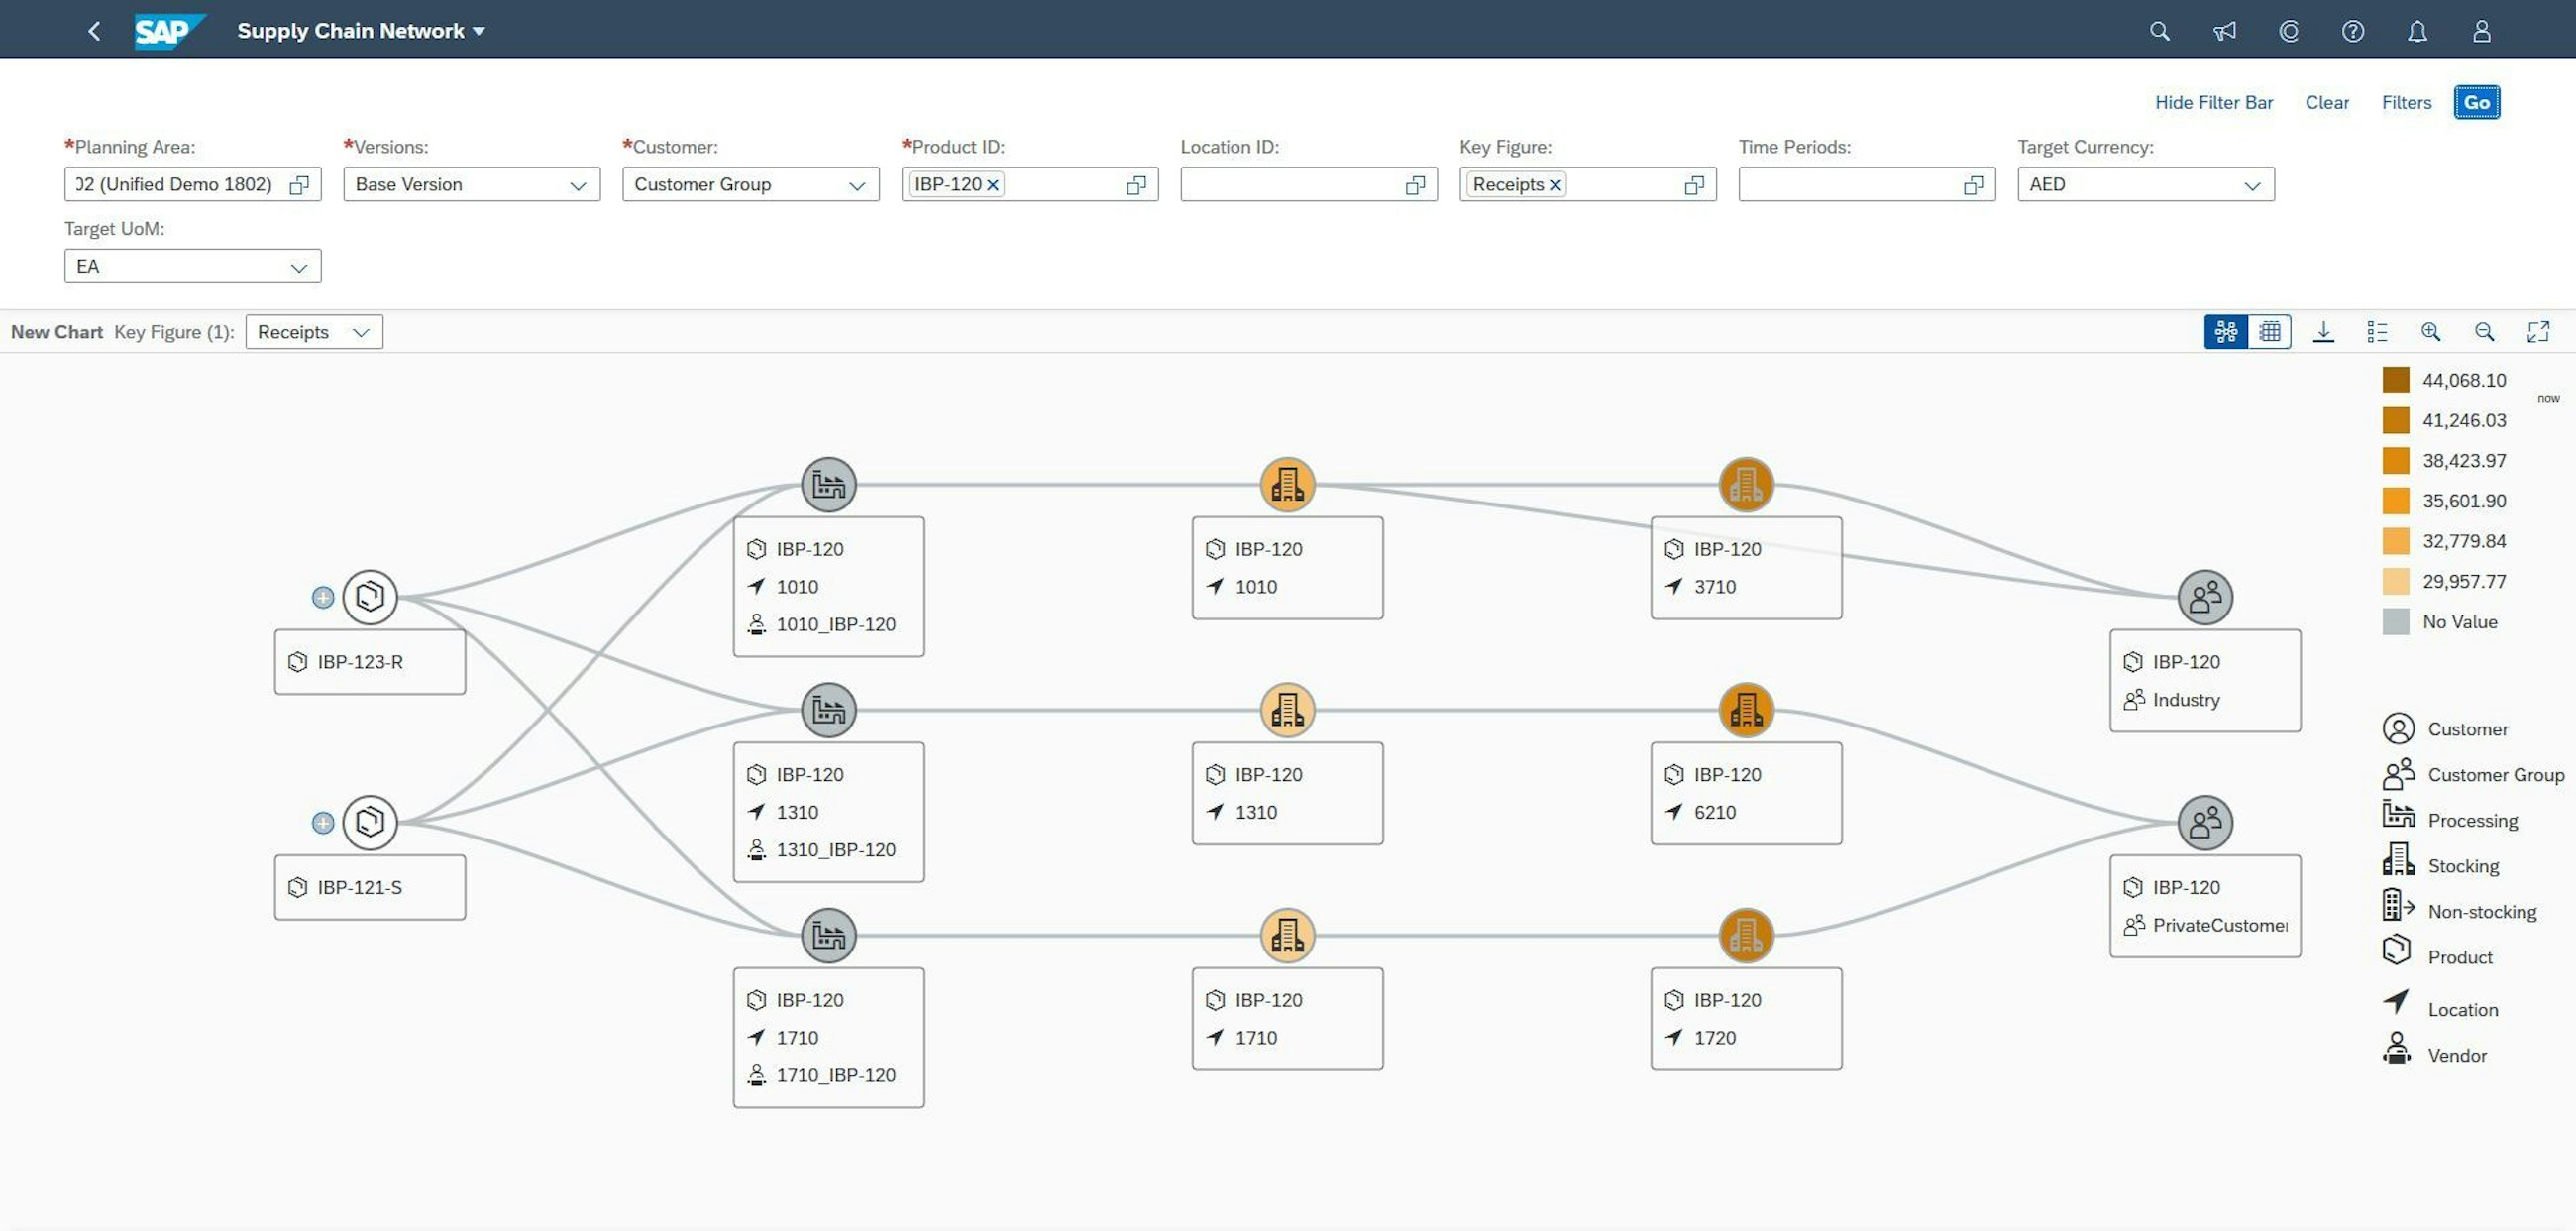
In the Supply Chain Network app, you can create a Supply Chain Network chart by selecting a planning area, a version, product IDs and key figures. The rendered chart includes products and locations as well as attributes and any selected key figure information.
Each element of the chart represents a part of the supply chain, for example, a supplier, a production plant, a warehouse or a customer as well as the paths (or arcs) along which items (materials or finished goods) transit.
With the 1908 upgrade, a plus sign (+) has been introduced next to every product node. With this new button, you can now extend the rendered chart from that node without editing your initial filter selections. For component products upstream of the network, the plus button is placed on the left, whereas for finished goods or other material downstream of the network the button can be found on the right side.
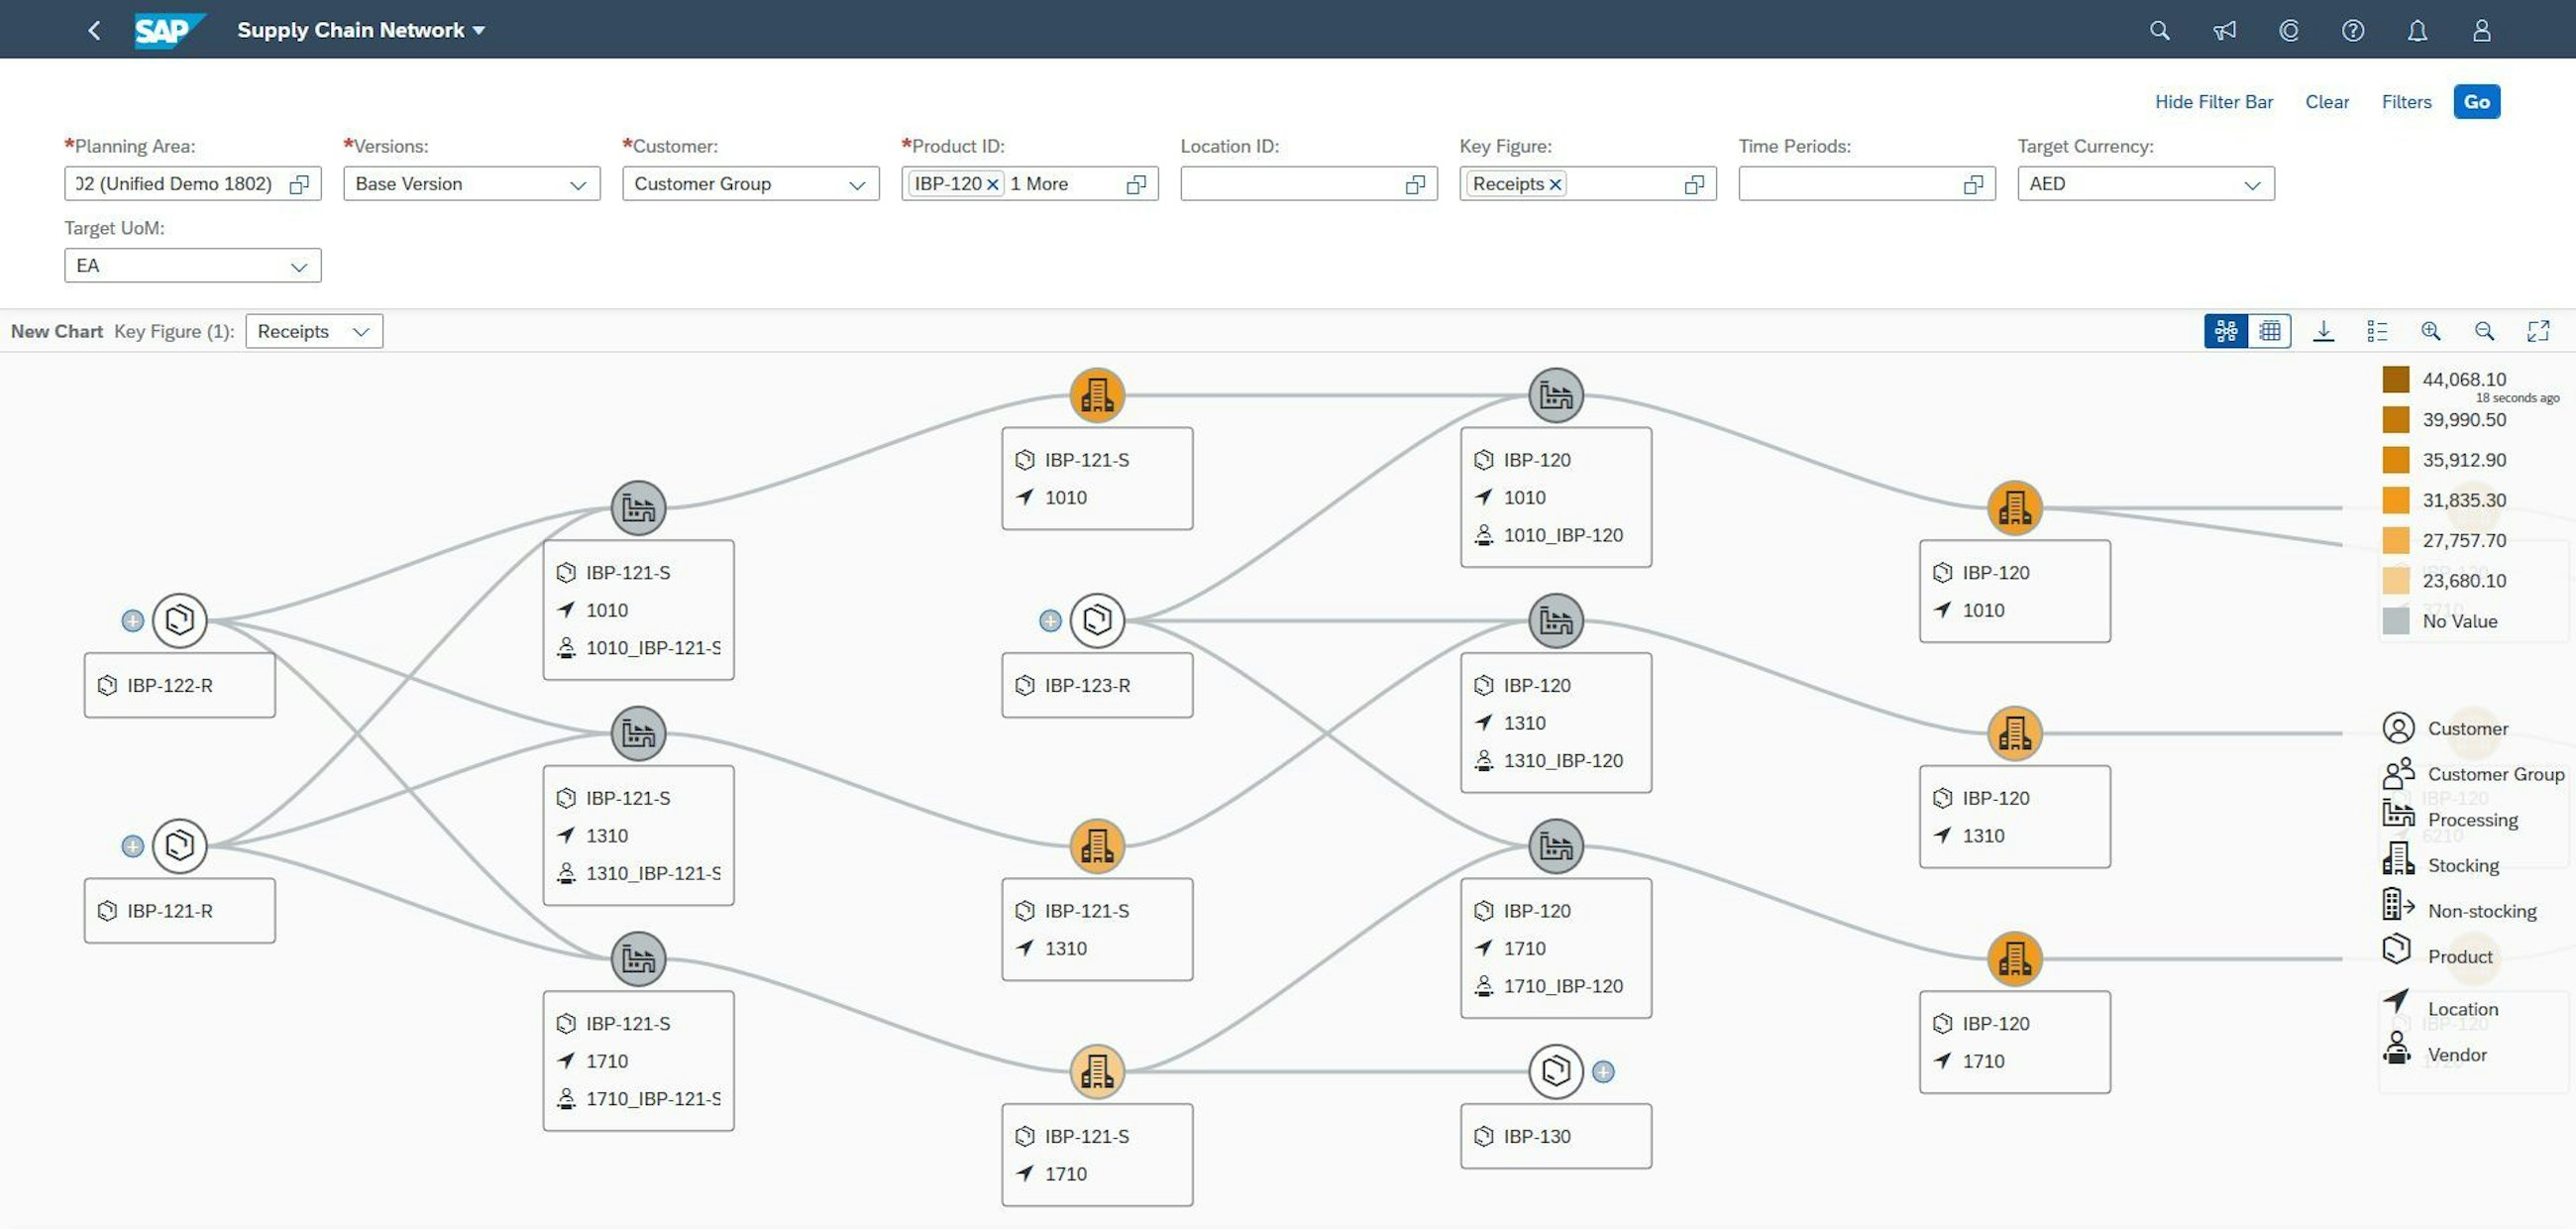
In addition, when expanding, the rendered chart will centre around the expanded network, which will facilitate the navigation. The app, which had long needed usability improvements, has certainly improved – the navigation through the network to validate master data and key figures is now smoother.
3. No more empty rows in your planning views! Plus, other Excel Add-In enhancements
One of the perks of SAP IBP is certainly the user-friendly Excel front-end. However, users will also recognise that setting up your own planning view or editing existing templates can sometimes be a challenge, given all the settings available. Therefore, SAP has a strong focus on how to improve the user-friendliness of the Excel Add-In to improve its usability for its end users.
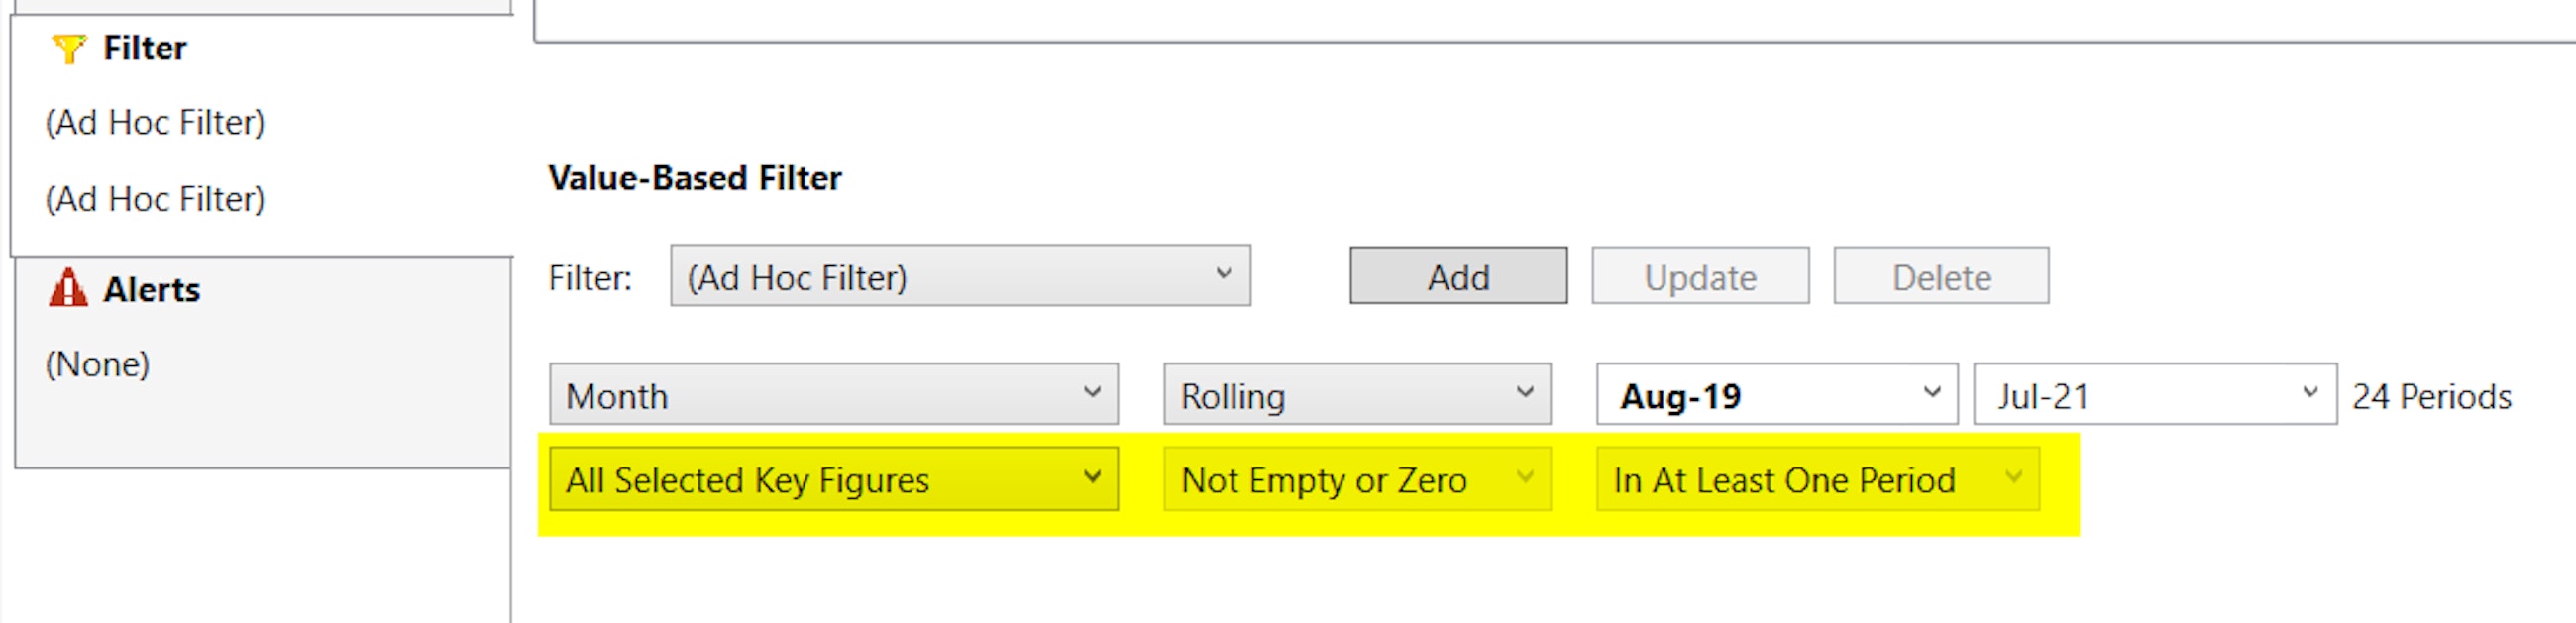
With the 1908 upgrade, you can now remove those planning combinations where all key figures are empty (or zero) from planning views. You can do this by using a newly available value-based filter option: in the key figures drop down, you can now select the option “All Selected Key Figures”, which will automatically switch the operator to “Not Empty or Zero” and the time dimension to “In At Least one Period”, thereby removing all the “empty” combinations.
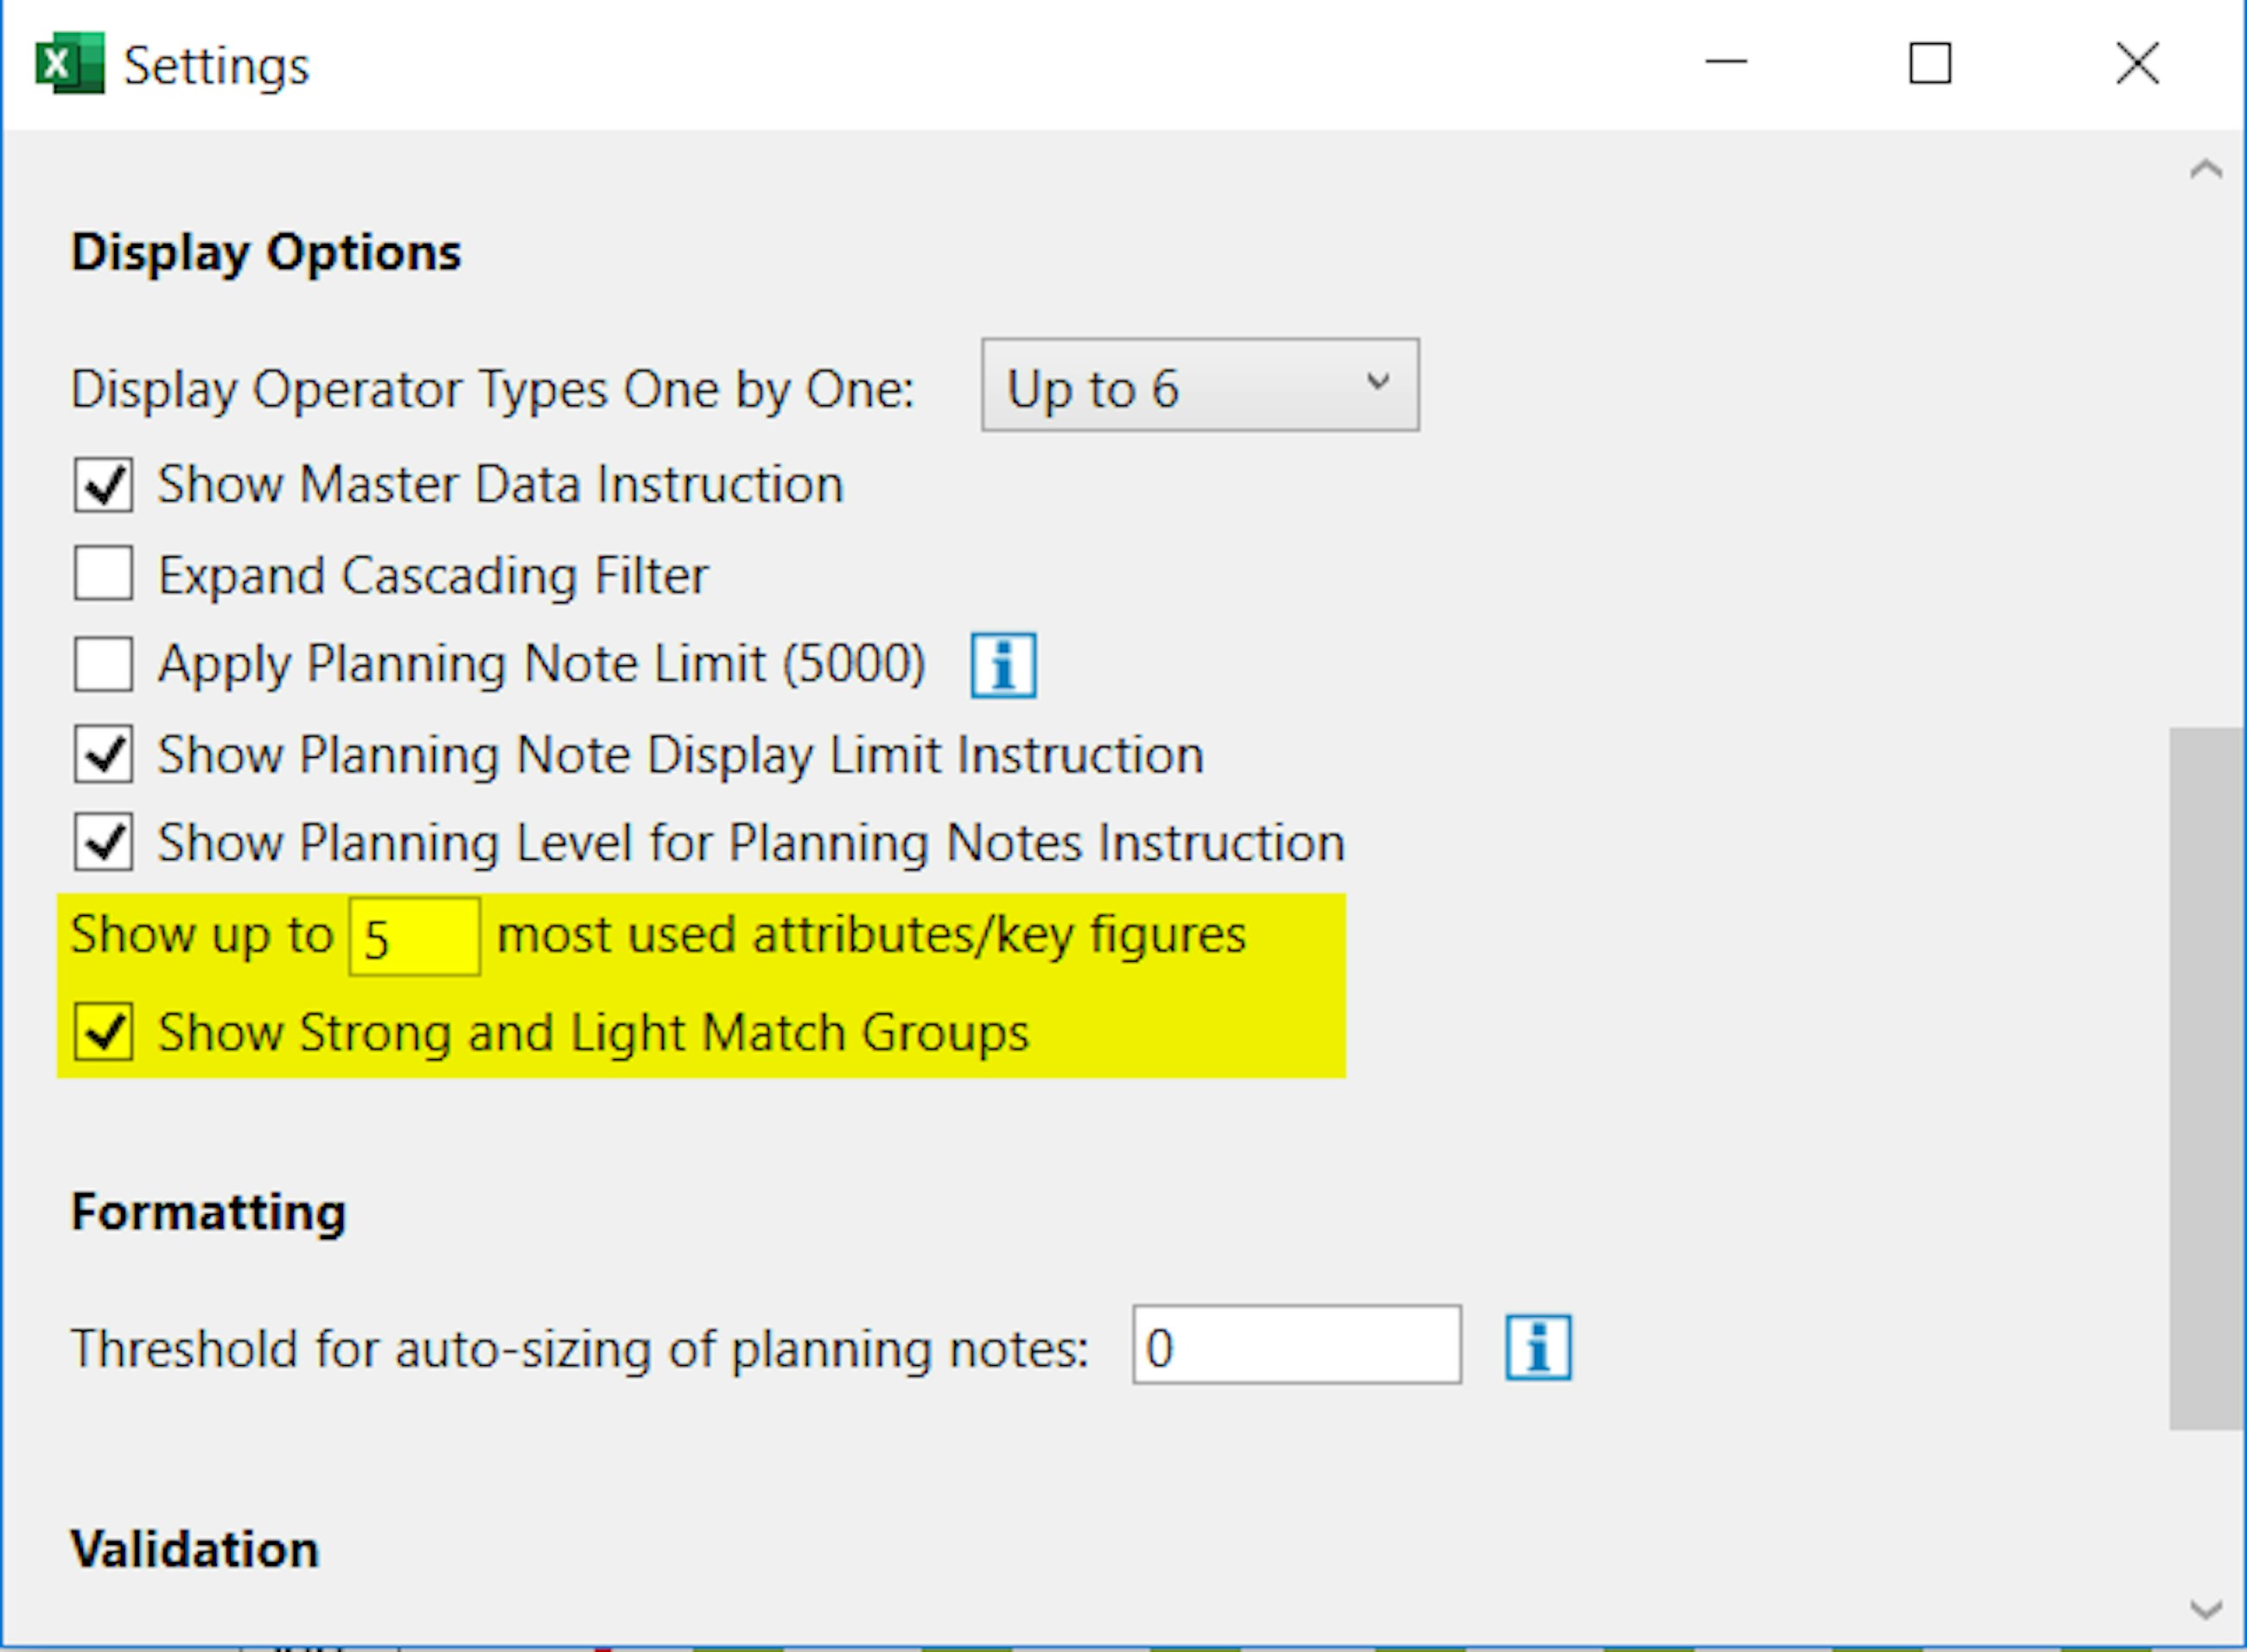
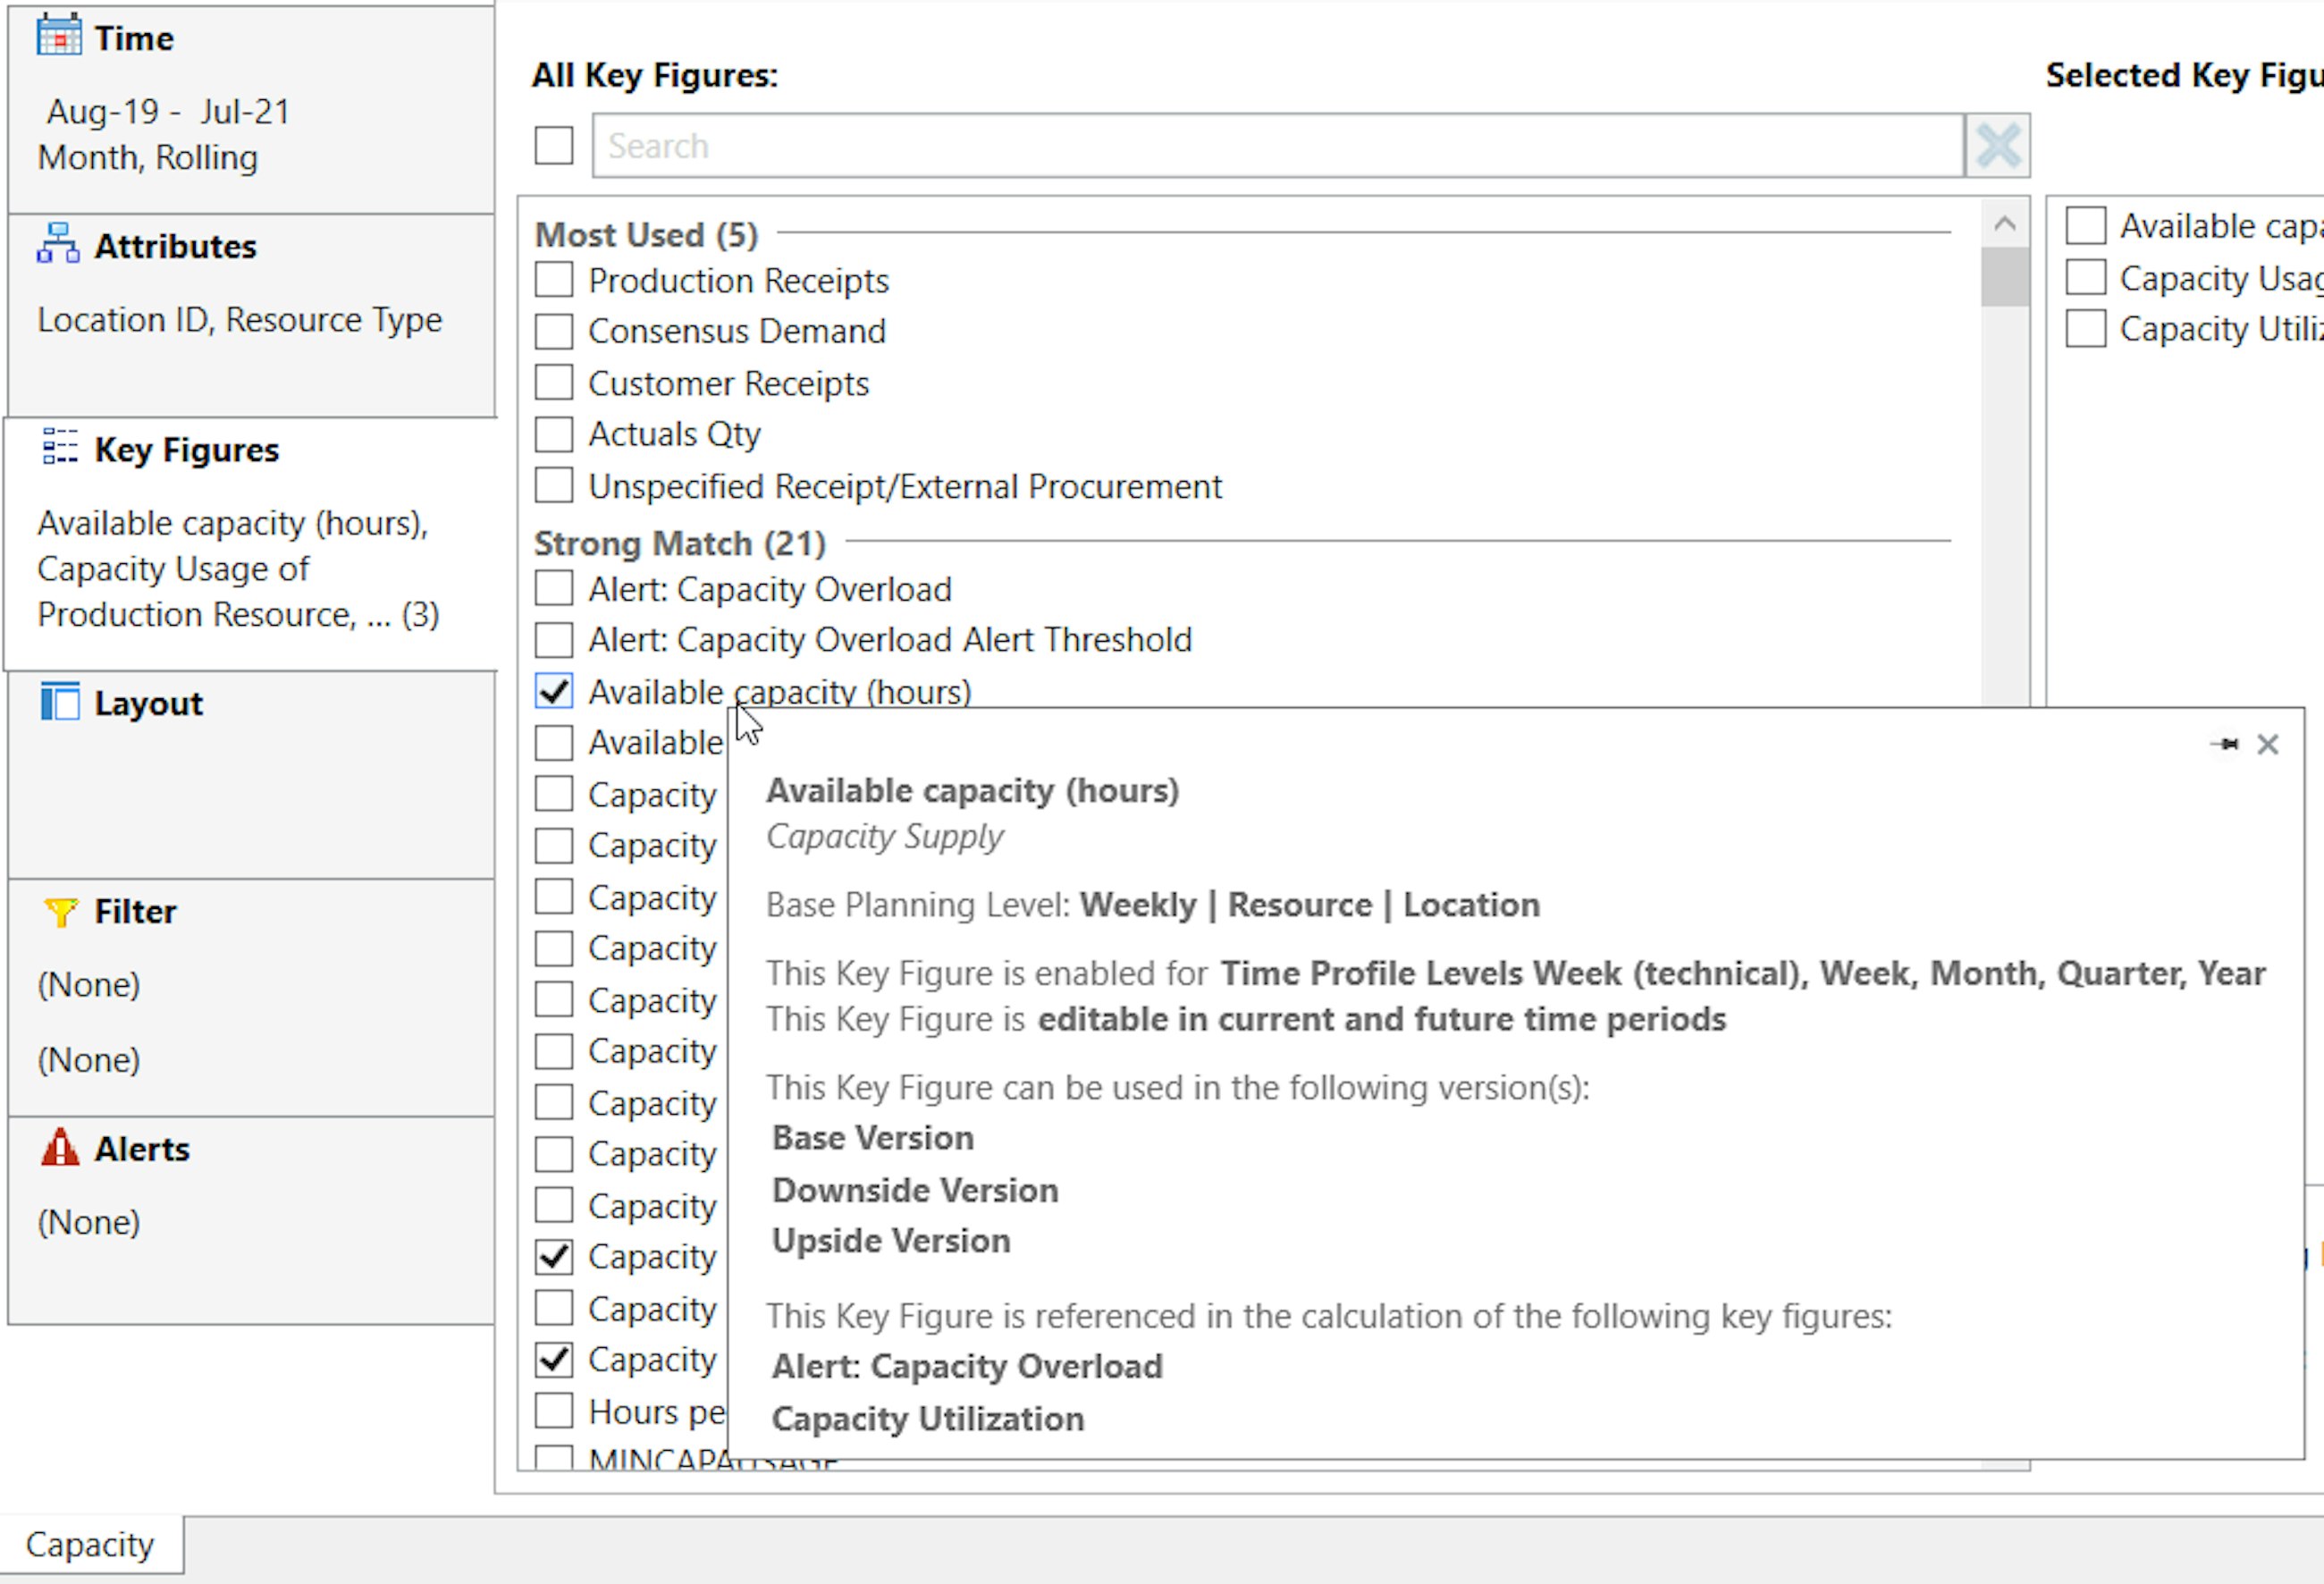
To add on to this, the Excel Add-In has also gained other interesting features. One of them is the “Strong and Light Match” functionality, which creates grouping of Attributes and Key Figures when editing the Planning View. Based on existing selections (of attributes, time period and key figures), attributes and key figures will be grouped in these two categories: the Strong Match will include those items that would lead to a full coverage on the planning view without showing any empty/(None) elements. The items listed in the Light Match group would lead to a partial coverage on the planning view.
If you are wondering how this will affect the “Most Used” grouping introduced with the 1902 release, we have the answer: both will be available and can work in parallel. However, you can switch either of the two on or off via the user settings. The general rule is that an item that is part of one group will not be part of any other group. So, if a key figure is part of the most used list, then it will not show up as a strong or light match.
Another great enhancement is the change in the Tooltips (the box that shows up when a user hover over key figures when editing the planning view). Now they show plenty of information on how the key figure is defined, such as the base planning level, if fixing or planning notes are allowed, and in which horizon the key figure is editable.
If you want to be able to benefit from these new functionalities, remember to install the newest version of the IBP Excel Add-In.
4. New functionalities to cover your Supply Planning needs
A new type of resources was introduced with the 1905 release in order to be able to accurately plan for transportation of goods: Transportation Resources. You use these to model capacity consumption of transportation, that is, the amount of capacity consumed per unit of product transported. As of 1905, these resources were only considered by the Optimizer, while with the latest upgrade, they are now also taken into account by the Heuristic. However, it is important to highlight that the capacity of these transportation resources is considered infinite by the Heuristic, in the same way as the capacity of production resource is considered infinite.
A complete novelty with regard to Supply Planning consists of aggregated constraints that use a conversion factor of capacity consumption to allocate minimum and/or maximum resource utilisation to production (and transportation) resources. What does this mean, and where is it relevant?
For transportation, you can use two new key figures (MINAGGTCAPAUSAGE and MAXAGGTCAPAUSAGE) so that adequate capacity is reserved for transportation. You could, for example, reserve space in a truck for a group of products in a certain period, even if you do not know in advance how many products will be transported, or what the mix of products will be.
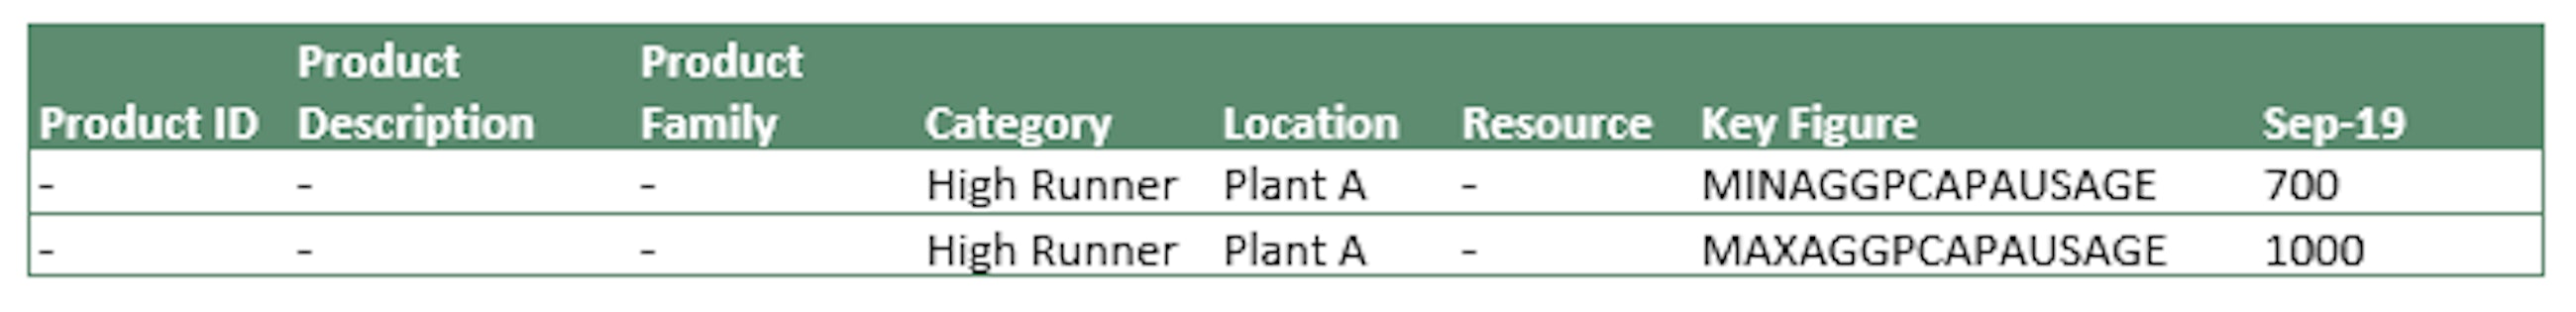
For production planning, we may want to ensure that certain products (for example, our high runners) are manufactured on a production line in a specific time period. Now you can model this by allocating a specified amount of time for these products, defined as a production capacity usage aggregated constraint. For example, you could specify that you want to consume a minimum of 700 hours and a maximum of 1000 hours for your high-runner products in September 19.
To model this scenario, the newly available key figures MINAGGPCAPAUSAGE and MAXAGGPCAPAUSAGE can be used.
5. Connect your IBP solution to SAP Analytics Cloud for increased synergies across your organisation
Often, we see companies struggling with their planning processes due to lack of cross-functional collaboration and alignment. “How is the consensus forecast impacting the P&L projection?”, “Should we extend the capacity in-house or outsource part of our production?”, “How will our new pricing model affect sales?” These are some of the critical questions that planners often fail to find precise answers to.
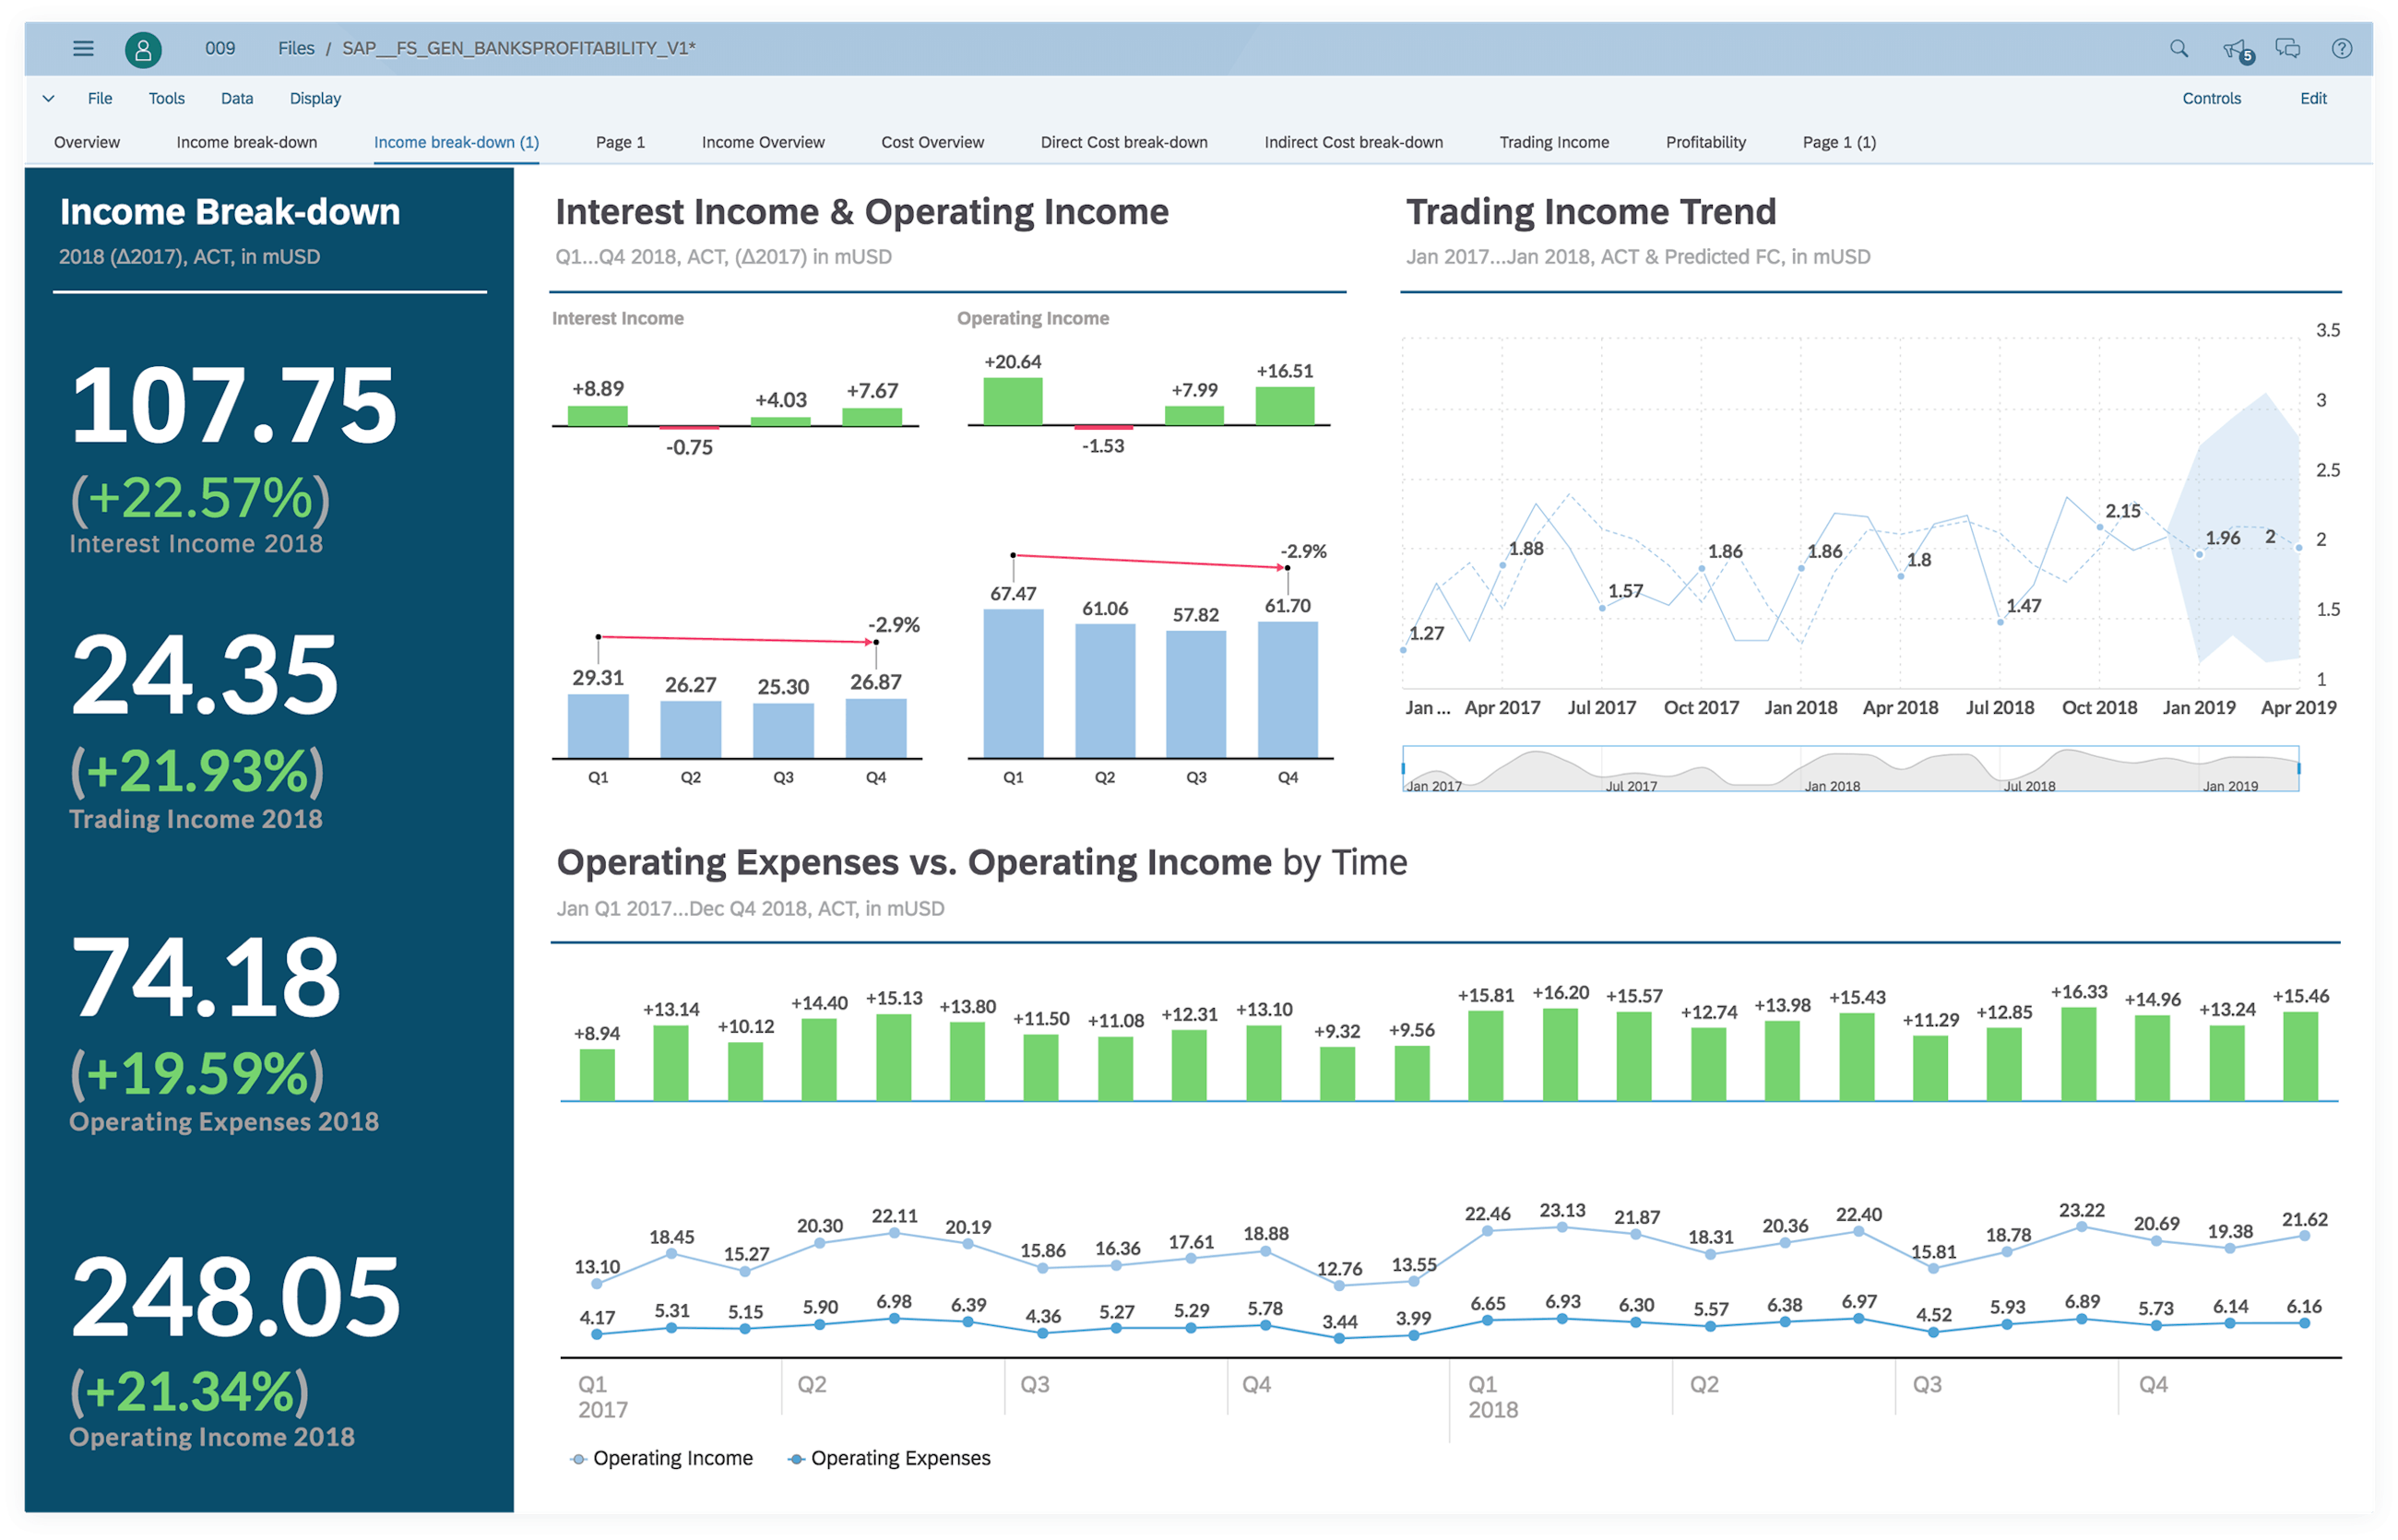
To solve the challenge of disconnected planning outputs, which usually leads to poor execution, and to break down the traditional planning silos, you need a harmonised and collaborative planning process. When you couple SAP IBP with SAP Analytics Cloud (SAC), it allows your company to run an end-to-end planning process across finance, commercial and supply chain functions.
For example, you may want to send to SAP IBP financial planning data from SAP Analytics Cloud to align demand and supply plans with corporate financial plans. For instance, a long-term value plan created in SAC can be sent to IBP where it gets translated into volume to create a supply chain plan for the next three years. Based on available capacity, a constrained revenue can be sent back to SAC where it can be used as a starting point for financial activities such as creating the detailed annual budget, making cost assumptions, evaluating capacity investments etc.
What is more is that SAC integrates not only to the Cloud but also to on-premise systems, including SAP BW and ECC. Thereby, much of the data consolidation, which is typically done in BW, you can now do in SAC.
Read our previous blog posts0 4


Related0 4
Article
Read more

Balancing act: Scaling energy transition organisations amidst uncertainty
Balancing immediate milestones and meeting long-term growth ambitions.Article
Read more

Navigating disruption in the European steel market
How EU steel-consuming businesses must source, price, and decarbonise steel.
Article
Read more