Article
– with forecast value-add

Article
Read more
13 June 2022
The importance of a high forecast accuracy in today’s supply chains is higher than ever before – or if not having a high forecast accuracy, at least having a stable and unbiased forecast or forecast range. At the same time, the opportunities of applying more advanced forecast algorithms to the demand planning process have also increased. But how do we know that we are improving the forecast accuracy with a changed statistical model or with the promotion plan that we are currently running?
In this article, we are explaining how applying forecast value-add measures linked to the forecast accuracy of the different building blocks of the demand planning process can help organisations improve their forecast accuracy, increase the control of their forecast and streamline their process.
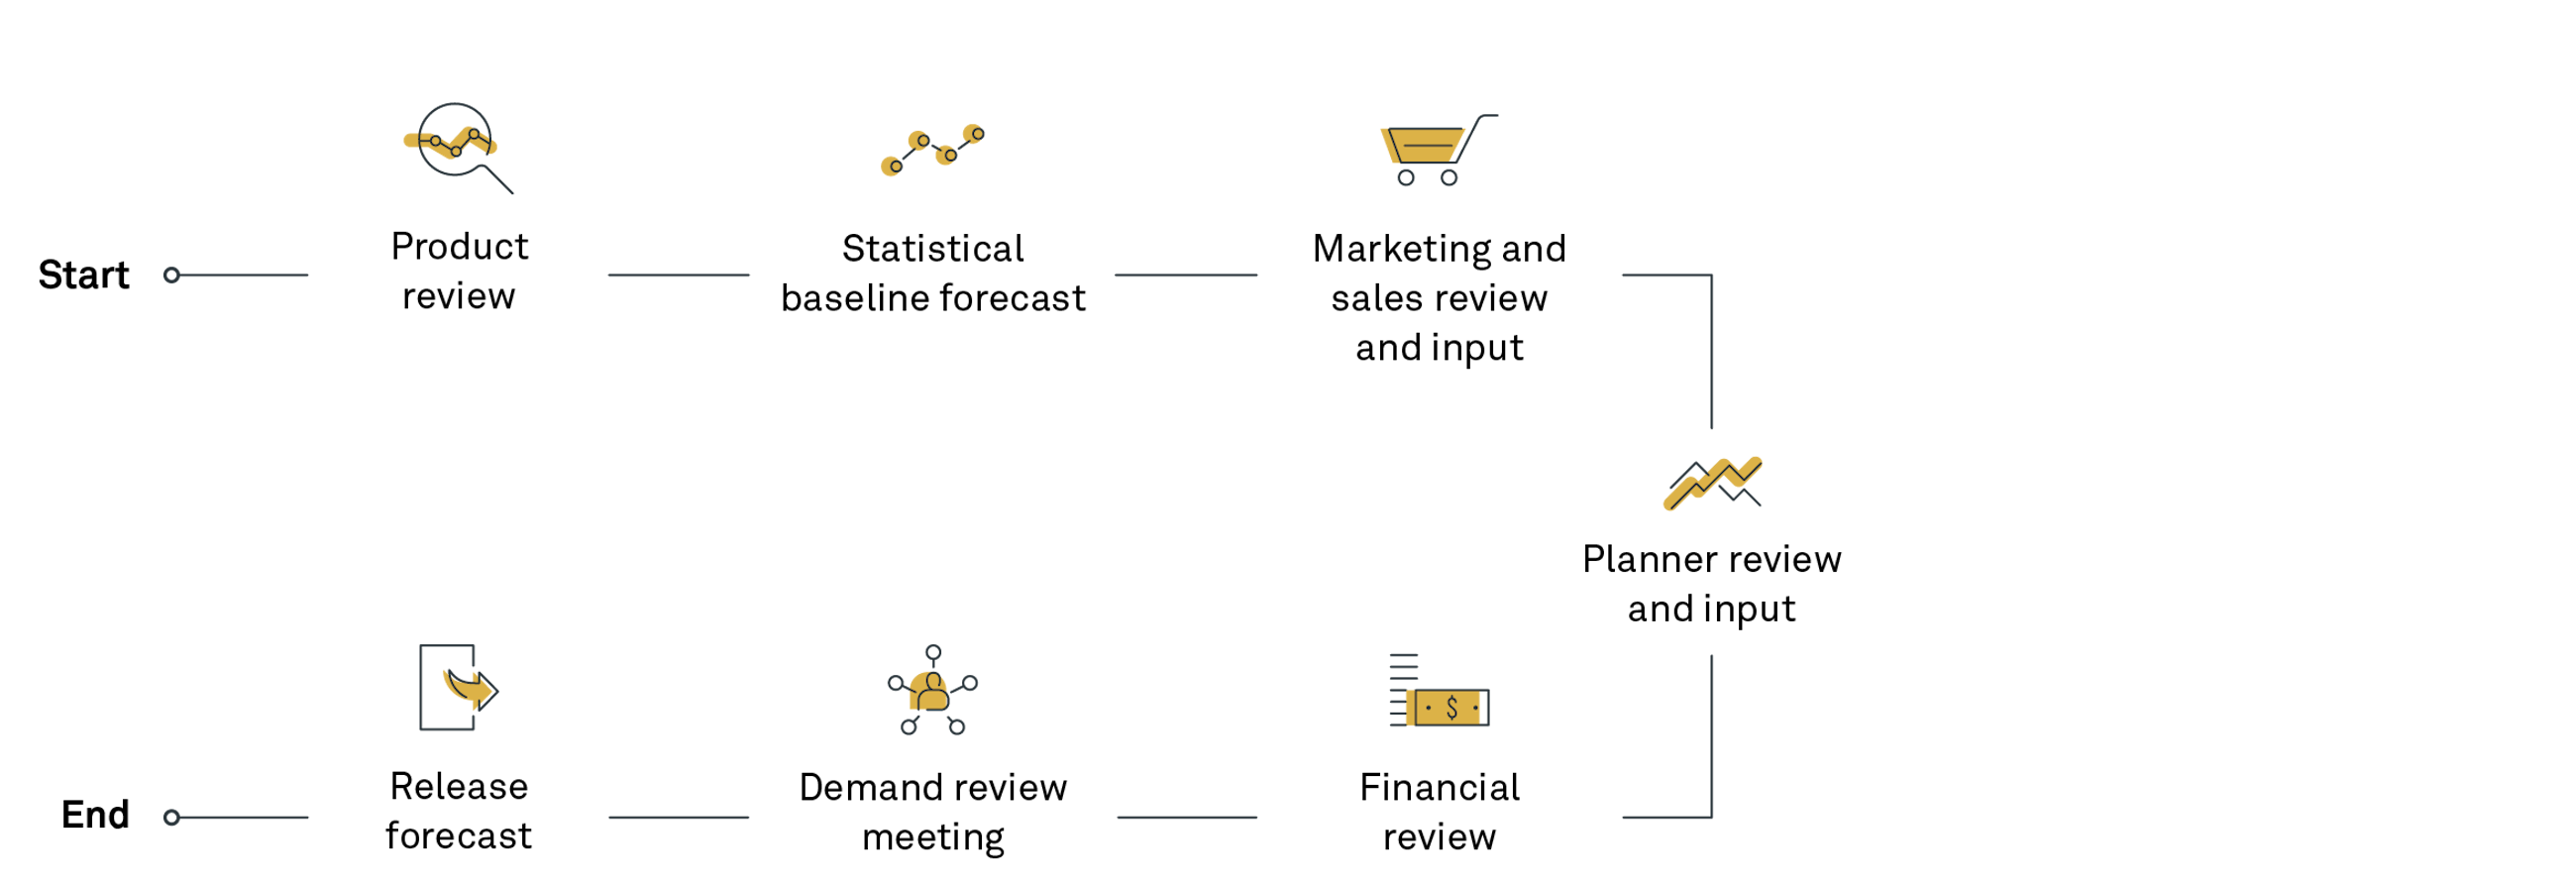
In the demand planning process, the different process steps are together constructing the final forecast. The forecast is constructed by reviewing and evaluating the product mix, applying statistical methods, incorporating seasonality knowledge based on historical consumption, collecting input from various stakeholders as sales and finance and adding on extra promotions.
It can be a challenging task to evaluate the input from the different areas, especially when we may miss forecast accuracy measures on the detailed level or if we are only able to compare the final released forecast with the historical actuals. By measuring the incremental shift of the forecast accuracy in each step of the demand planning process, we can evaluate the process steps to assure that the process is increasing the forecast accuracy and runs efficiently.
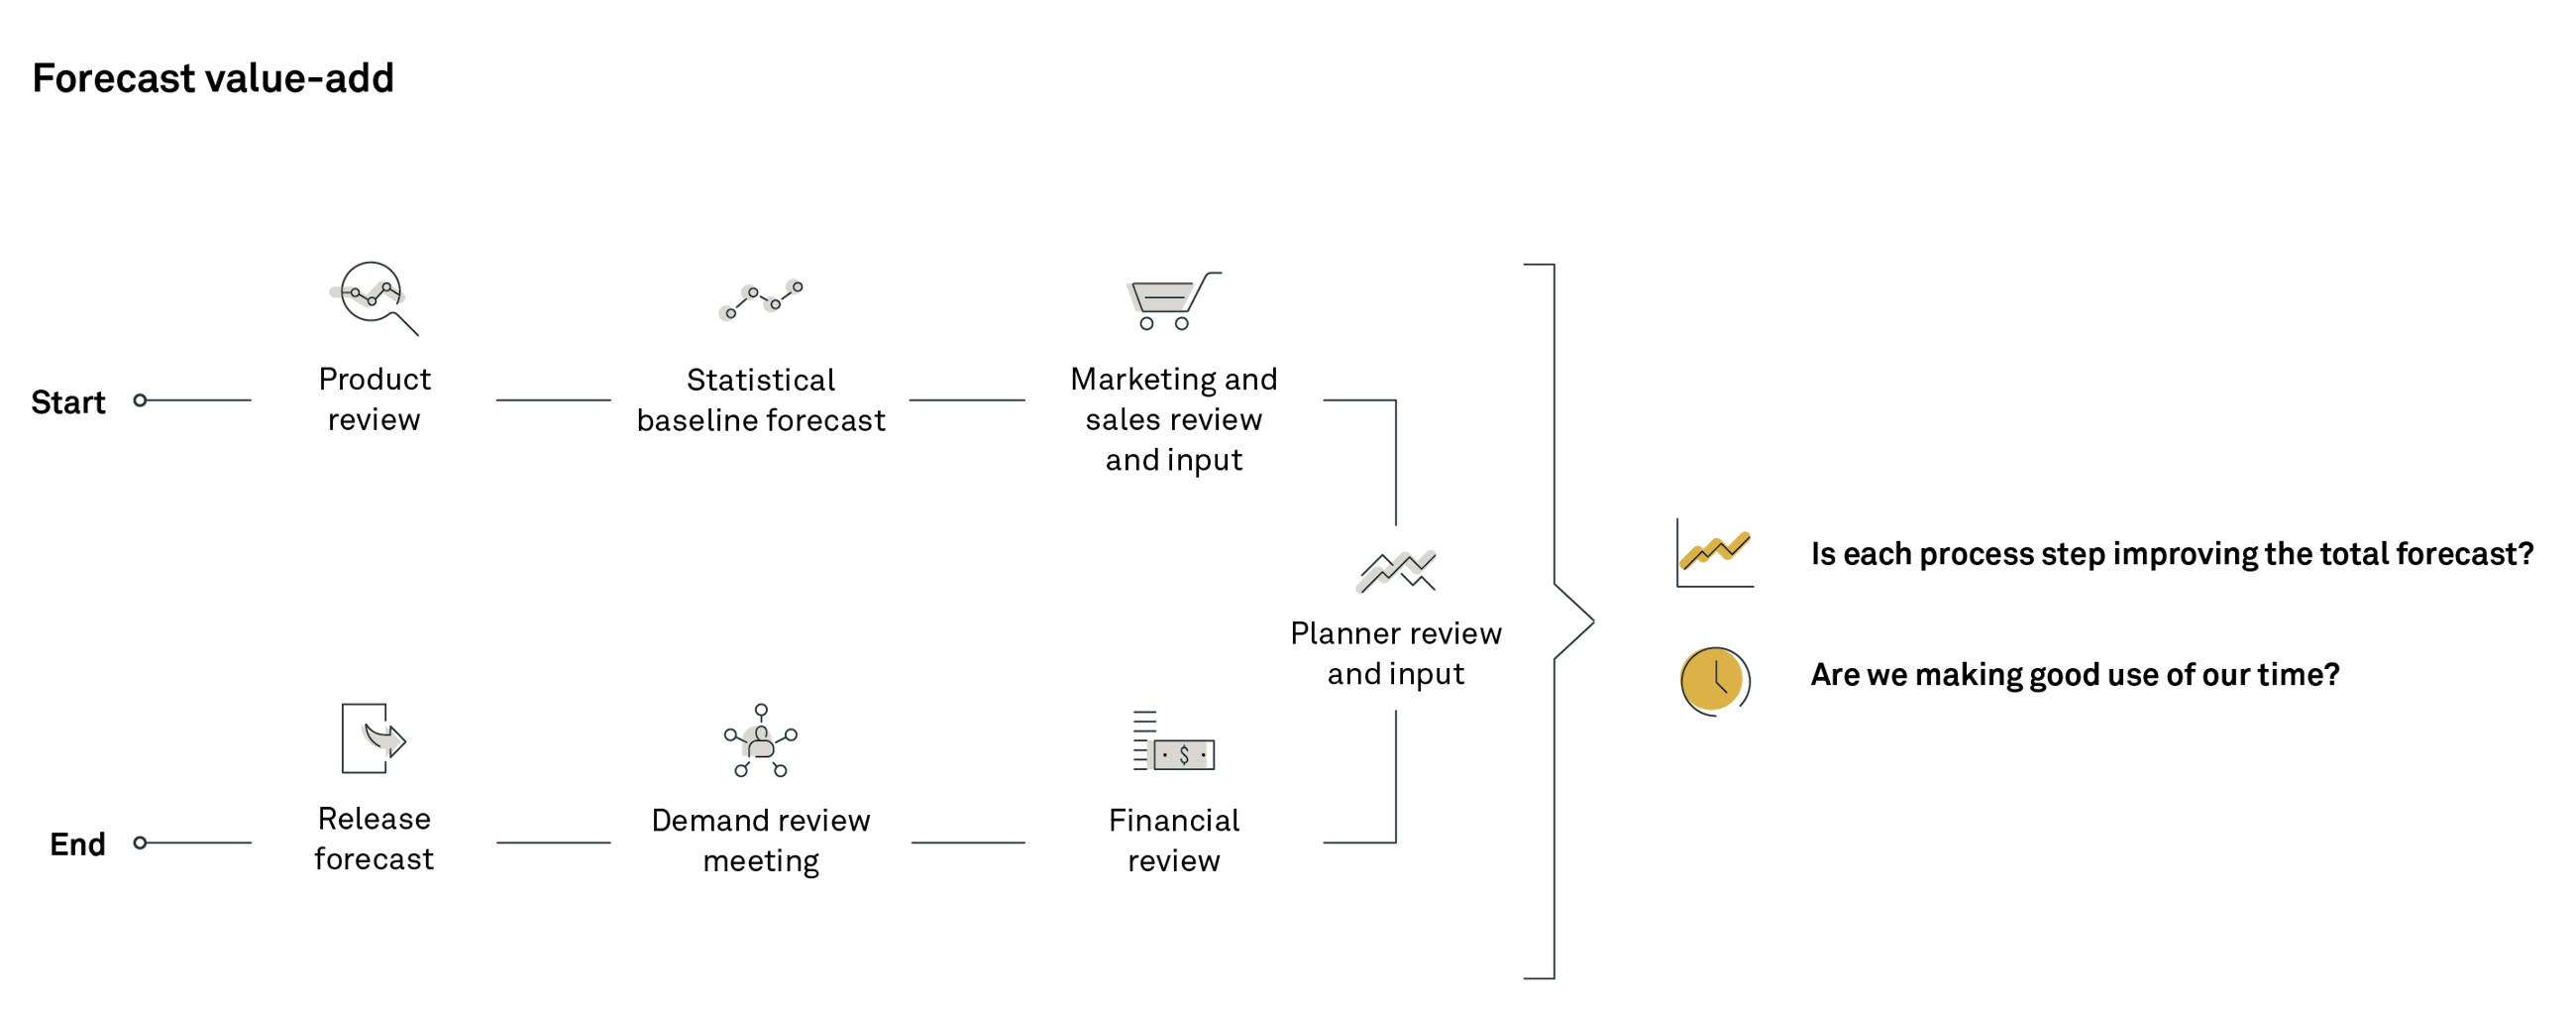
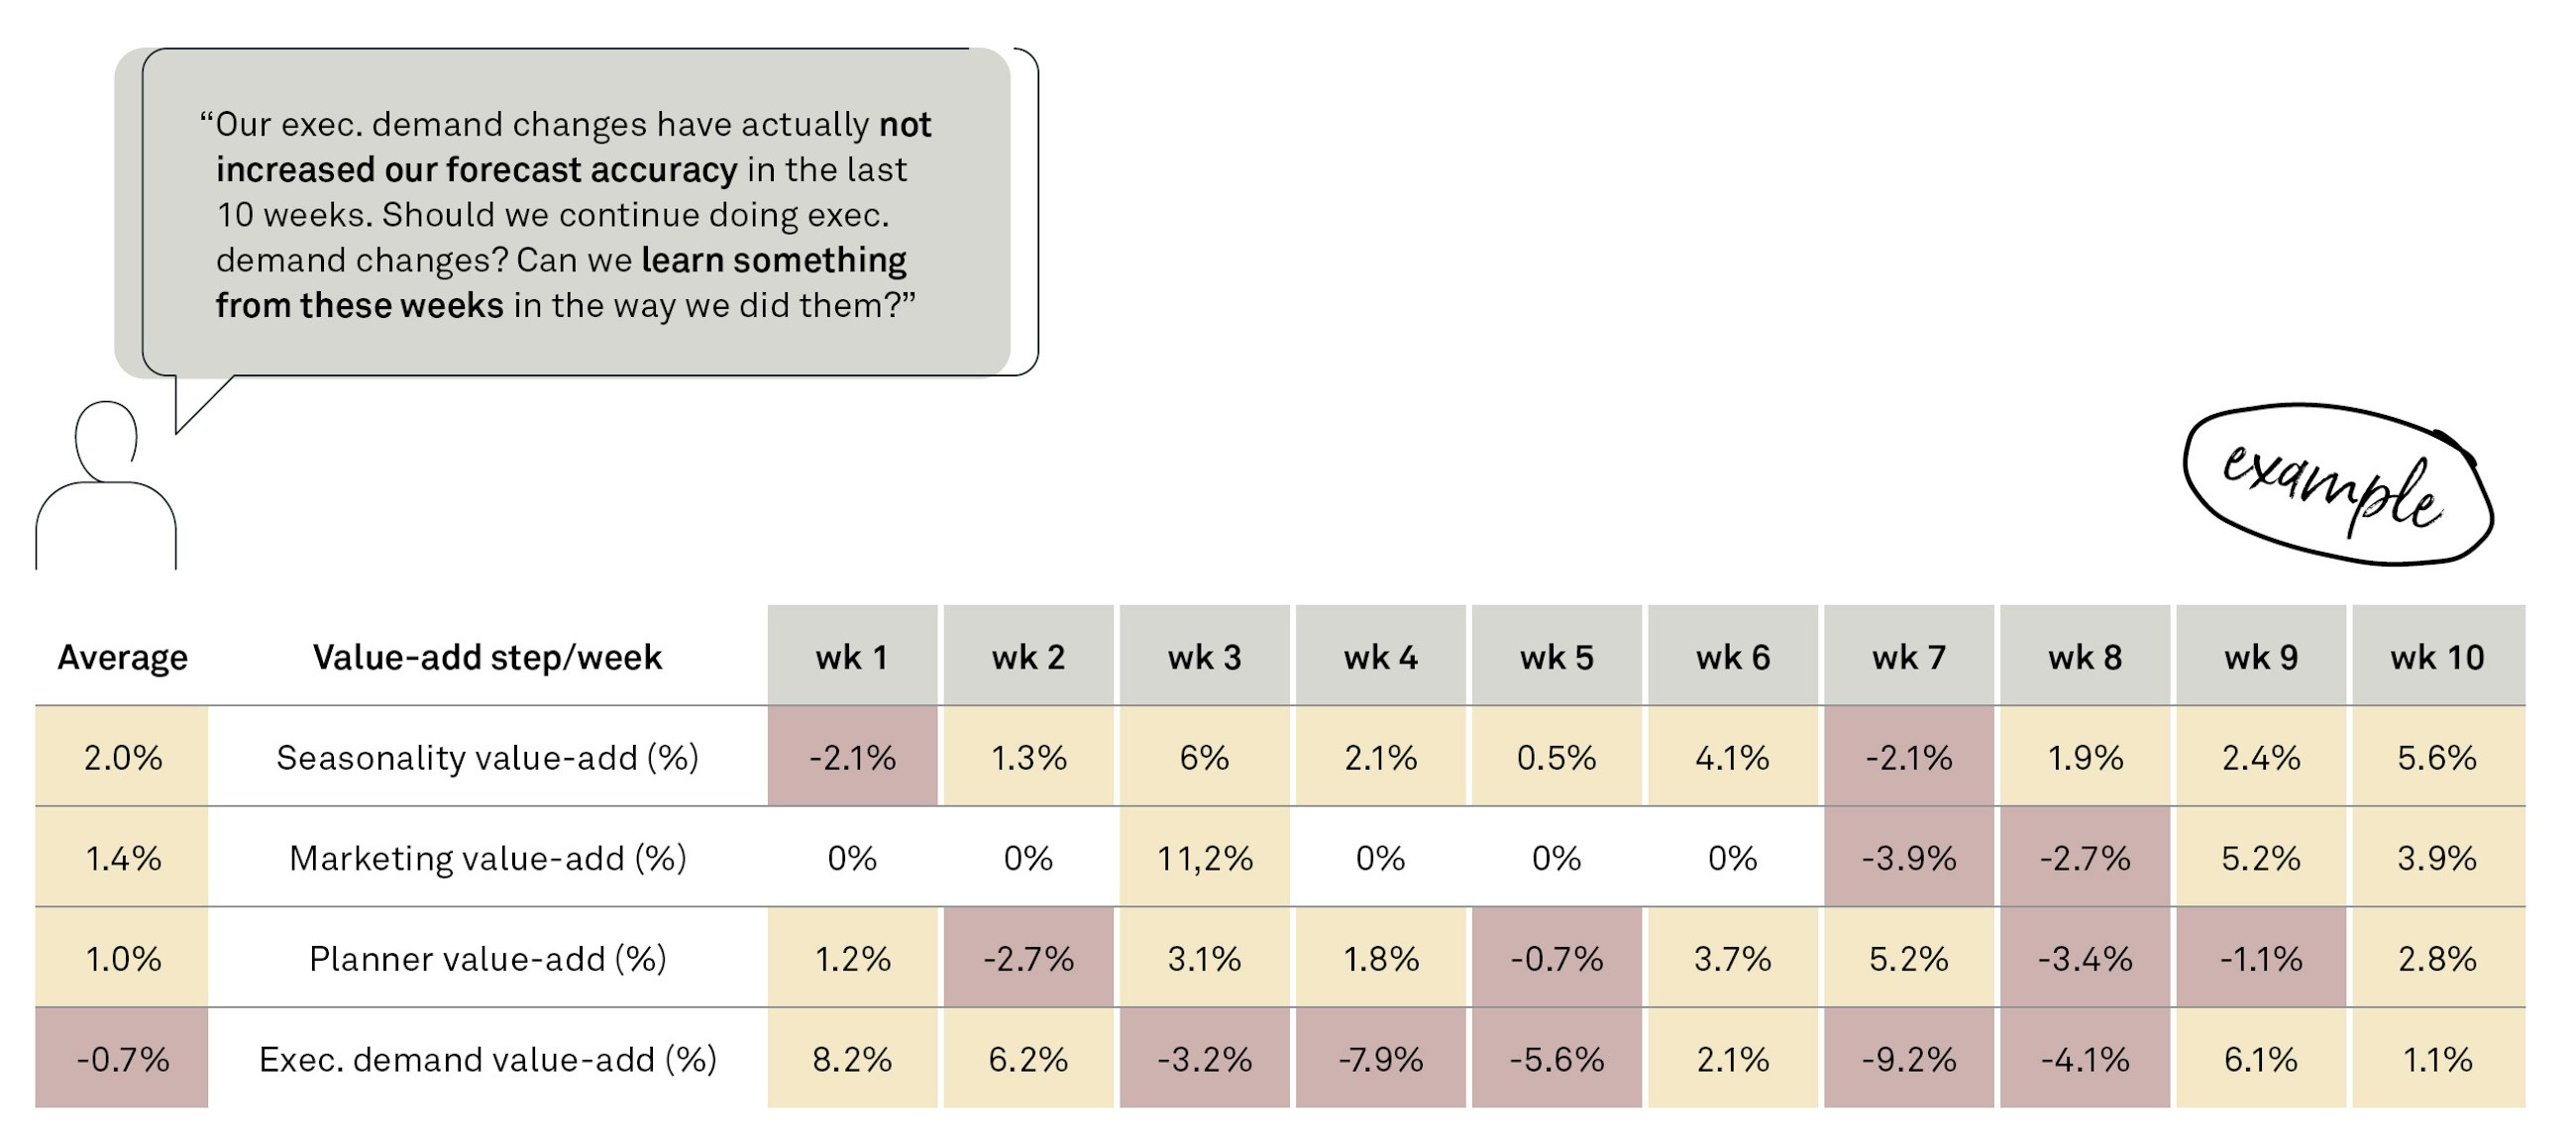
The forecast value-add measures the incremental shift in forecast accuracy of the process. When the forecast value-add is in place, learnings can be taken from the result. However, you should use the forecast value-add to find overall dysfunctional parts of the process, and therefore, it should be reviewed on an aggregated level as an average over multiple time periods.
When you analyse the forecast accuracy through the forecast value-add, the objective is mainly to answer two questions:
Therefore, it is important that the level at which the forecast value-add numbers are reviewed is similar to the responsibility level for the different input processes, e.g. product group, customer, sales area and industry.
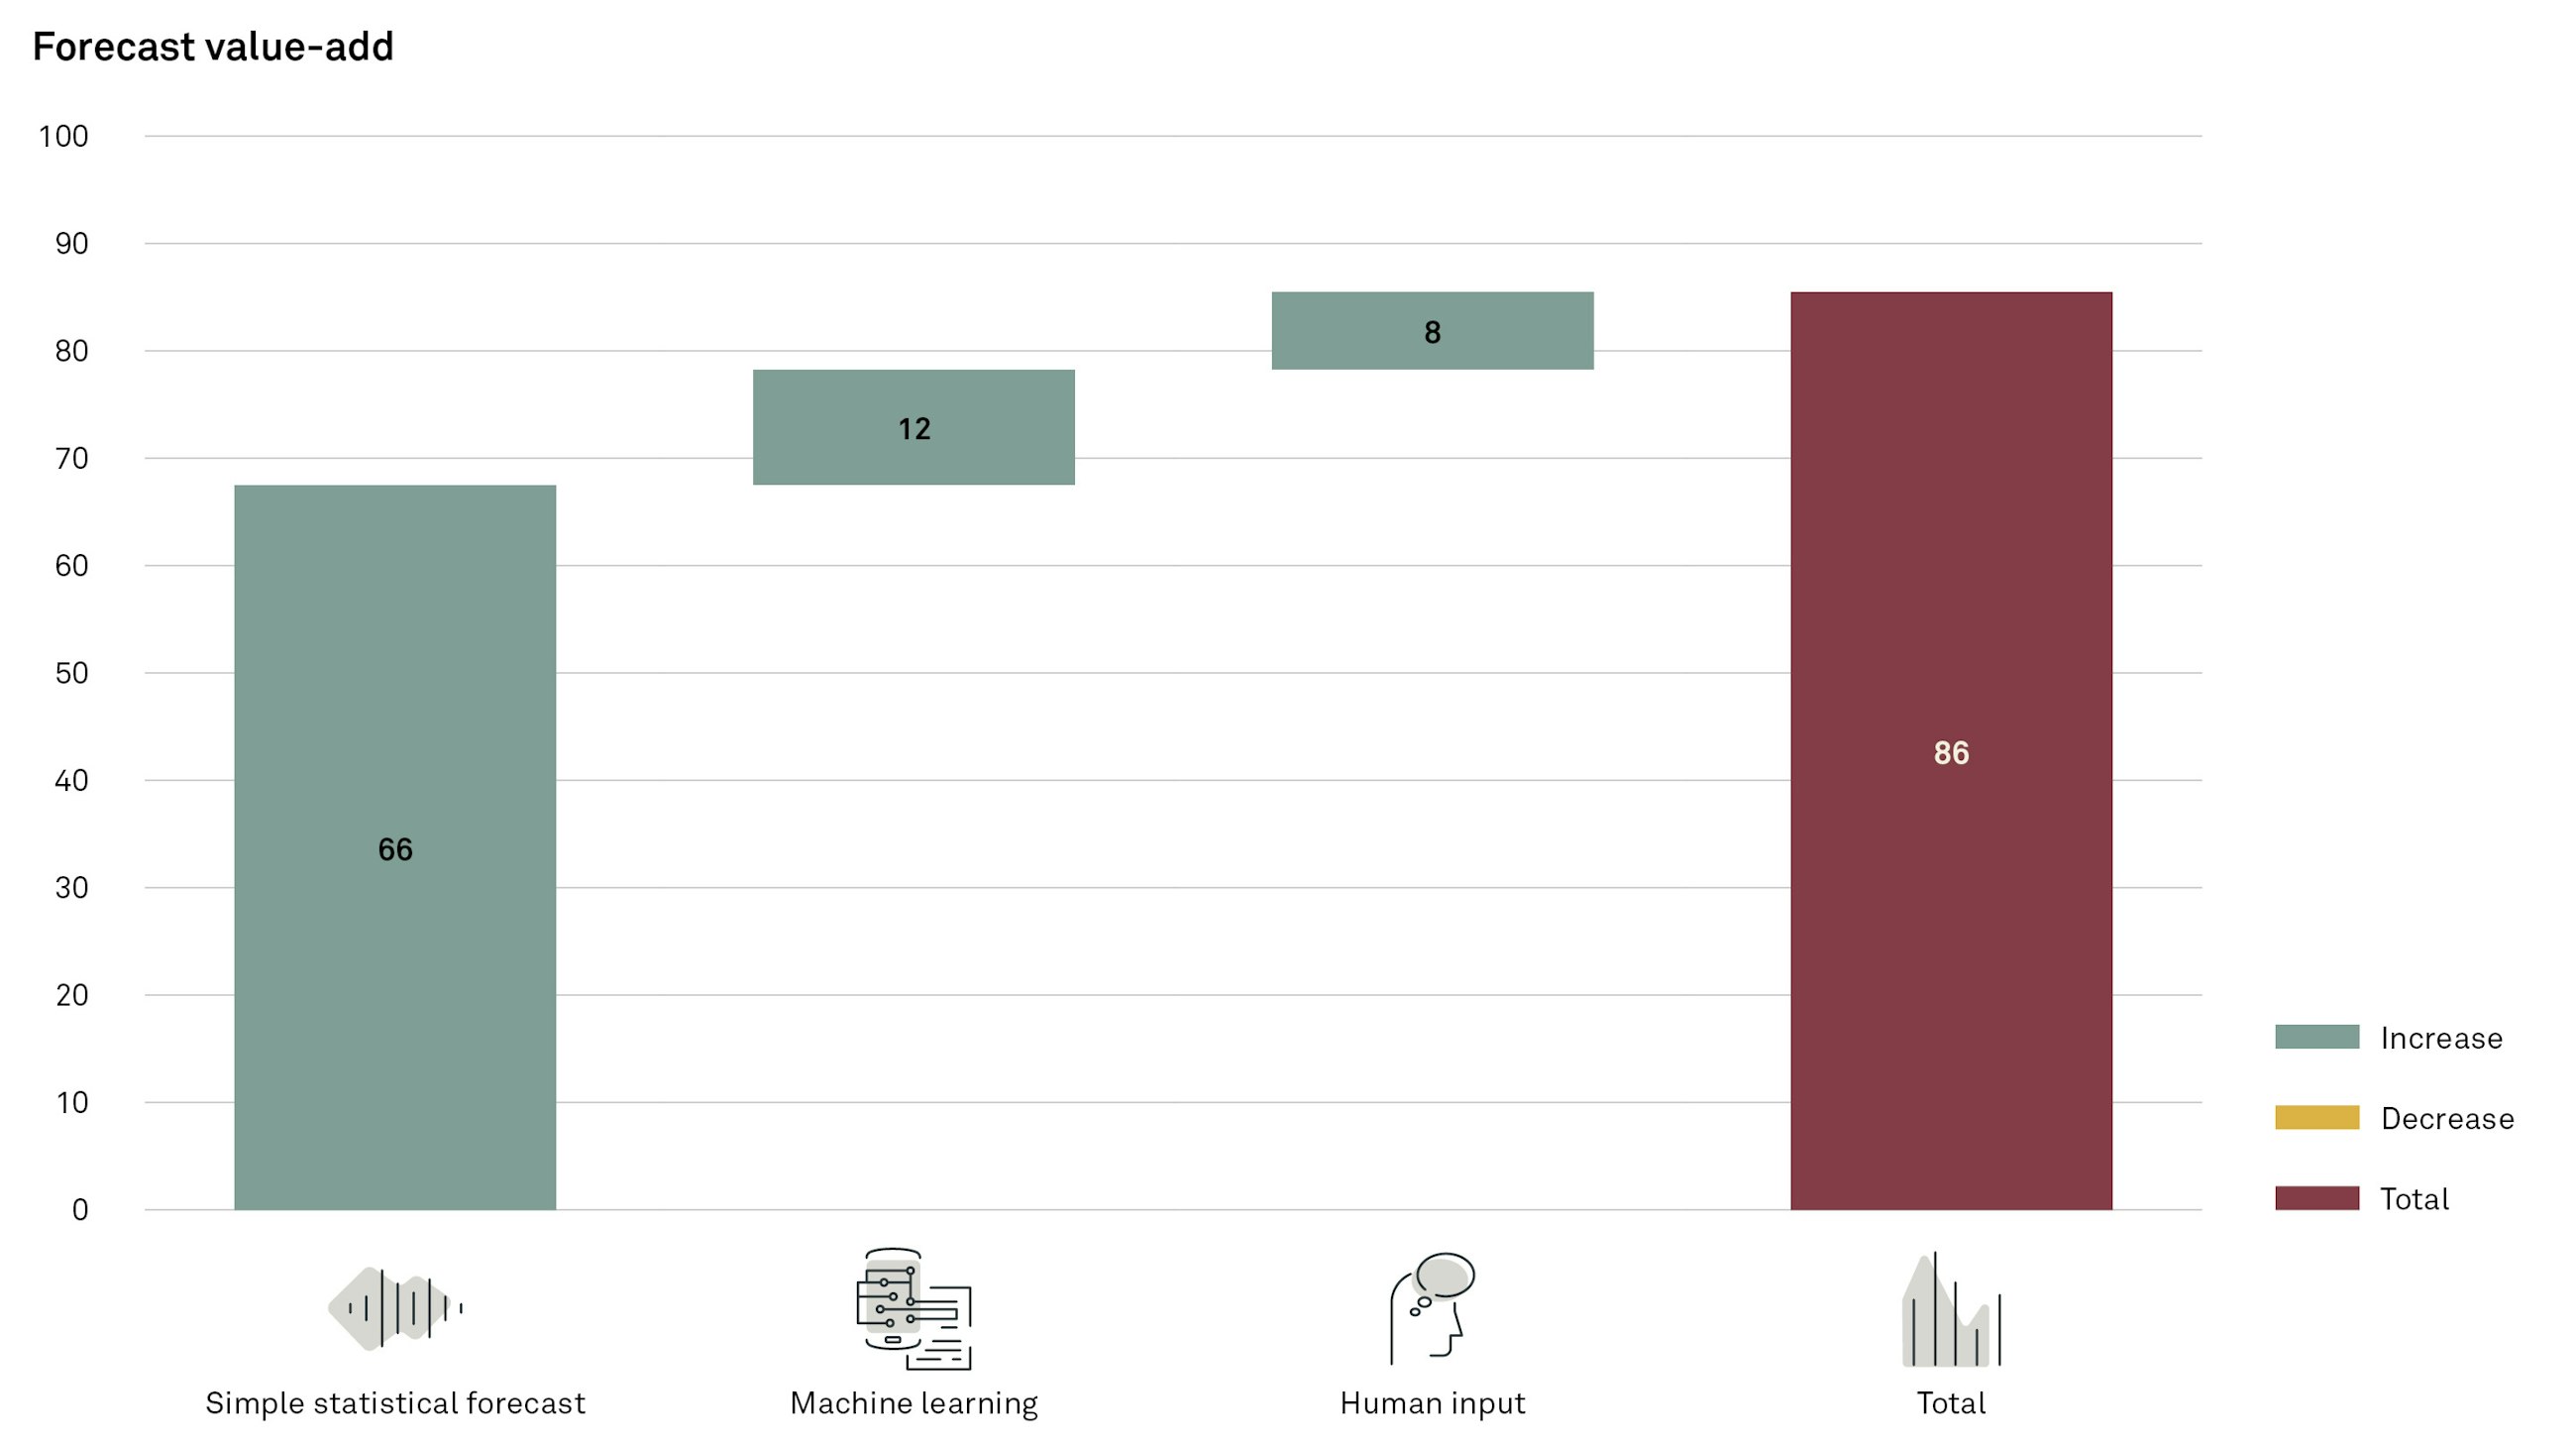
The starting point for the forecast value-add calculation is a simple statistical forecast model. If you have multiple steps to get to a baseline forecast, e.g. seasonality calculations, then these should have their own forecast value-add calculation.
Then the learnings obtained from analysing the forecast value-add numbers can result in actions in the demand planning process going forward – which will result in a more efficient demand planning process and a higher forecast accuracy. The forecast accuracy is not a management KPI but should be used by the demand planners to increase their knowledge about their process, statistical models and their manual inputs to improve it for the future. Therefore, you should incorporate the review of these numbers into the normal planning cycle.
You can also use the forecast value-add foundation to support the demand planning process where the baseline forecast is derived from machine learning algorithms.
Today, many companies are experimenting with machine learning algorithms. We see a lot of transitions from a more classical statistical forecast model selection process to investigating the possibilities of using machine learning algorithms instead. To support this process to develop, deploy and operate machine learning models, we recommend using a forecast value-add approach linked to it.
We have met multiple companies that have started using machine learning algorithms based on proof-of-concept results. But to justify the implementation of machine learning, we recommend comparing the performance of the machine learning algorithm on an on-going basis.
This ensures that the model adds value and can help the data scientist highlight where models should be re-evaluated and adjusted. For the simple statistical forecast, we recommend one of the following algorithms to use as the baseline for the value-add calculation:
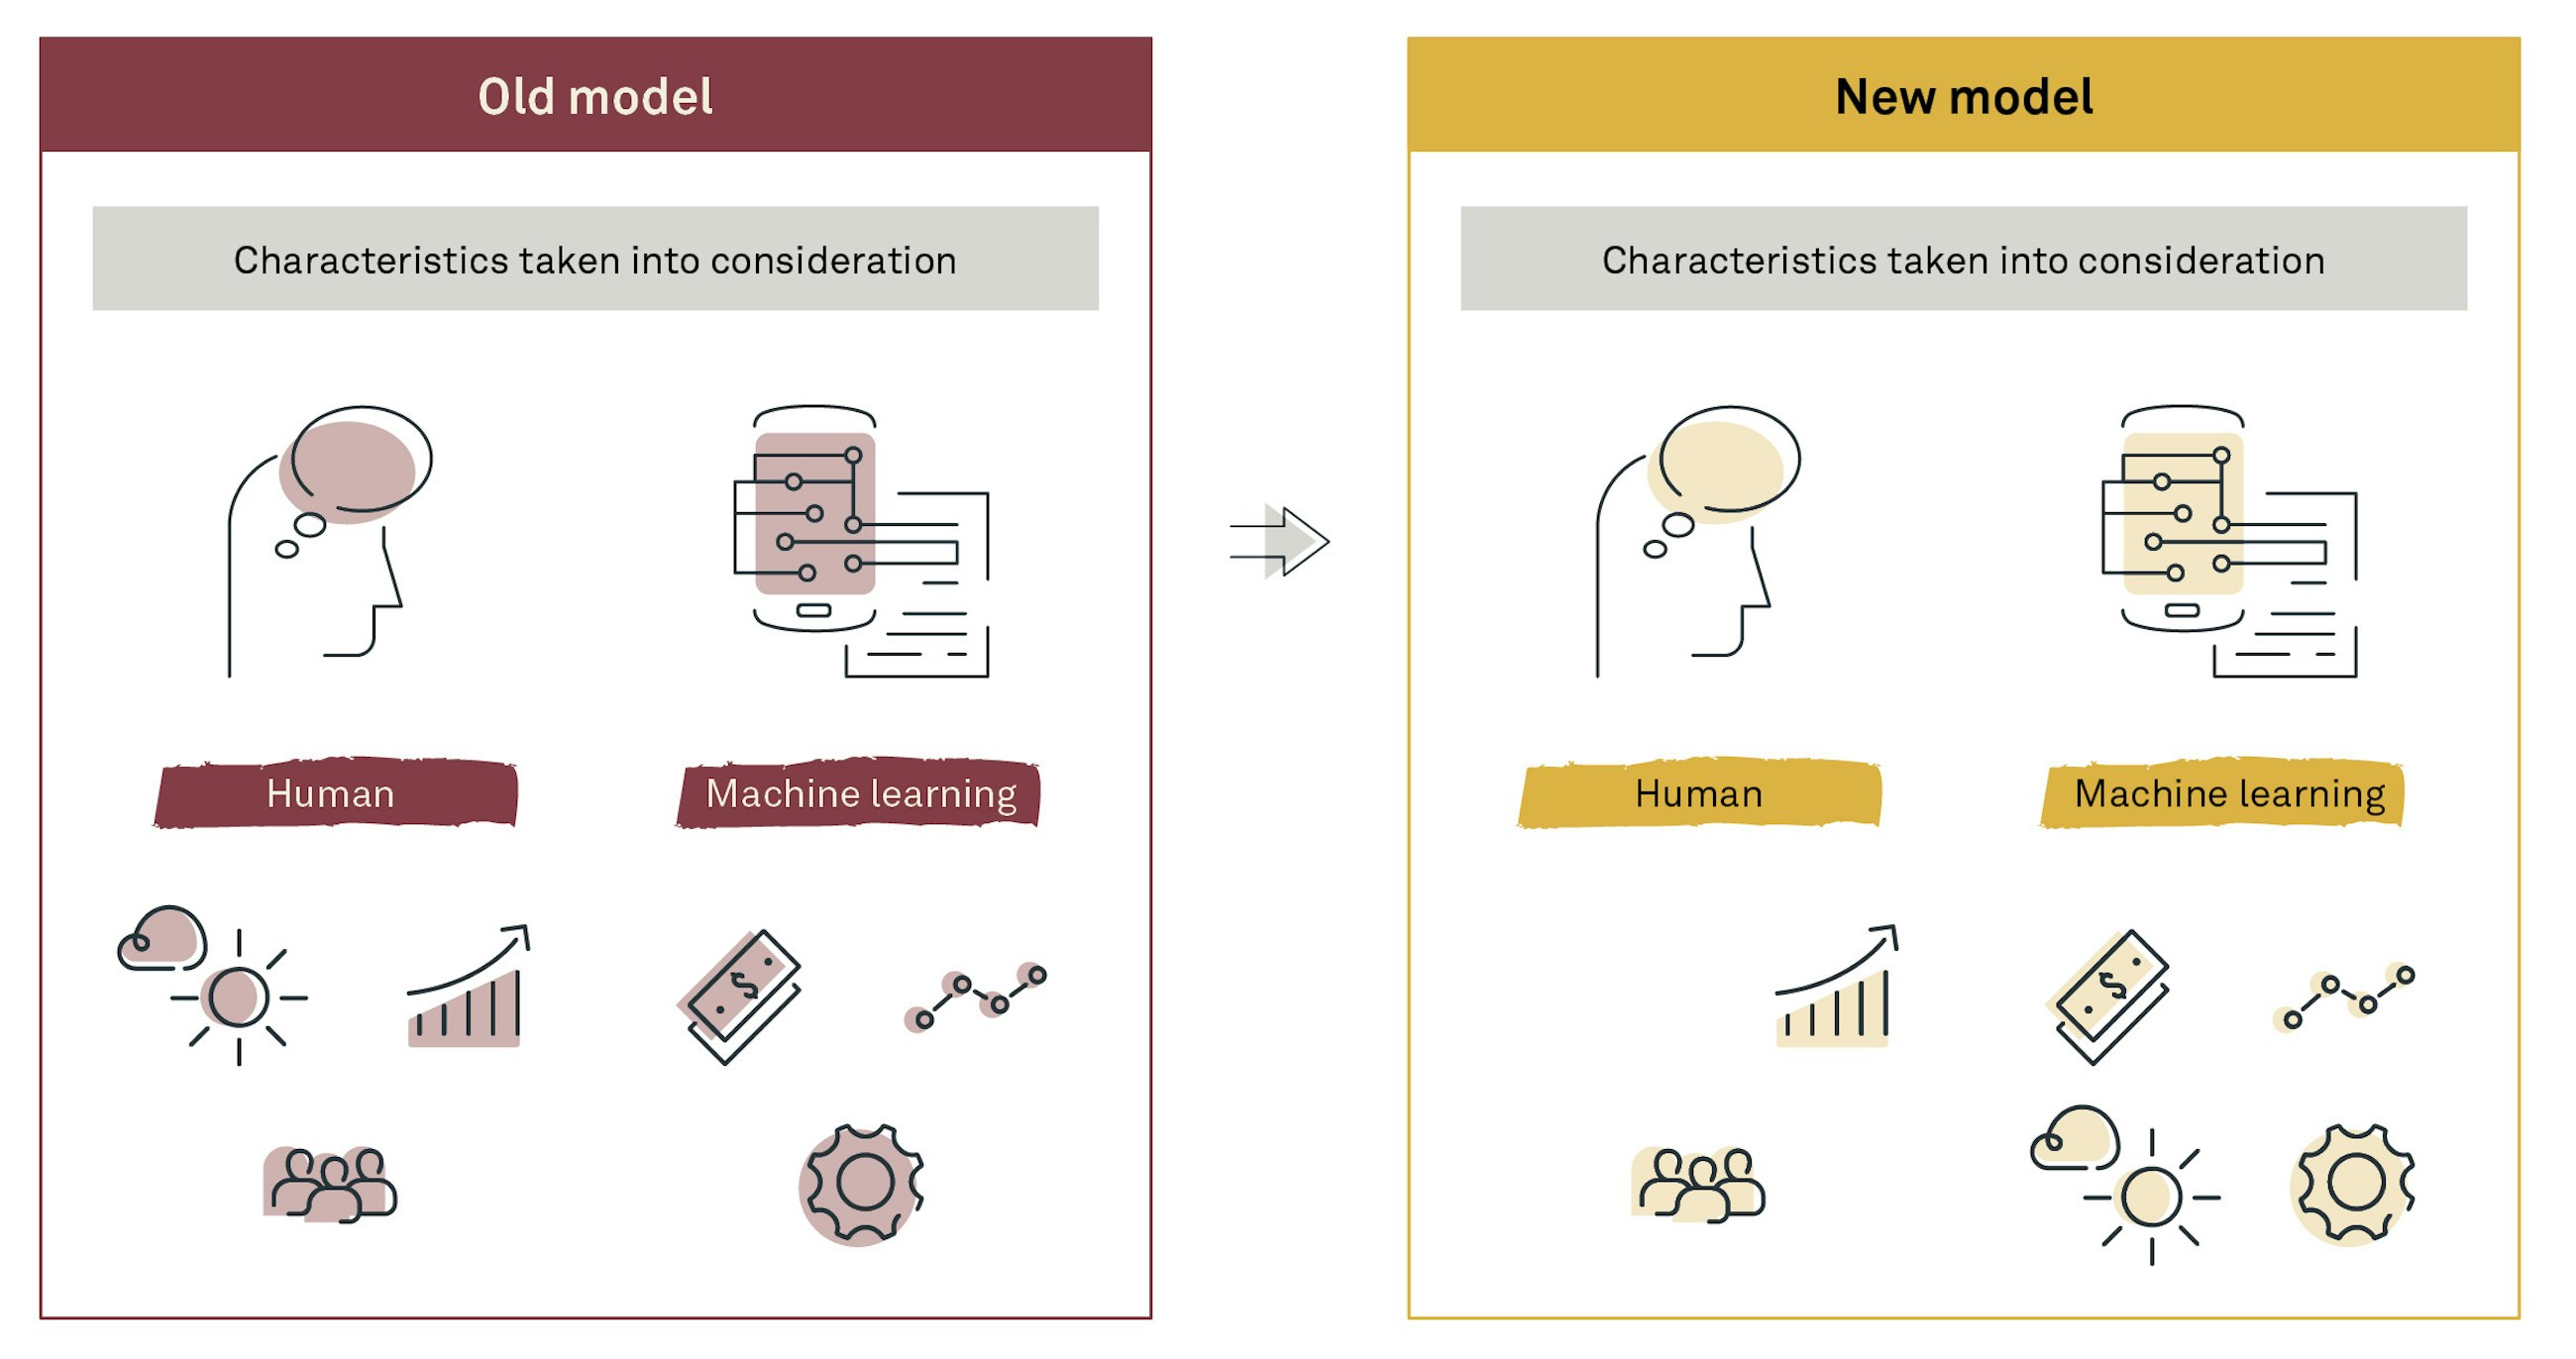
When implementing a new machine learning algorithm, it is important that you test and communicate in which areas the algorithm performs better than the previous model(s). This is vital, as those who enrich the forecast in the later phase need to change behaviour. Things that previously added value to the forecast and were not considered could potentially be part of the new machine learning model now.
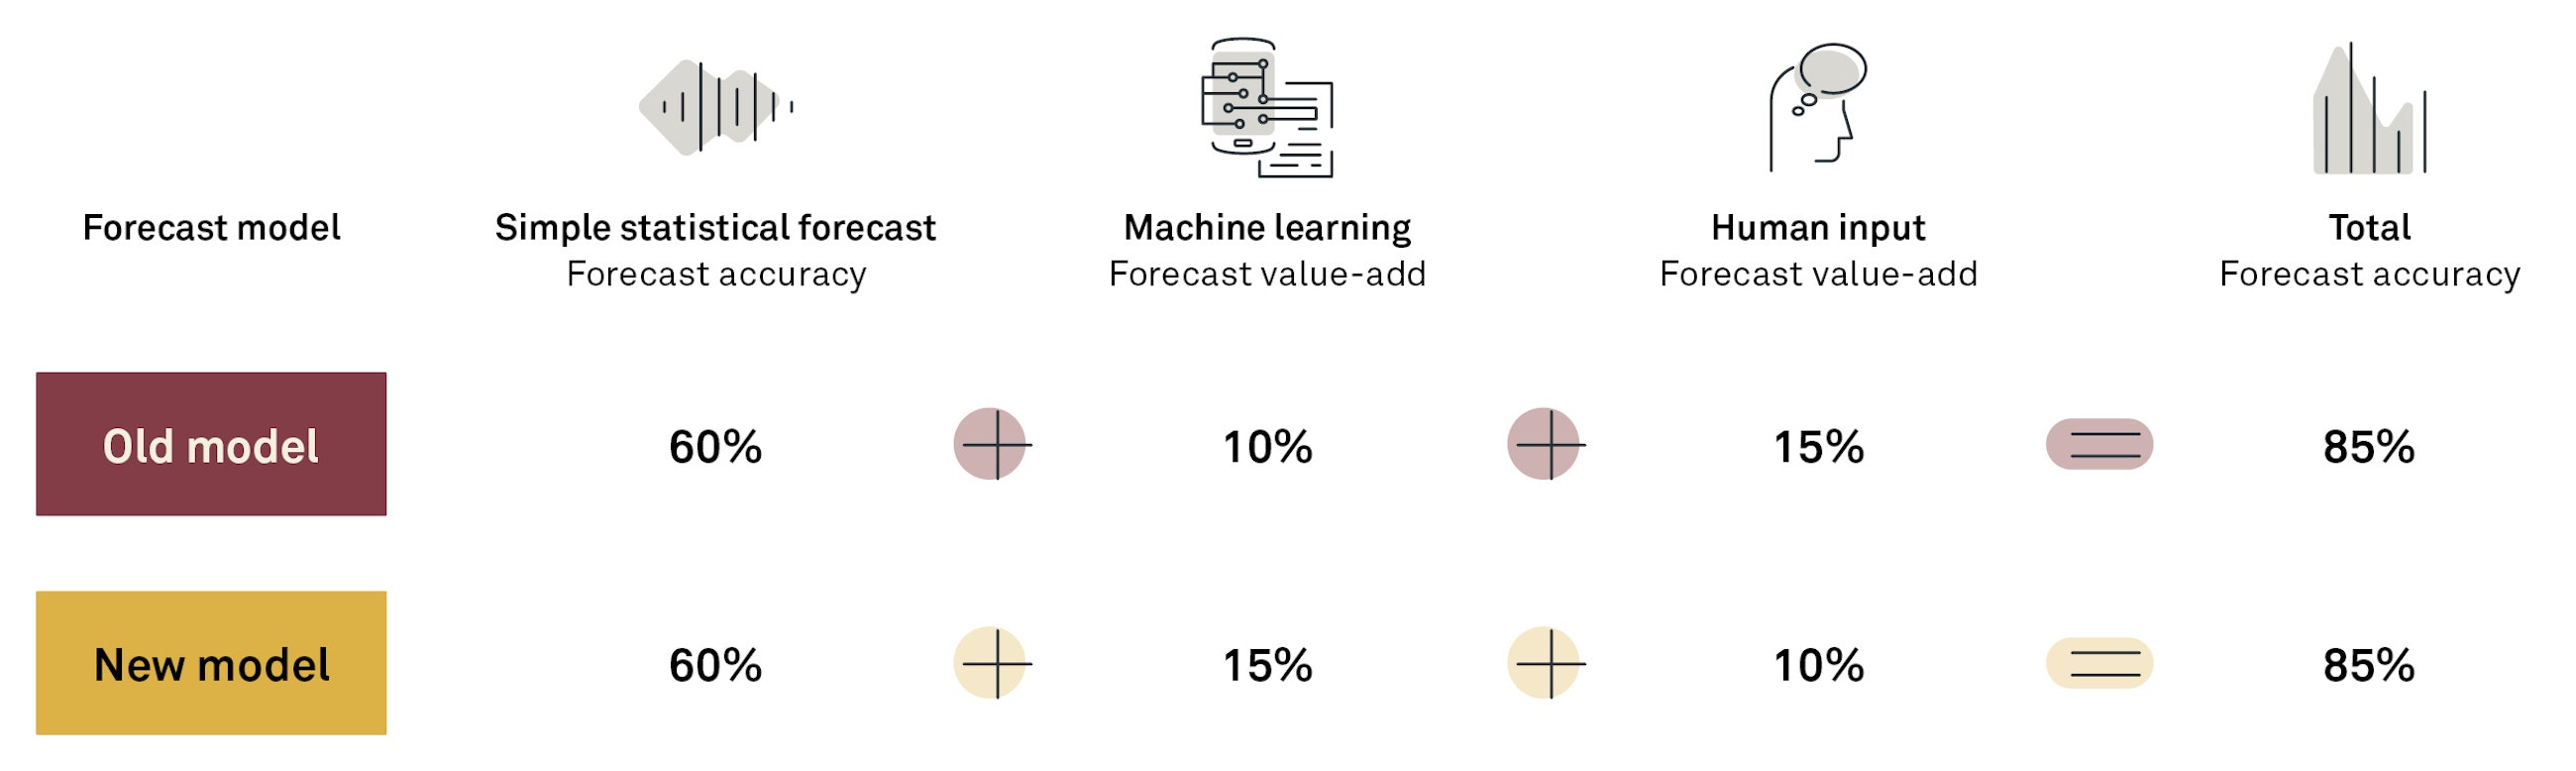
This also means that segments where the planner previously was adding a lot of value can now be handled with the improved algorithm. This means that after the deployment of a new algorithm, you should monitor the value-add closely to ensure that the behavioural change is also successfully implemented. Otherwise, you risk not improving your overall forecast accuracy and the planners spending the same amount of time, where the only difference is a shift in the forecast value-add categories.
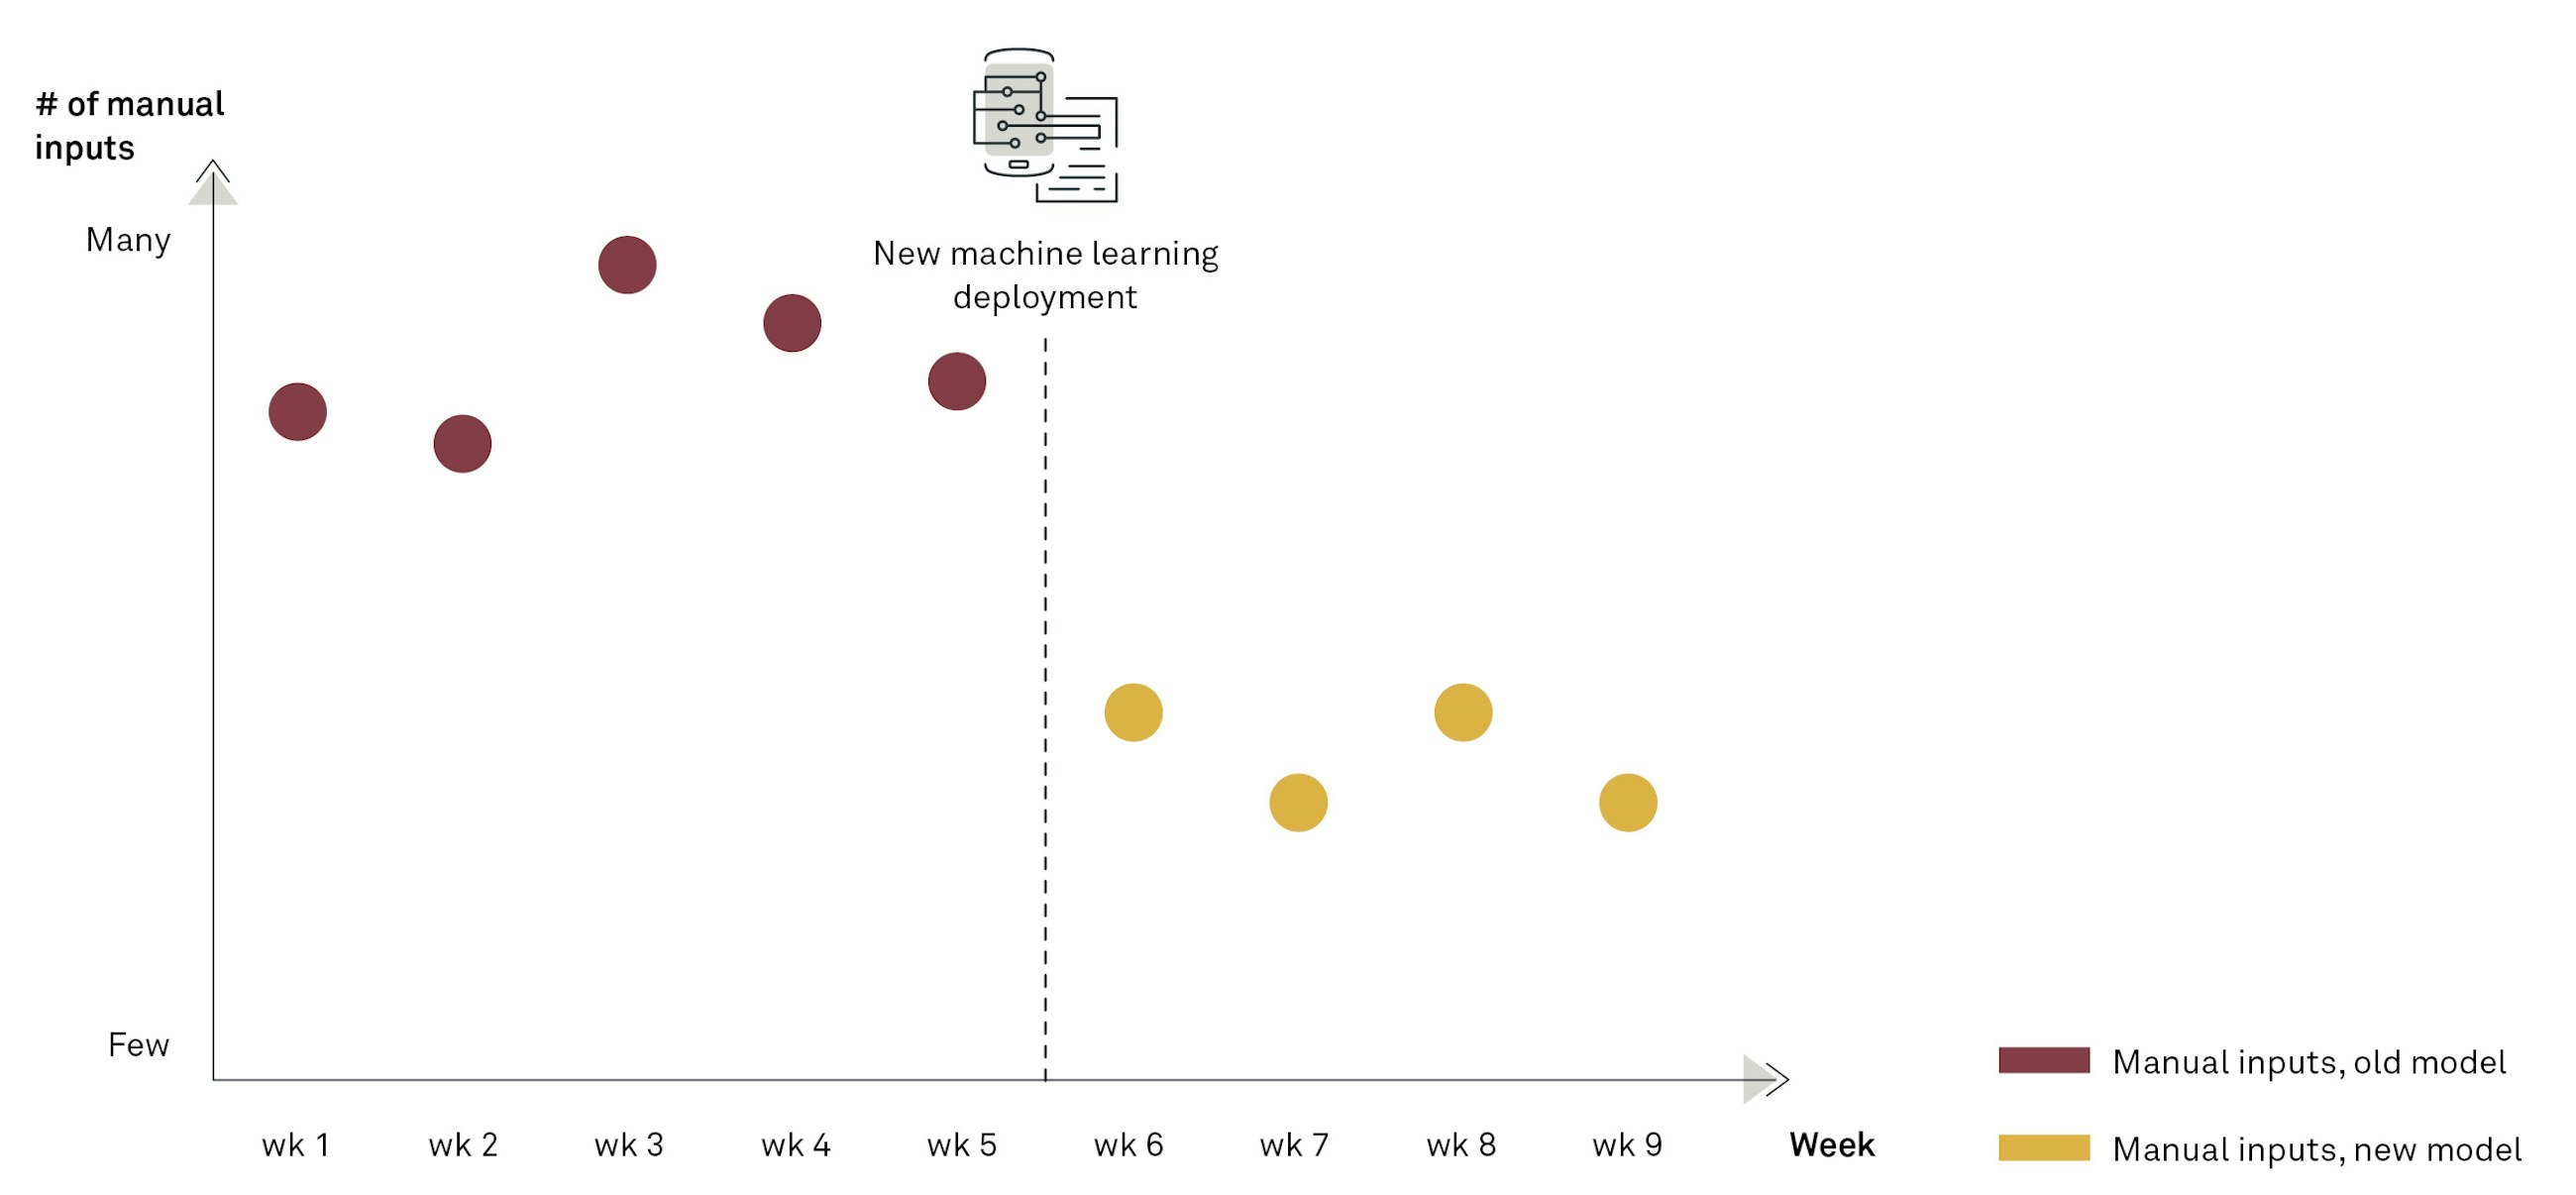
You should use this tracker to ensure that the planners can get to the same overall forecast accuracy with less inputs and incorporate the results from the new machine learning algorithm into their ways of working.
Tracking the forecast value-add and number of inputs is a delicate matter. We advise that you track it on a level where it adds value to understand the improvement potentials of the process. A natural next step for some could be to measure the incremental value-add per planner – however, we advise against that. If you monitor on a planner level and use it in planner evaluation, you risk introducing a suboptimal process step and incentives to harm the other process inputs to improve the personal forecast value-add.
As in all other areas of supply chain management, it is important that you have a holistic approach and ensure that measurements and KPIs support the overall process and ability to deliver goods on time, in full.