Article
Five selected features of the 2202 upgrade of SAP IBP

Article
Read more
10 March 2022
Five selected features of the 2202 upgrade of SAP IBP
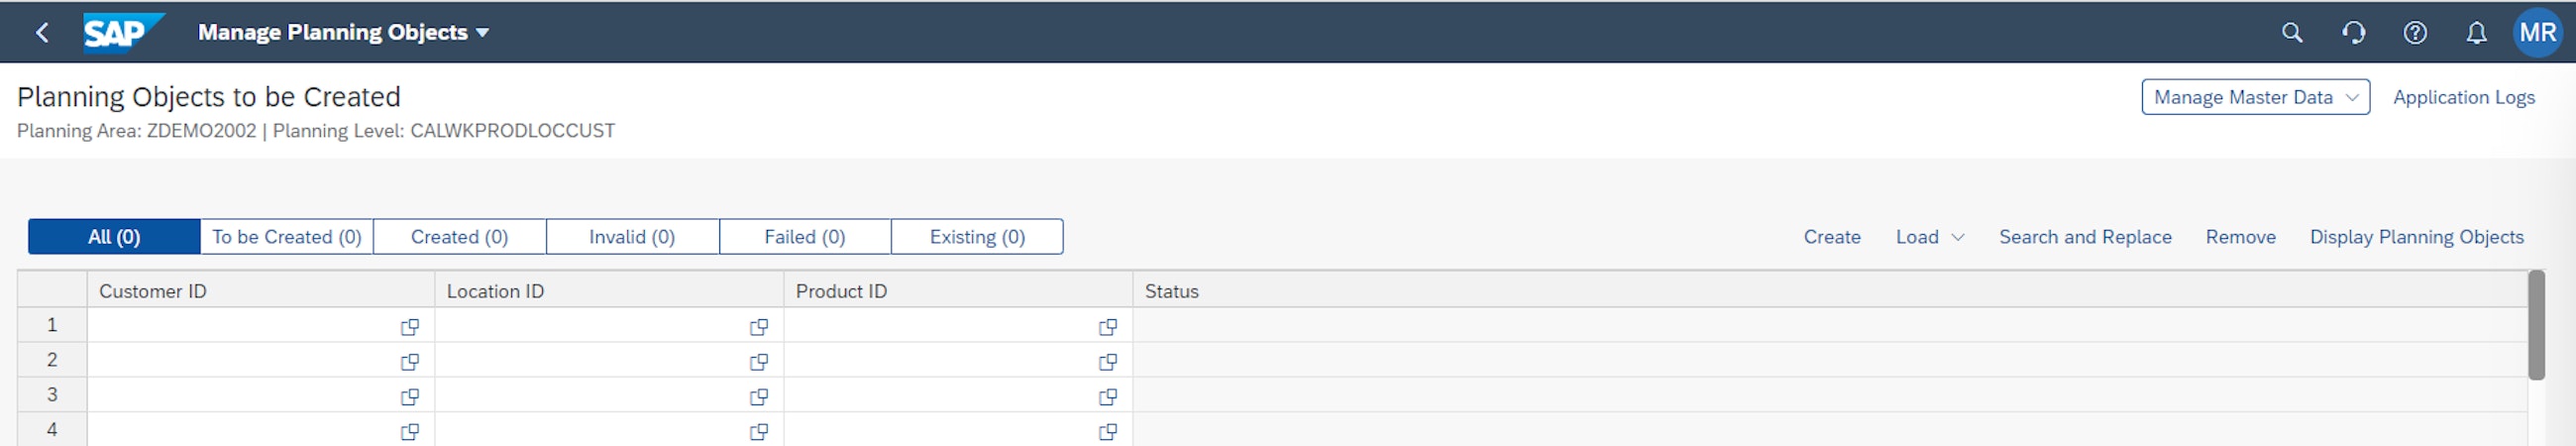
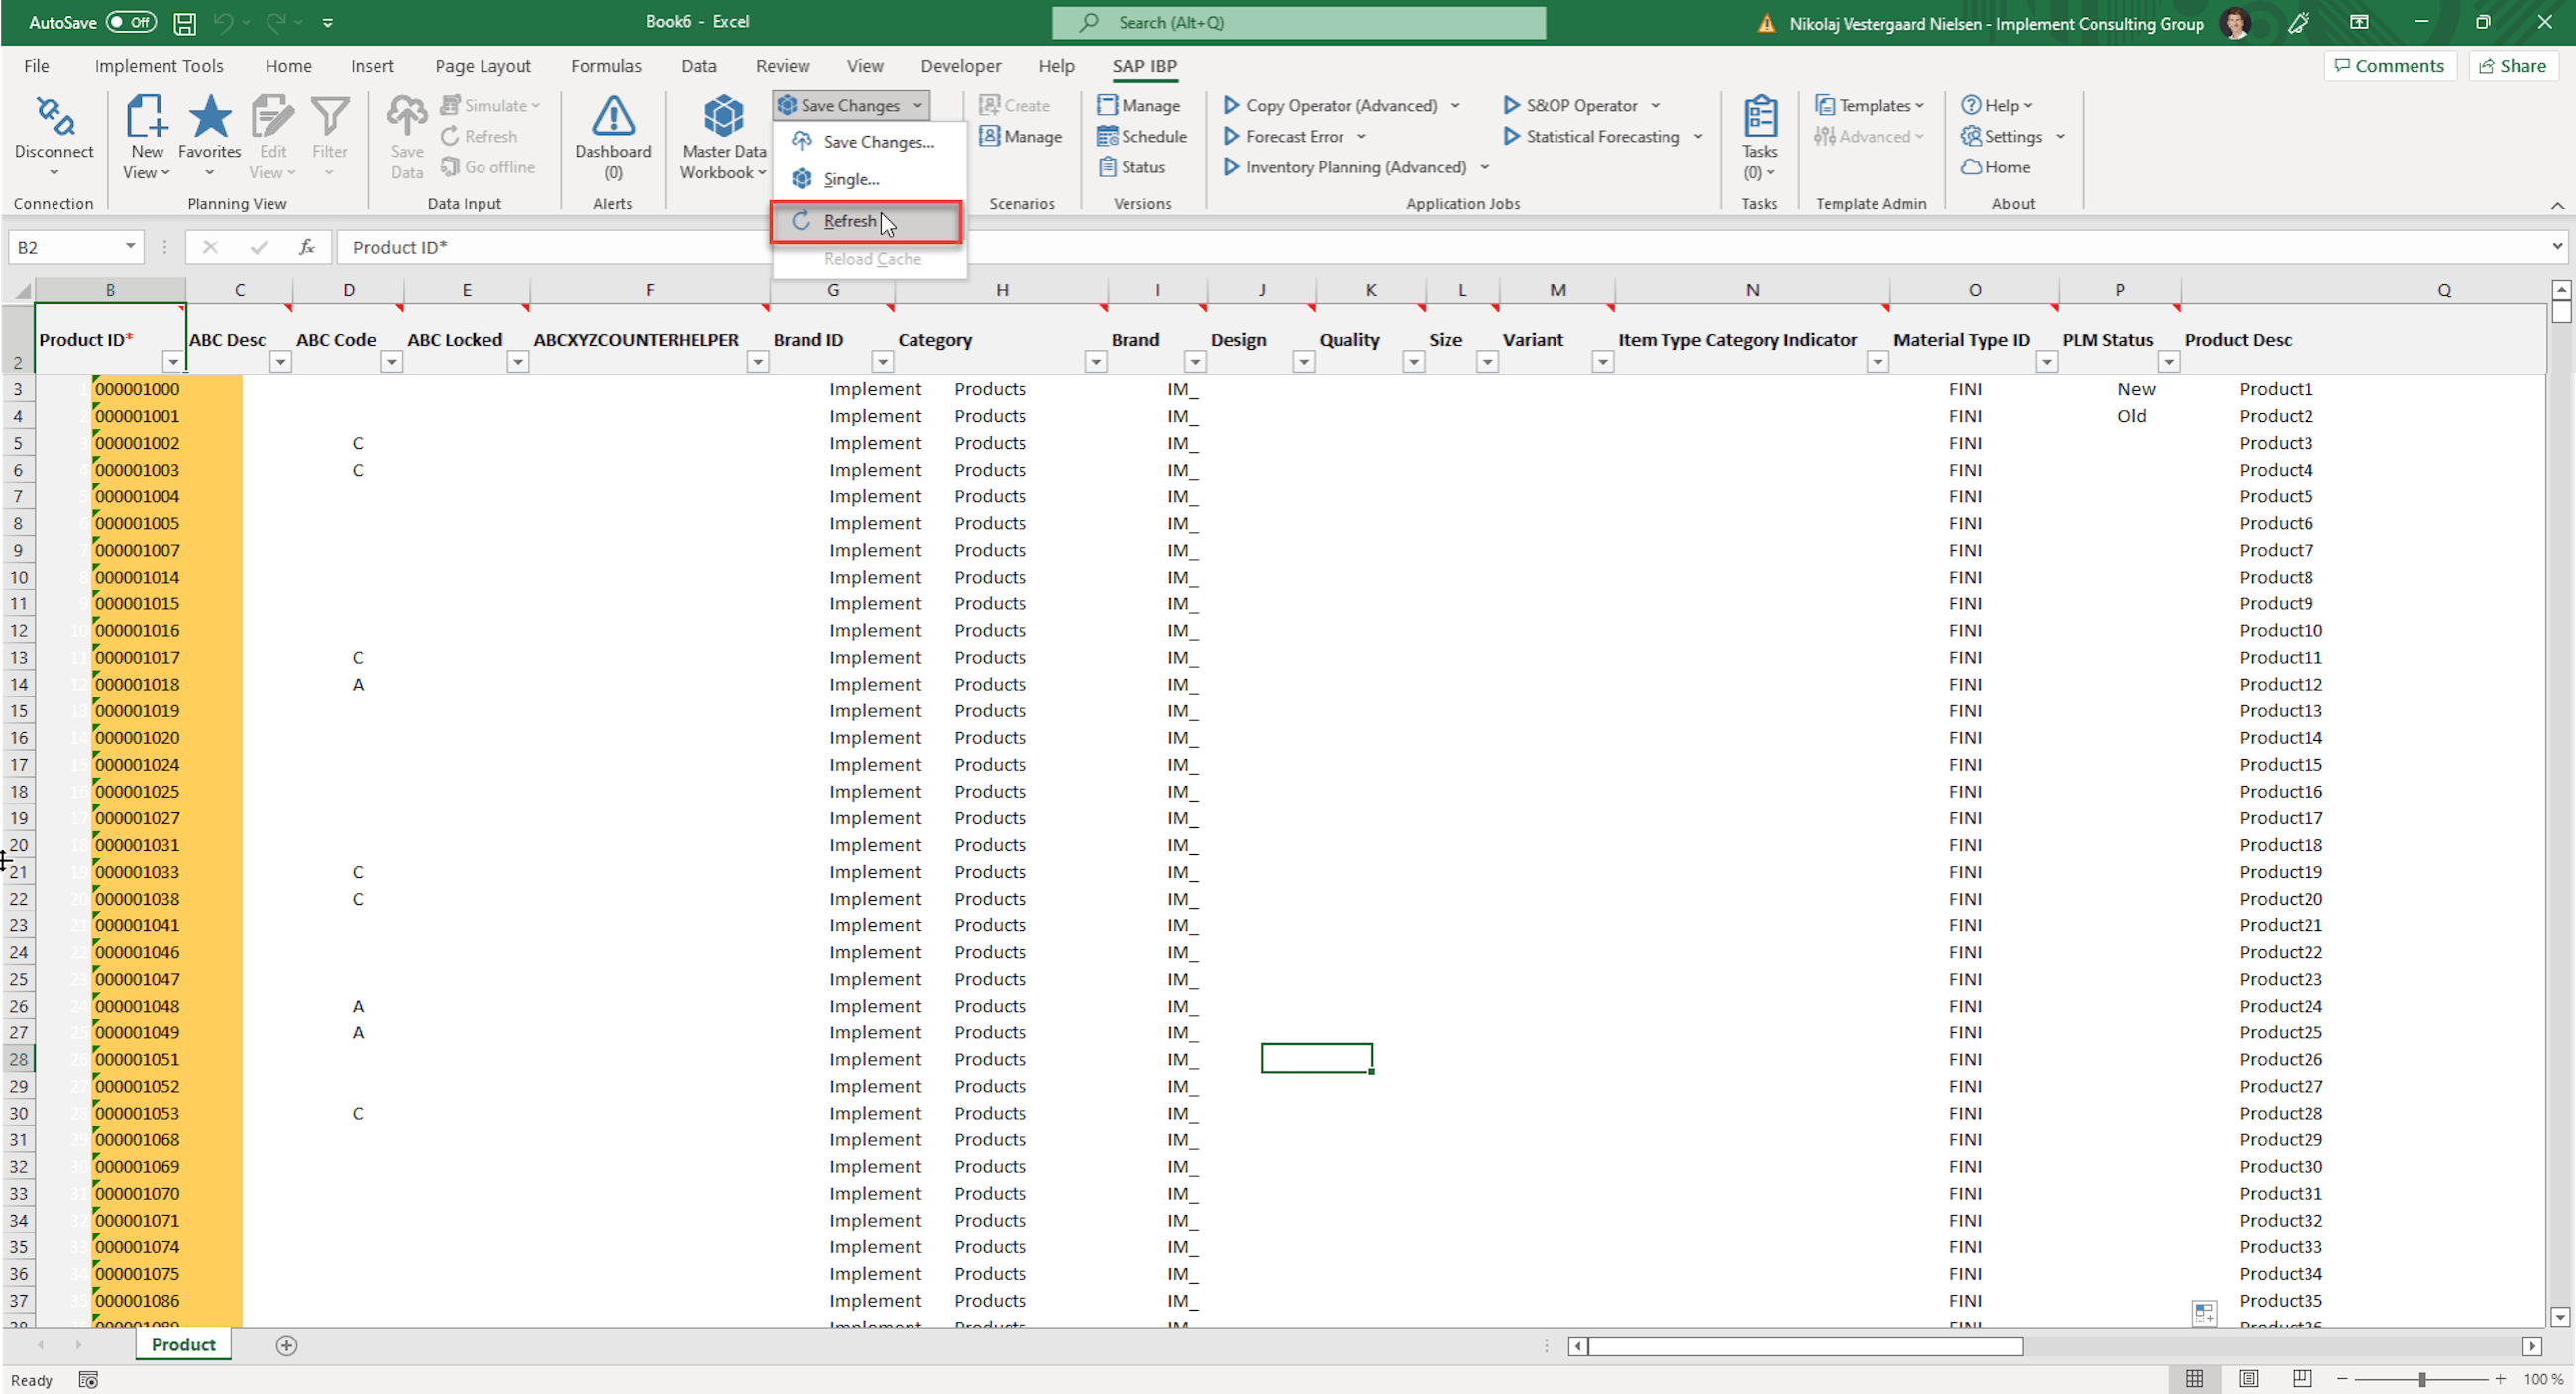
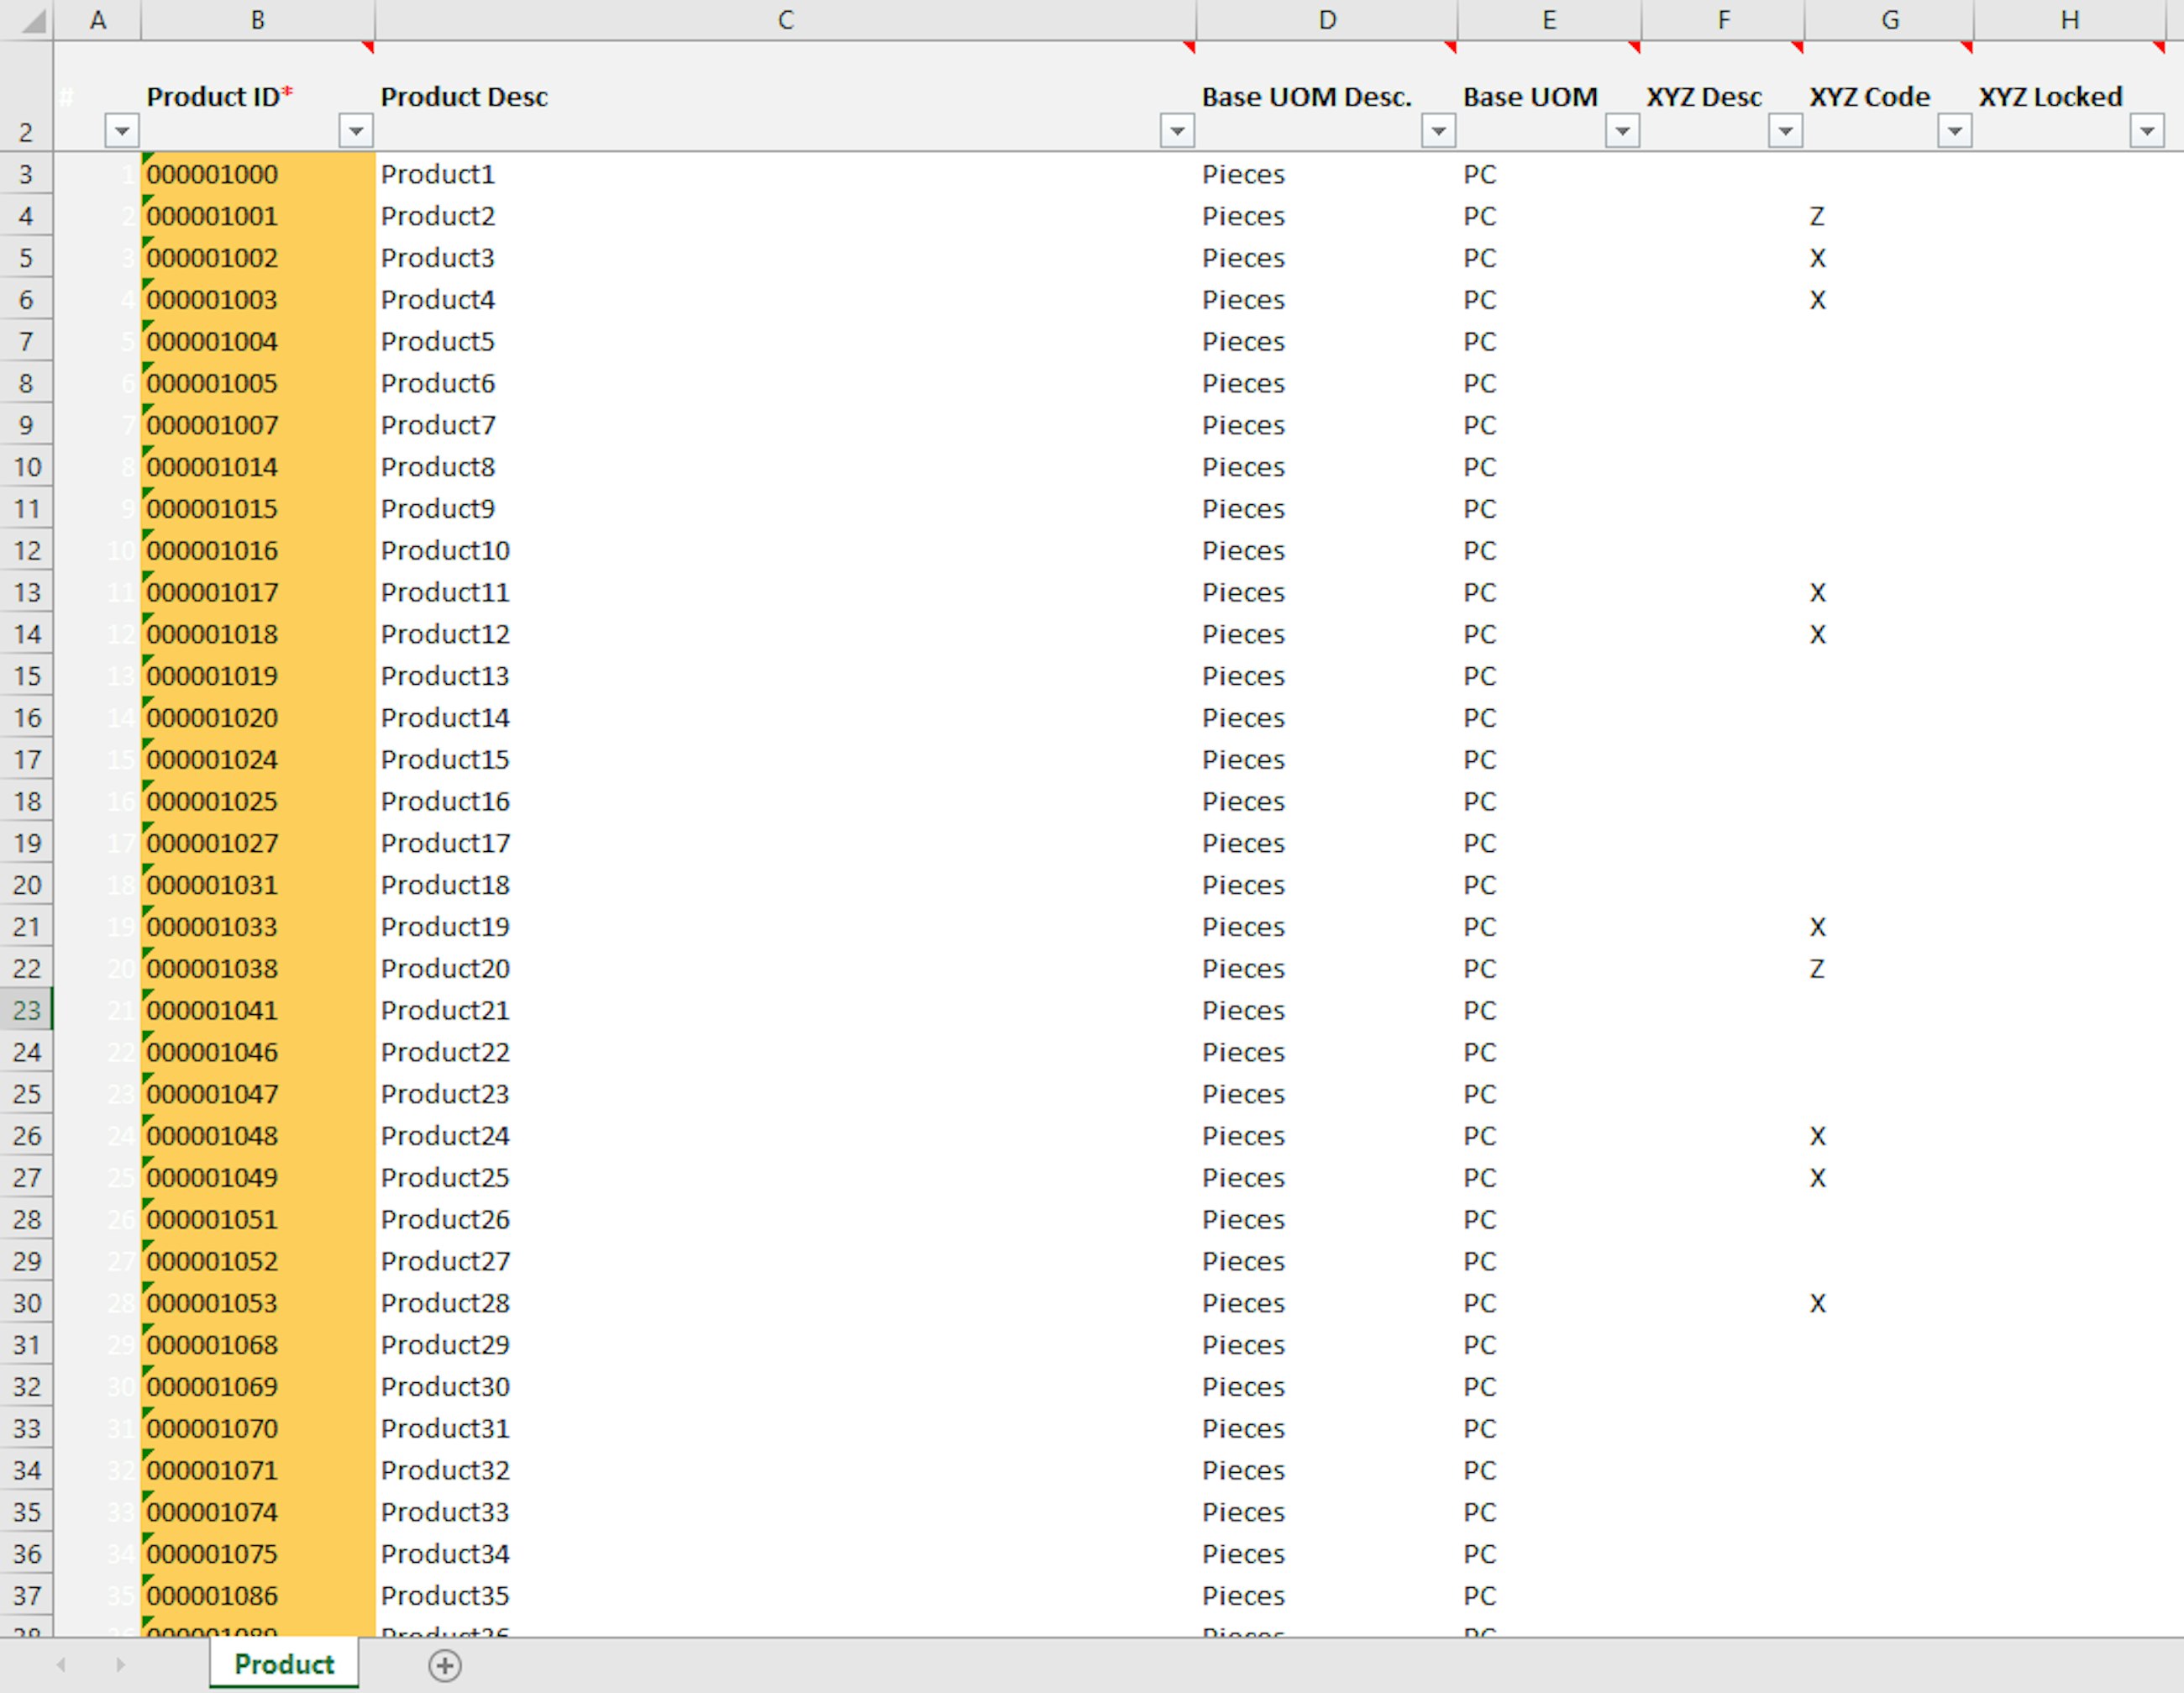
SAP is continuing to make life easier for people who do maintenance of transaction data in SAP IBP. With the new 2202 release, SAP has made enhancements to their Manage Planning Objects feature, which will make the ad hoc maintenance of planning objects even easier. As we have previously written about in “Five selected Features of the 2108 SAP IBP Upgrade”, we have seen the potential of this functionality and the simplicity it creates when managing planning objects. However, with the new release, SAP has added even more cool features, and in this section, we will elaborate on some of them.
One of the best enhancements that SAP has released for this subject is the manual creation of planning objects. You can now create planning objects in a separate view by choosing the existing master data attributes as the roots of the planning level and then create new objects. Just like in an Excel spreadsheet, you can copy and paste entries when creating new planning objects, and the new feature even offers valuable help for filling in values of combinations as well as checks if attributes and attribute combinations are valid.
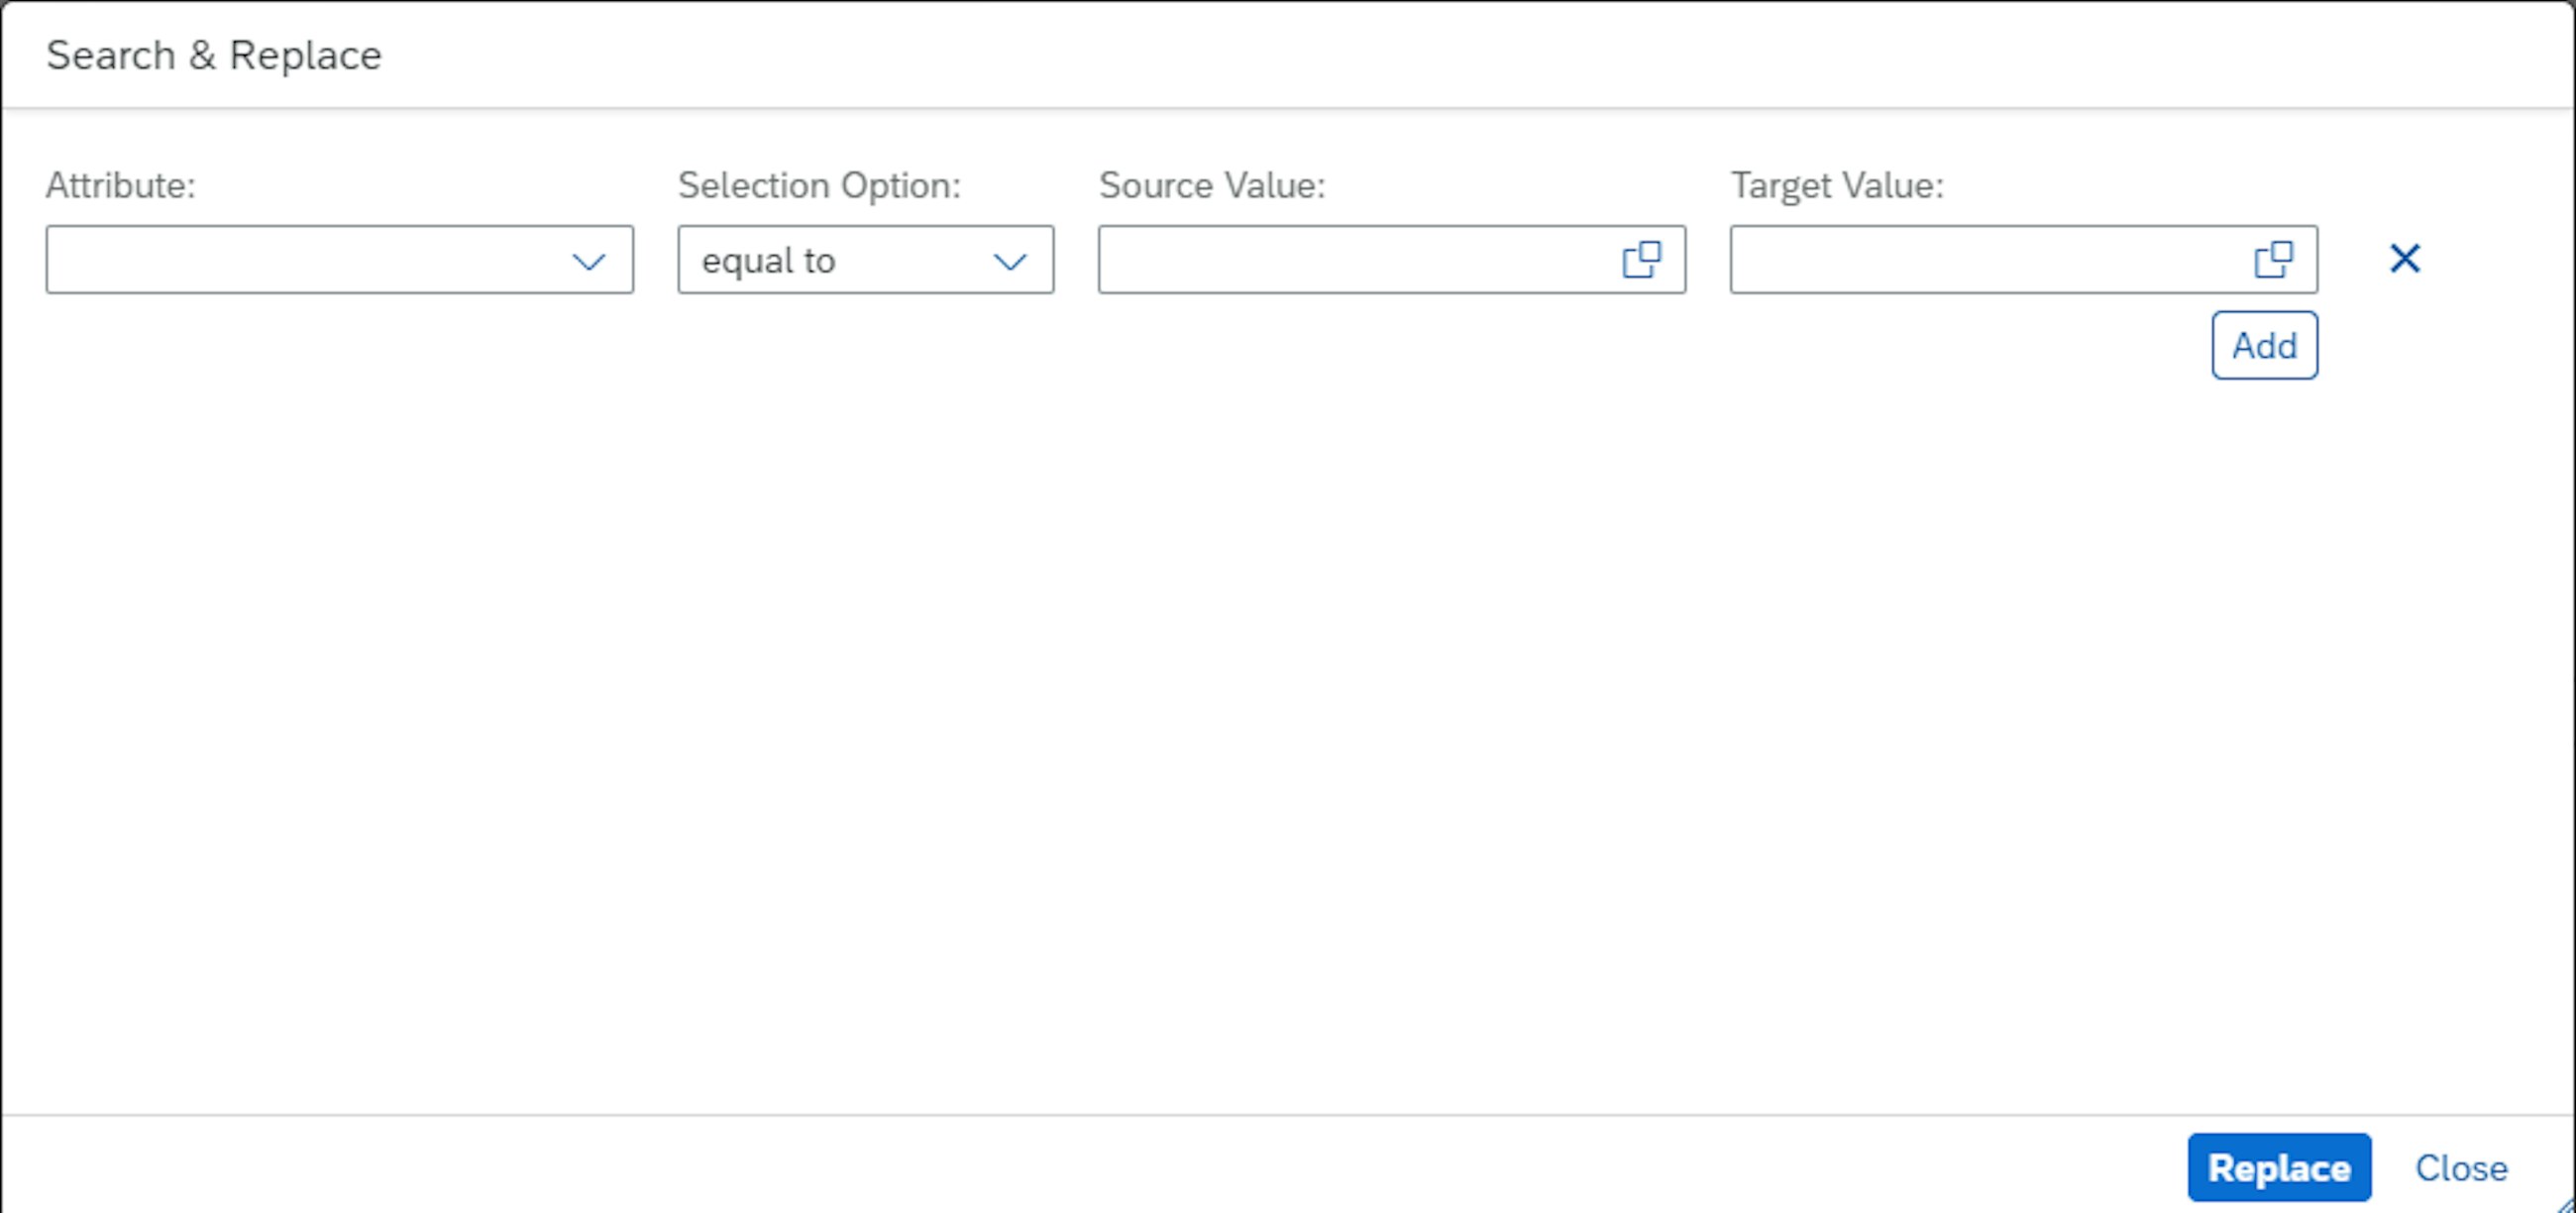
Another cool element is the search-and-replace function, where you can search for attribute values and combinations and do a replacement of these. Furthermore, you now have the ability to filter in the list of planning objects, e.g. filter by records that have errors in them and then quickly resolve these errors.
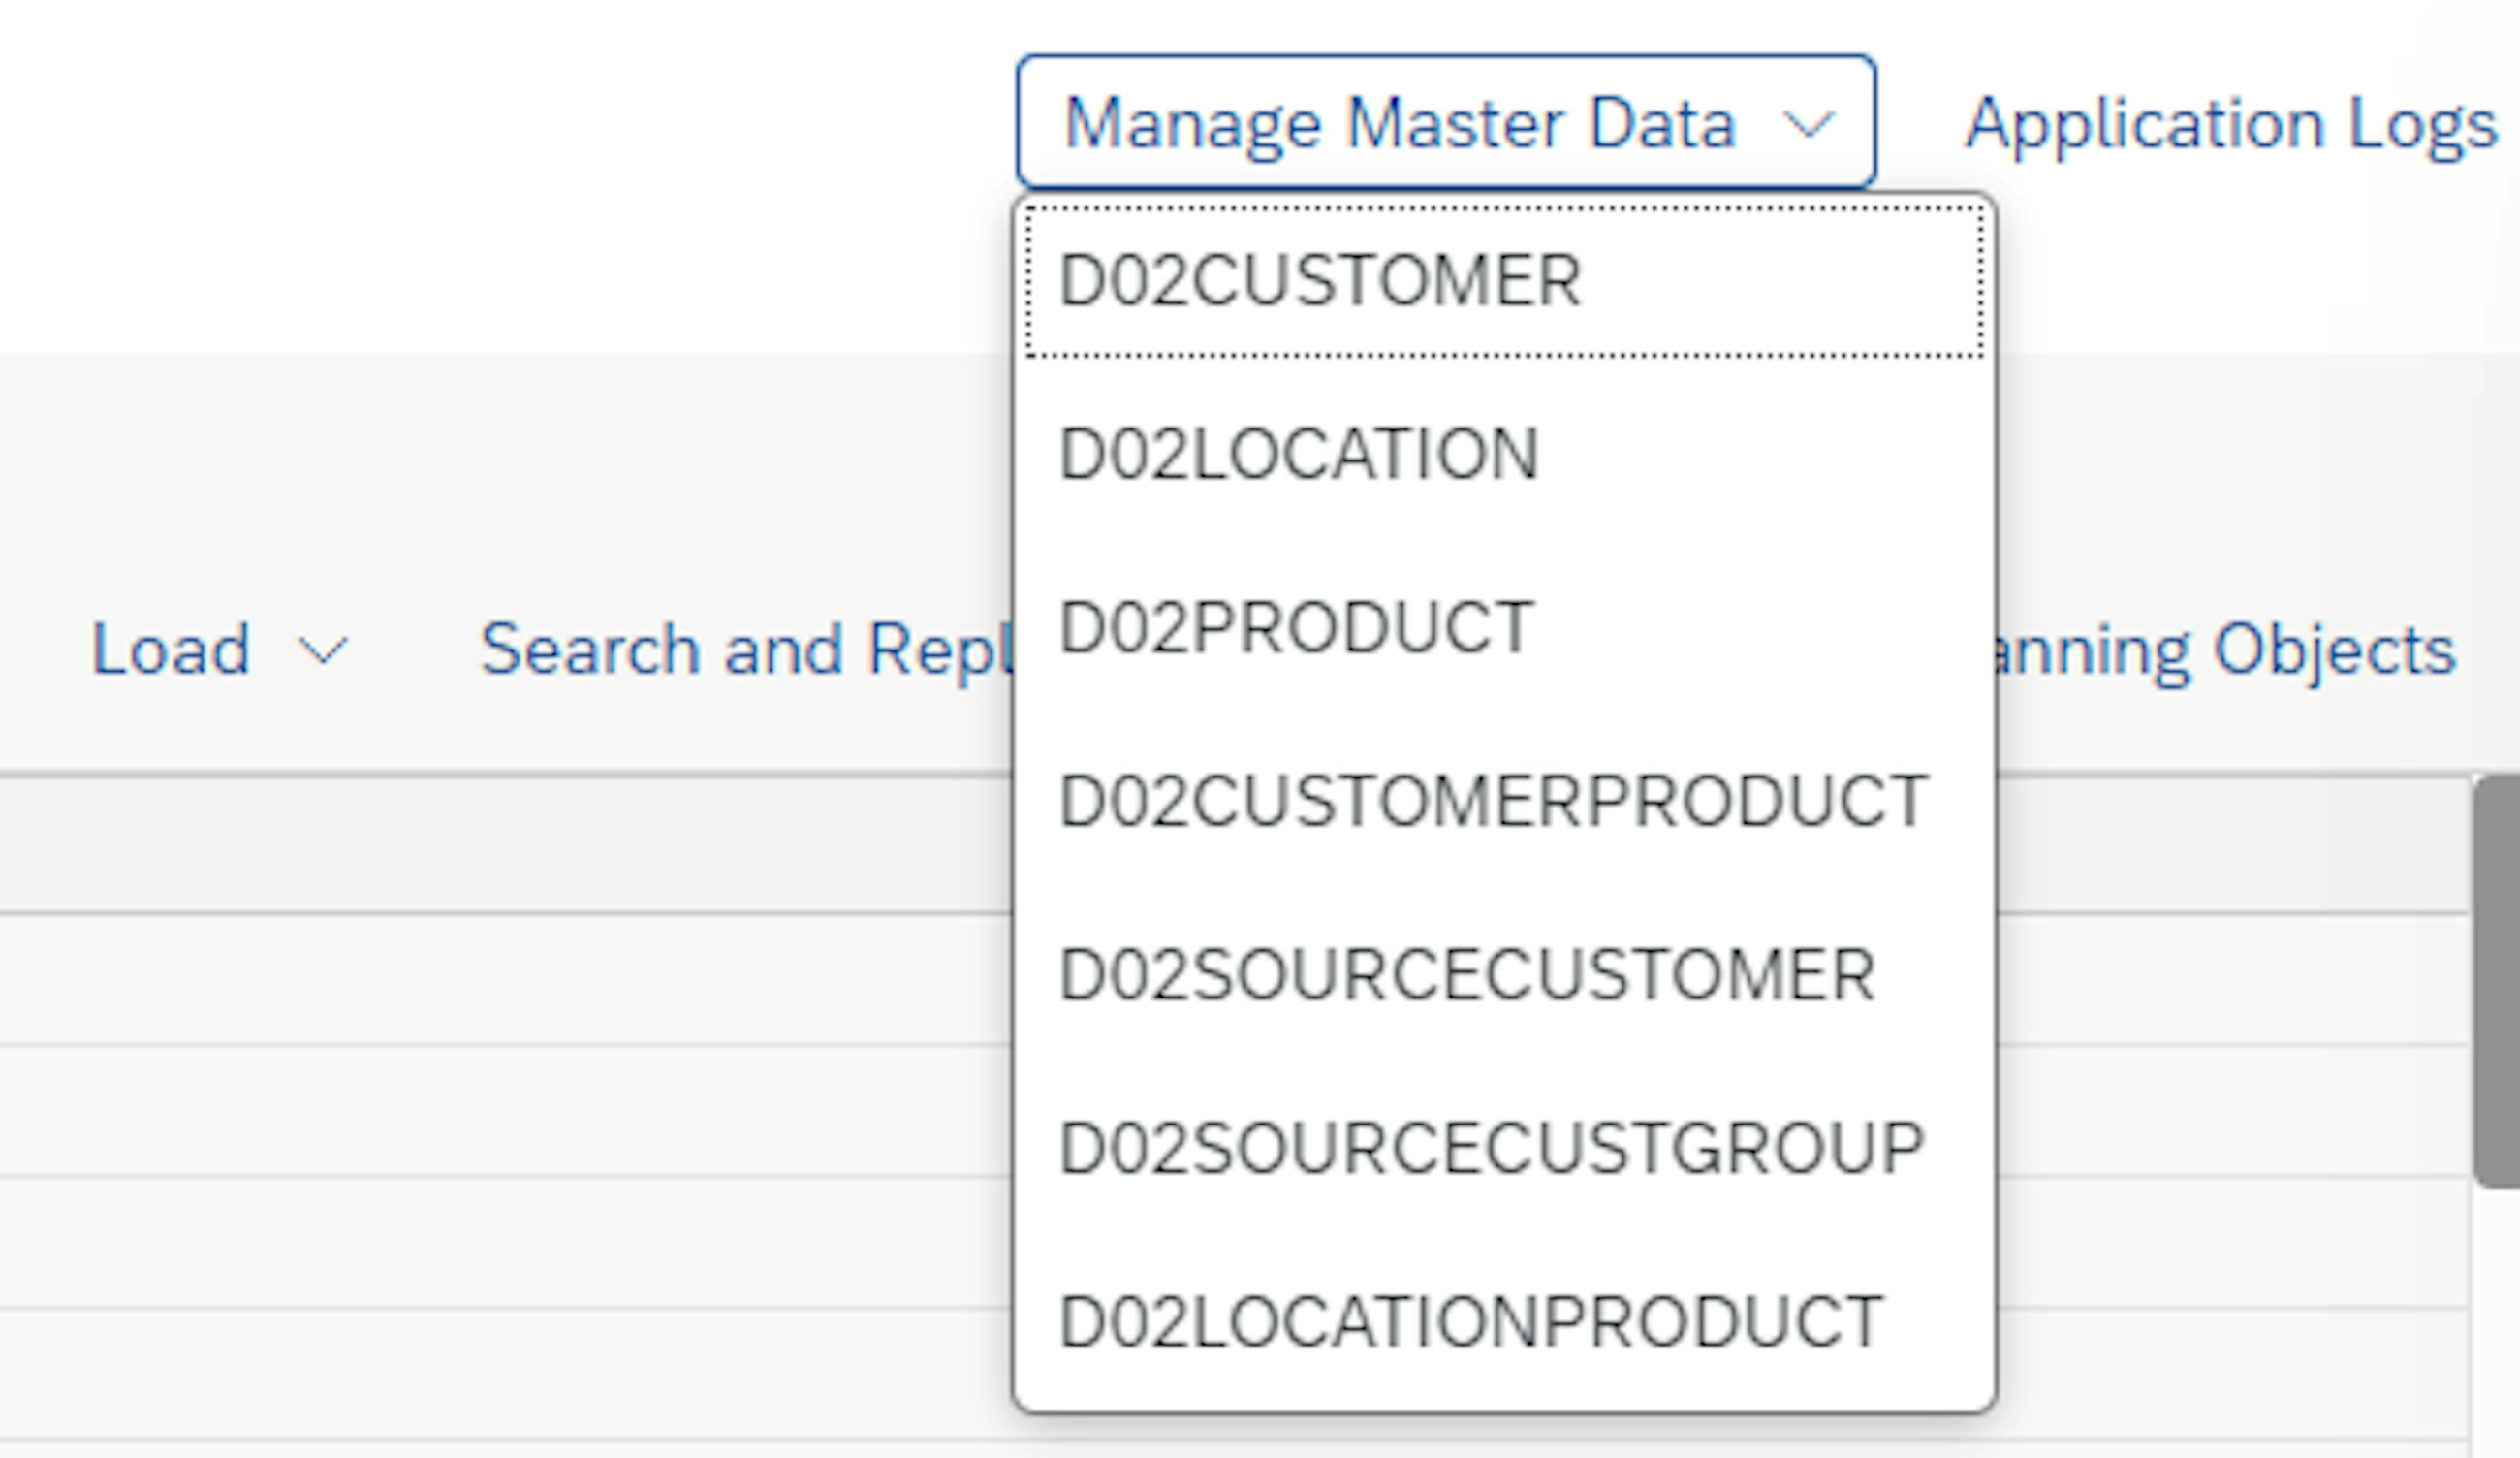
You are now able to load planning objects from existing master data types and attributes. When doing this, you can limit the load of data by using a selection criterion to filter out data that you do not want to be loaded. If you along the process of manually creating a planning object realise that you are missing an attribute, then you can navigate to the “Manage Master Data” app and work on the master data before adding the planning object.
At last, the new feature enables you to see who has created the planning object and by whom it has been changed and when. This element allows you to identify if undesired planning objects are created by a specific user and then train them in the correct method for creating planning objects.
Some of the key challenges for especially FMCG companies are how to handle phase-in and phase-out products in the planning processes. If the products are not included in the plans there is a risk that these will go out of stock or driving costs and if they products are not phased out correctly it will cause dead stock. Typical considerations for planners when they work with product portfolio are:
The challenge for companies introducing new products is often when introducing the new products all customers want to have full shelves. This will cause a big increase in demand the first weeks of the products release. After this peak the demand will probably drop drastically, and from then on, represent a more “true” demand since it is not biased by retailers filling up shelves, but rather consumers actually purchasing the product. This is often a pain point for planners as they need to pay extra attention to these new products which often is a manual and time-consuming task.
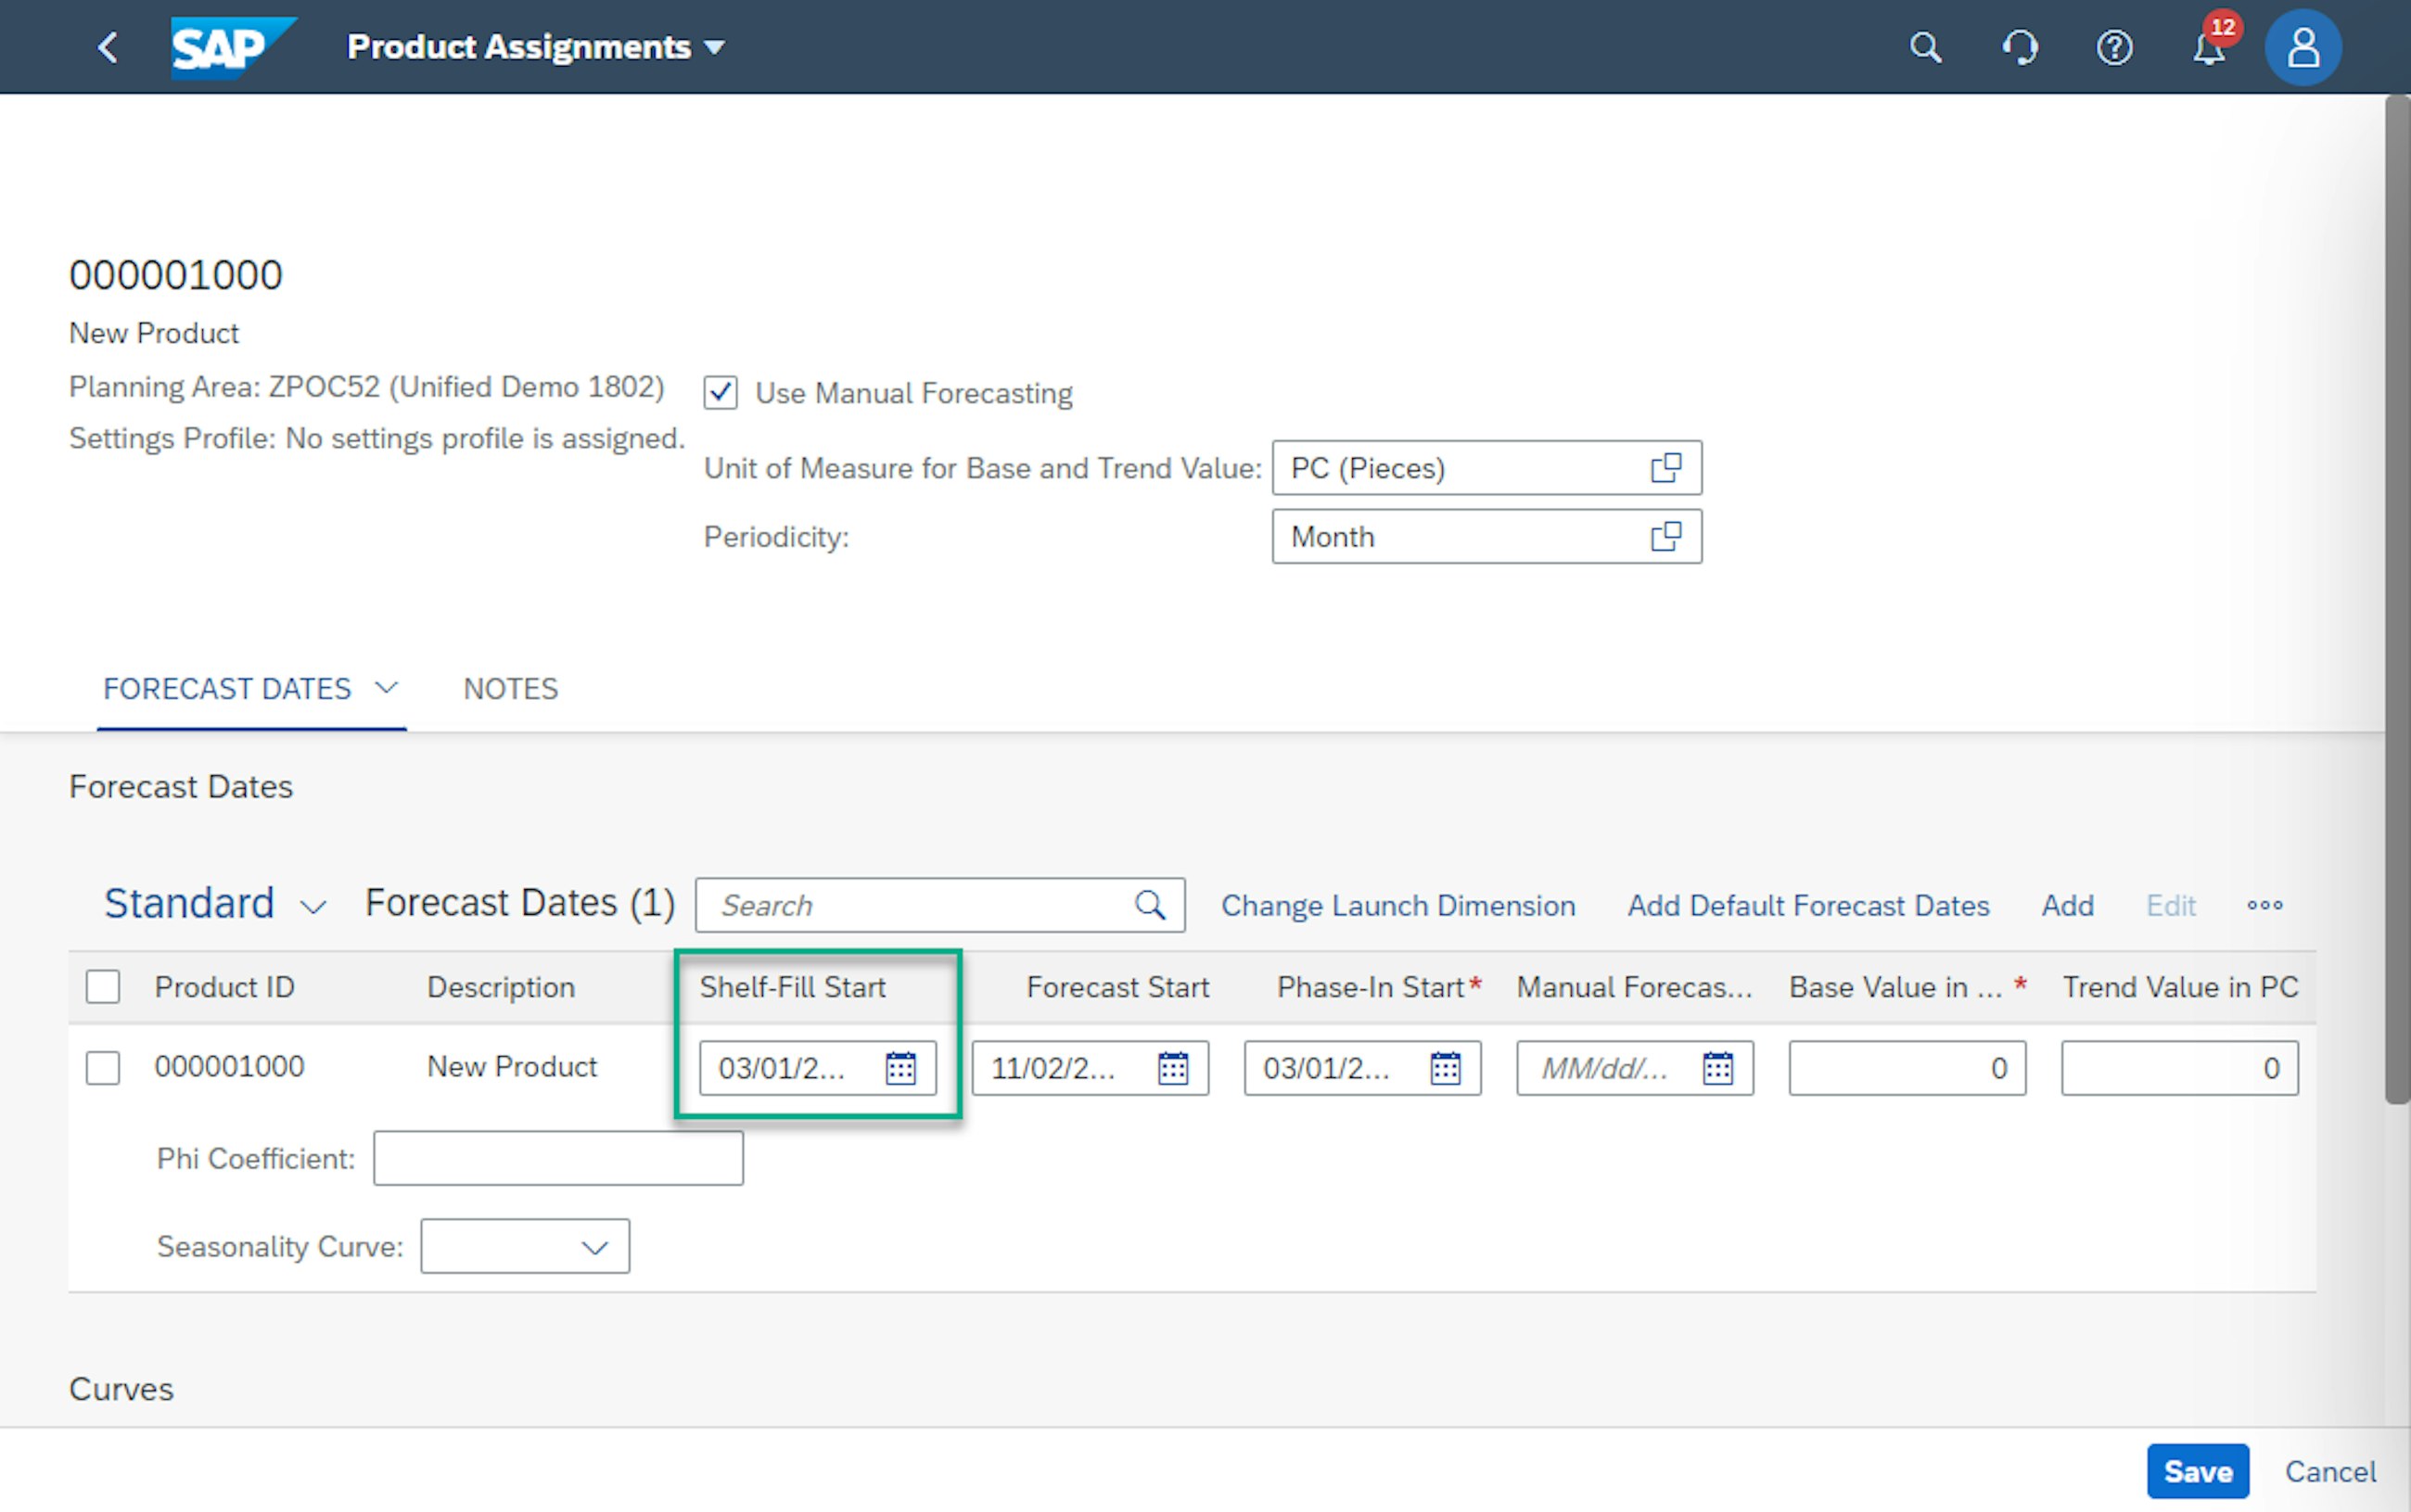
With the new release SAP IBP now support product life-cycle management that includes shelf-fill start, shelf-fill value, and shelf-fill length for the new products. This shelf-fill information allows companies to ensure that contractual obligations are accounted for in your planning. This can be the case if agreements with retailers or other customers state that sufficient product quantities must be on stock before product launch. In addition, you can define the number of periods during which you want to ensure product availability on the shelf.
The new settings can be added in the manual forecasting approach for reference products. The manual forecasting approach is useful if reference products are not available for the new products being launched or in cases where the company’s business processes require planners to create a manual forecast, e.g. based on planning experience, internal ways of working, supporting systems etc. Using the new manual forecasting functionality, planners can create a forecast for the new products that is 100% based on manual input.
One of the strengths of SAP IBP is the intuitive Excel front end, which is familiar to most planners the first time they see it. In the previous releases, SAP has enhanced the web-based planning significantly with the introduction and upgrades of the Planners Workspace app. In this release, SAP offers upgrades to the Excel front end where new APIs can be used to enhance the planning view templates with VBA coding. This means that you can now build VBA macros that can help automate some of the manual steps in the planning processes.
Some of the use cases for the new APIs are:
https://github.com/SAP-samples/integrated-business-planning-excel-addin-vba-samples
To enable the new APIs, you need to change the value of the global configuration parameter EXCEL_PLANNING_VIEW_APIS in the parameter group PLAN_VIEW. In the following table, you can check which SAP IBP APIs are enabled if you set a specific value of the global configuration parameter EXCEL_PLANNING_VIEW_APIS. Three settings exist:
Samples for creating VBA coding in IBP can be found in the below link: http://help.sap.com/disclaimer?site=https://github.com/SAP-samples/integrated-business-planning-excel-addin-vba-samples
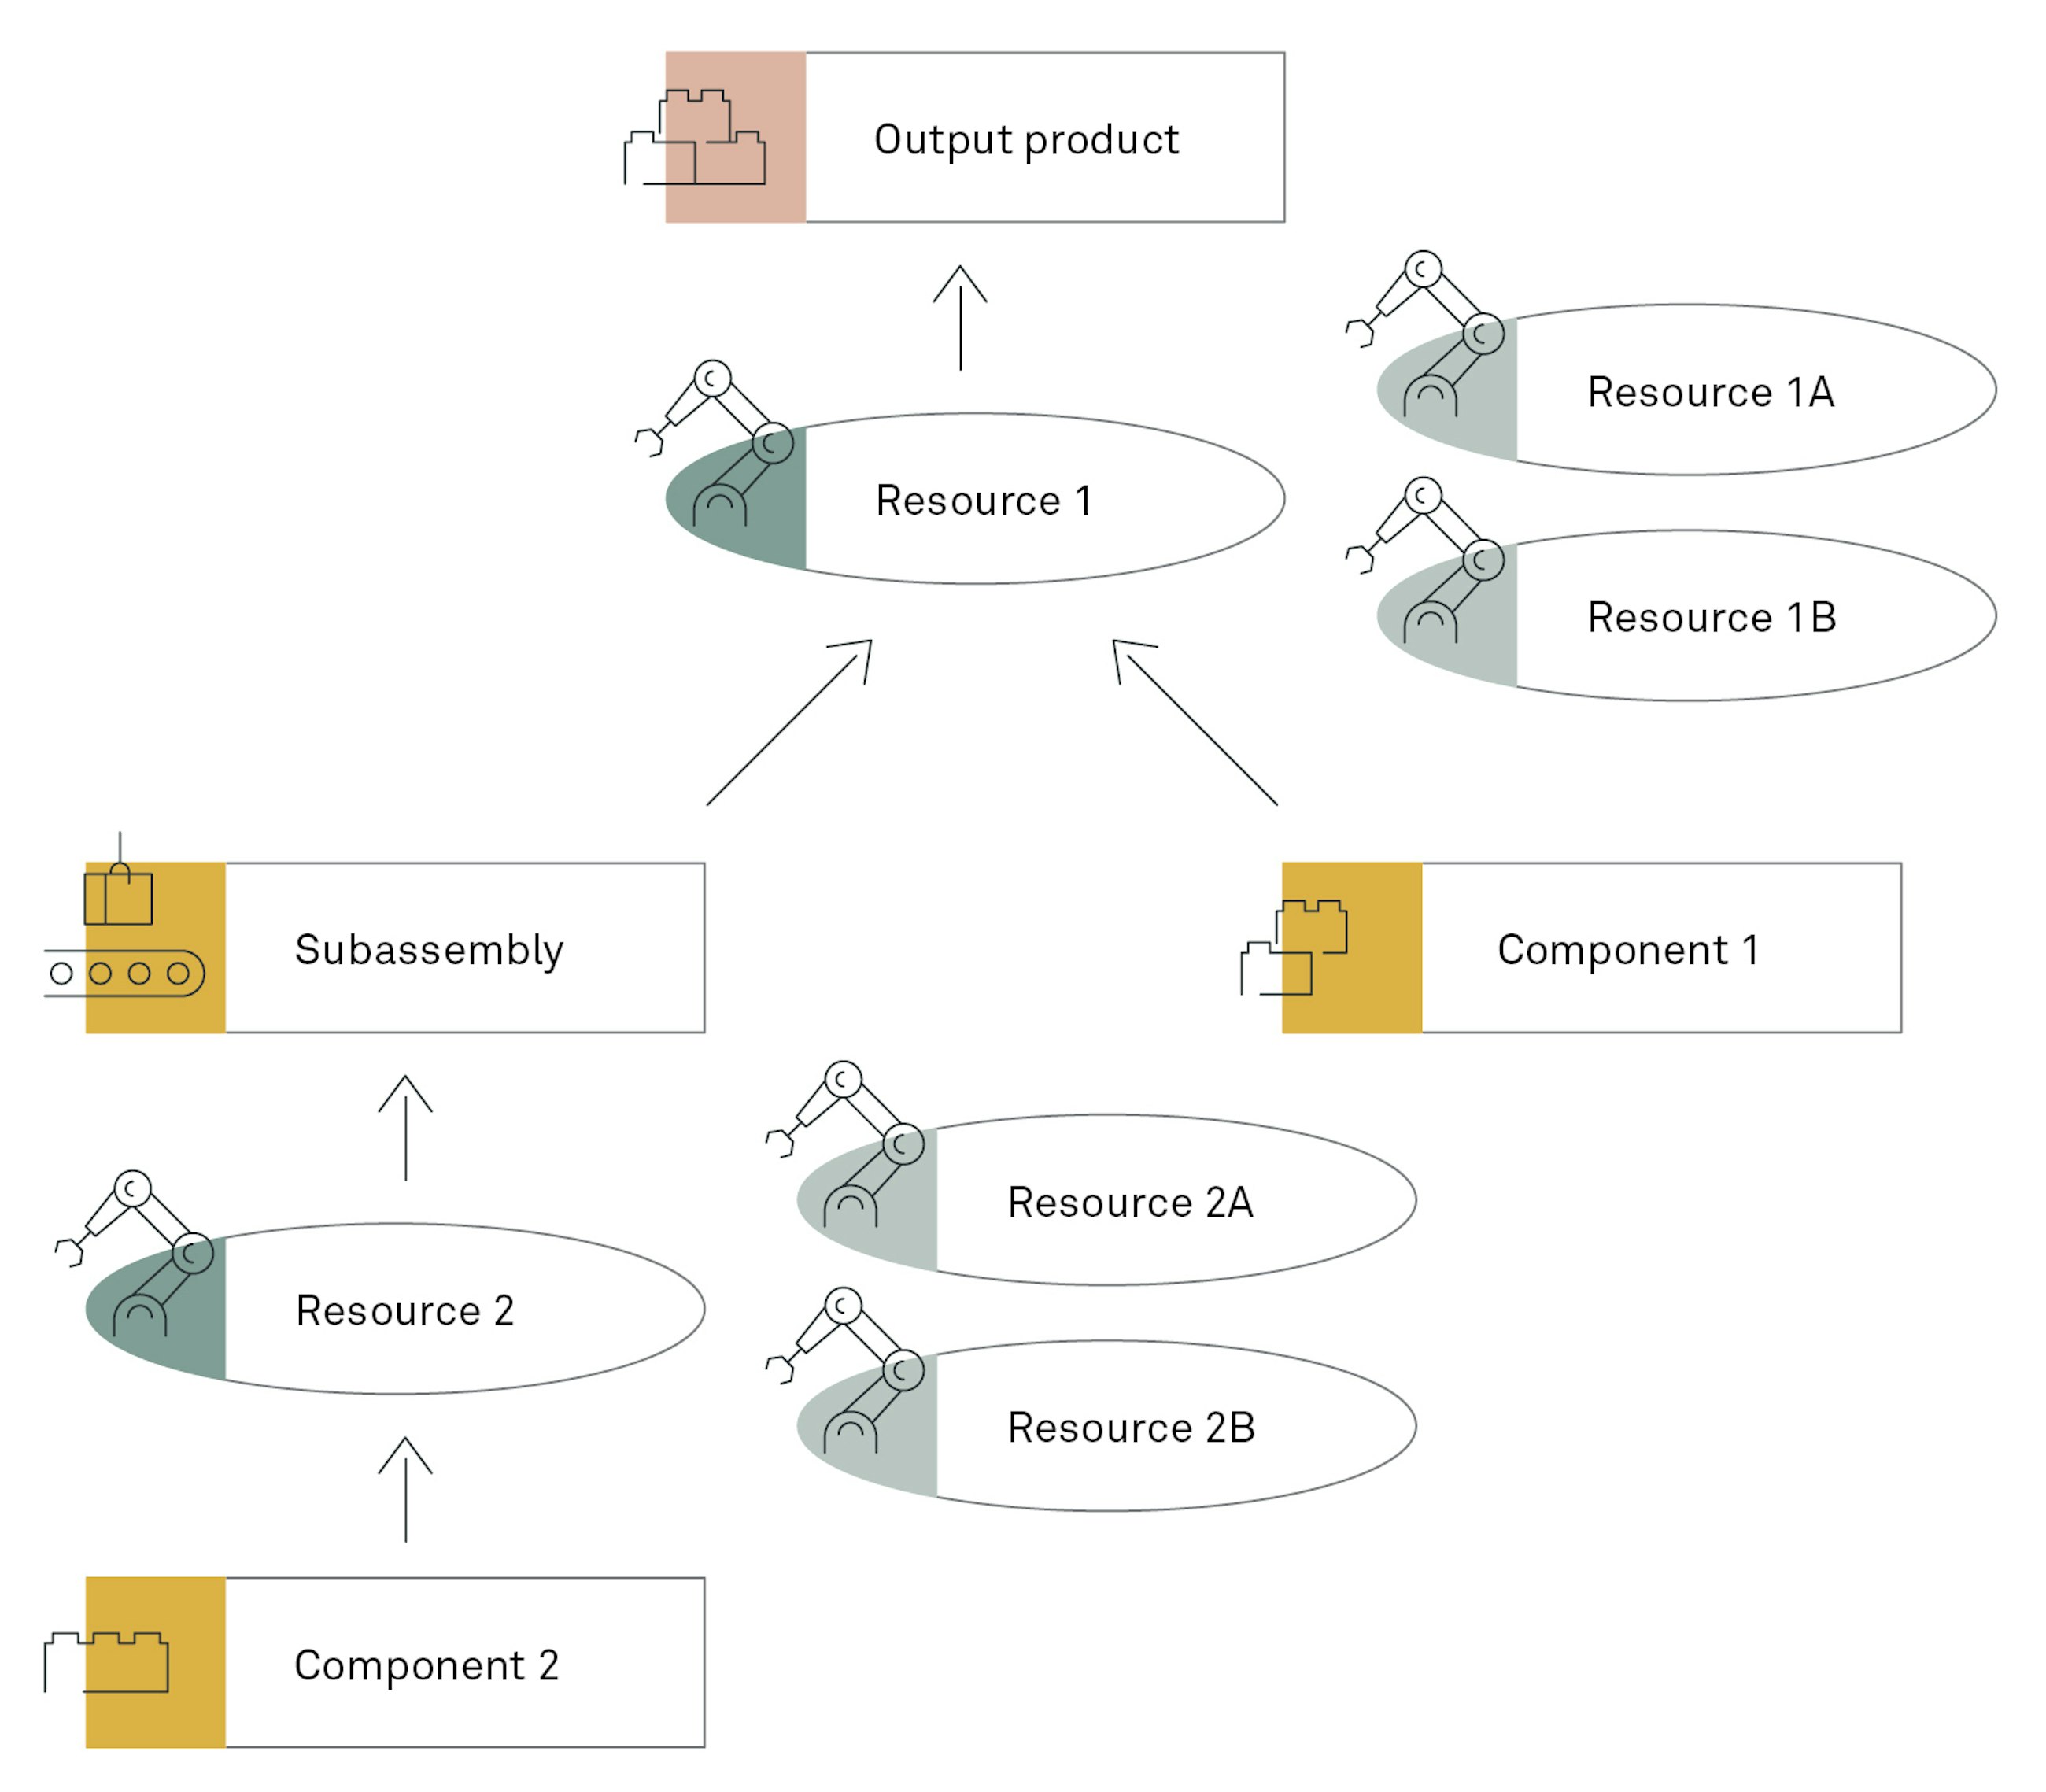
In the 2202 upgrade of SAP IBP, the companies using the Supply Planning Optimizer can look forward to a treat in the form of a new functionality for their planning run. The new functionality allows you to model alternative resources for specific products which the optimizer heuristics can use continuously or in cases of constraints on the original source of supply. Furthermore, the alternative resources can have different consumption rates compared to the original resource, which would be relevant if you have a product running on a newer machine with a lower consumption rate in time or material compared to an older resource. If you would like the original resource to be the primary source of supply and only use the alternative resource in situations of constrained supply, then this can be done by adding “penalty costs” for using the alternative resource. The penalty costs used for alternative resource usage are called Production Resource Substitution Cost Rate.
To add the new feature to the supply planning optimizer, some master data and attributes must be added to the planning area. In the master data Production Source Resource, you must add the attribute “Alternative Resource”. Once the attribute is added, you can specify which resource can be alternative resources. Once this is done, you add the required master data elements in the new master data table called Production Source Resource Sub, where you specify which resource can act as alternative resources for original resources.
The new feature is a cool enhancement for companies where products can flow between resources, but there is a priority for which resource is being utilised. Furthermore, this new enhancement can reduce the amount of manual work performed regarding movement of planned productions between resources at the scheduling level as the optimizer will seek to create a feasible plan which is most optimal from a cost perspective.
The Planner Workspace has been added in the 2105 release, and it has since then been clear that it is the future web-based planning module of SAP IBP. With the new upgrade, SAP has developed more functionalities to the Planner Workspace, improving some crucial aspects that emphasise the simplicity of performing simple planning tasks in the Planner Workspace instead of using the Excel interface.
The new functionalities added to the Planner Workspace include:
Let us now take a closer look at these new features.
When working in the Planner Workspace, you can decide to apply different filters to your components or to apply the same filters to all your components. By default, all Workspace filters are applied to all the components. However, you can also decide to have only the component filters applied to your data by selecting the Ignore the Workspace filters option in the component definition.
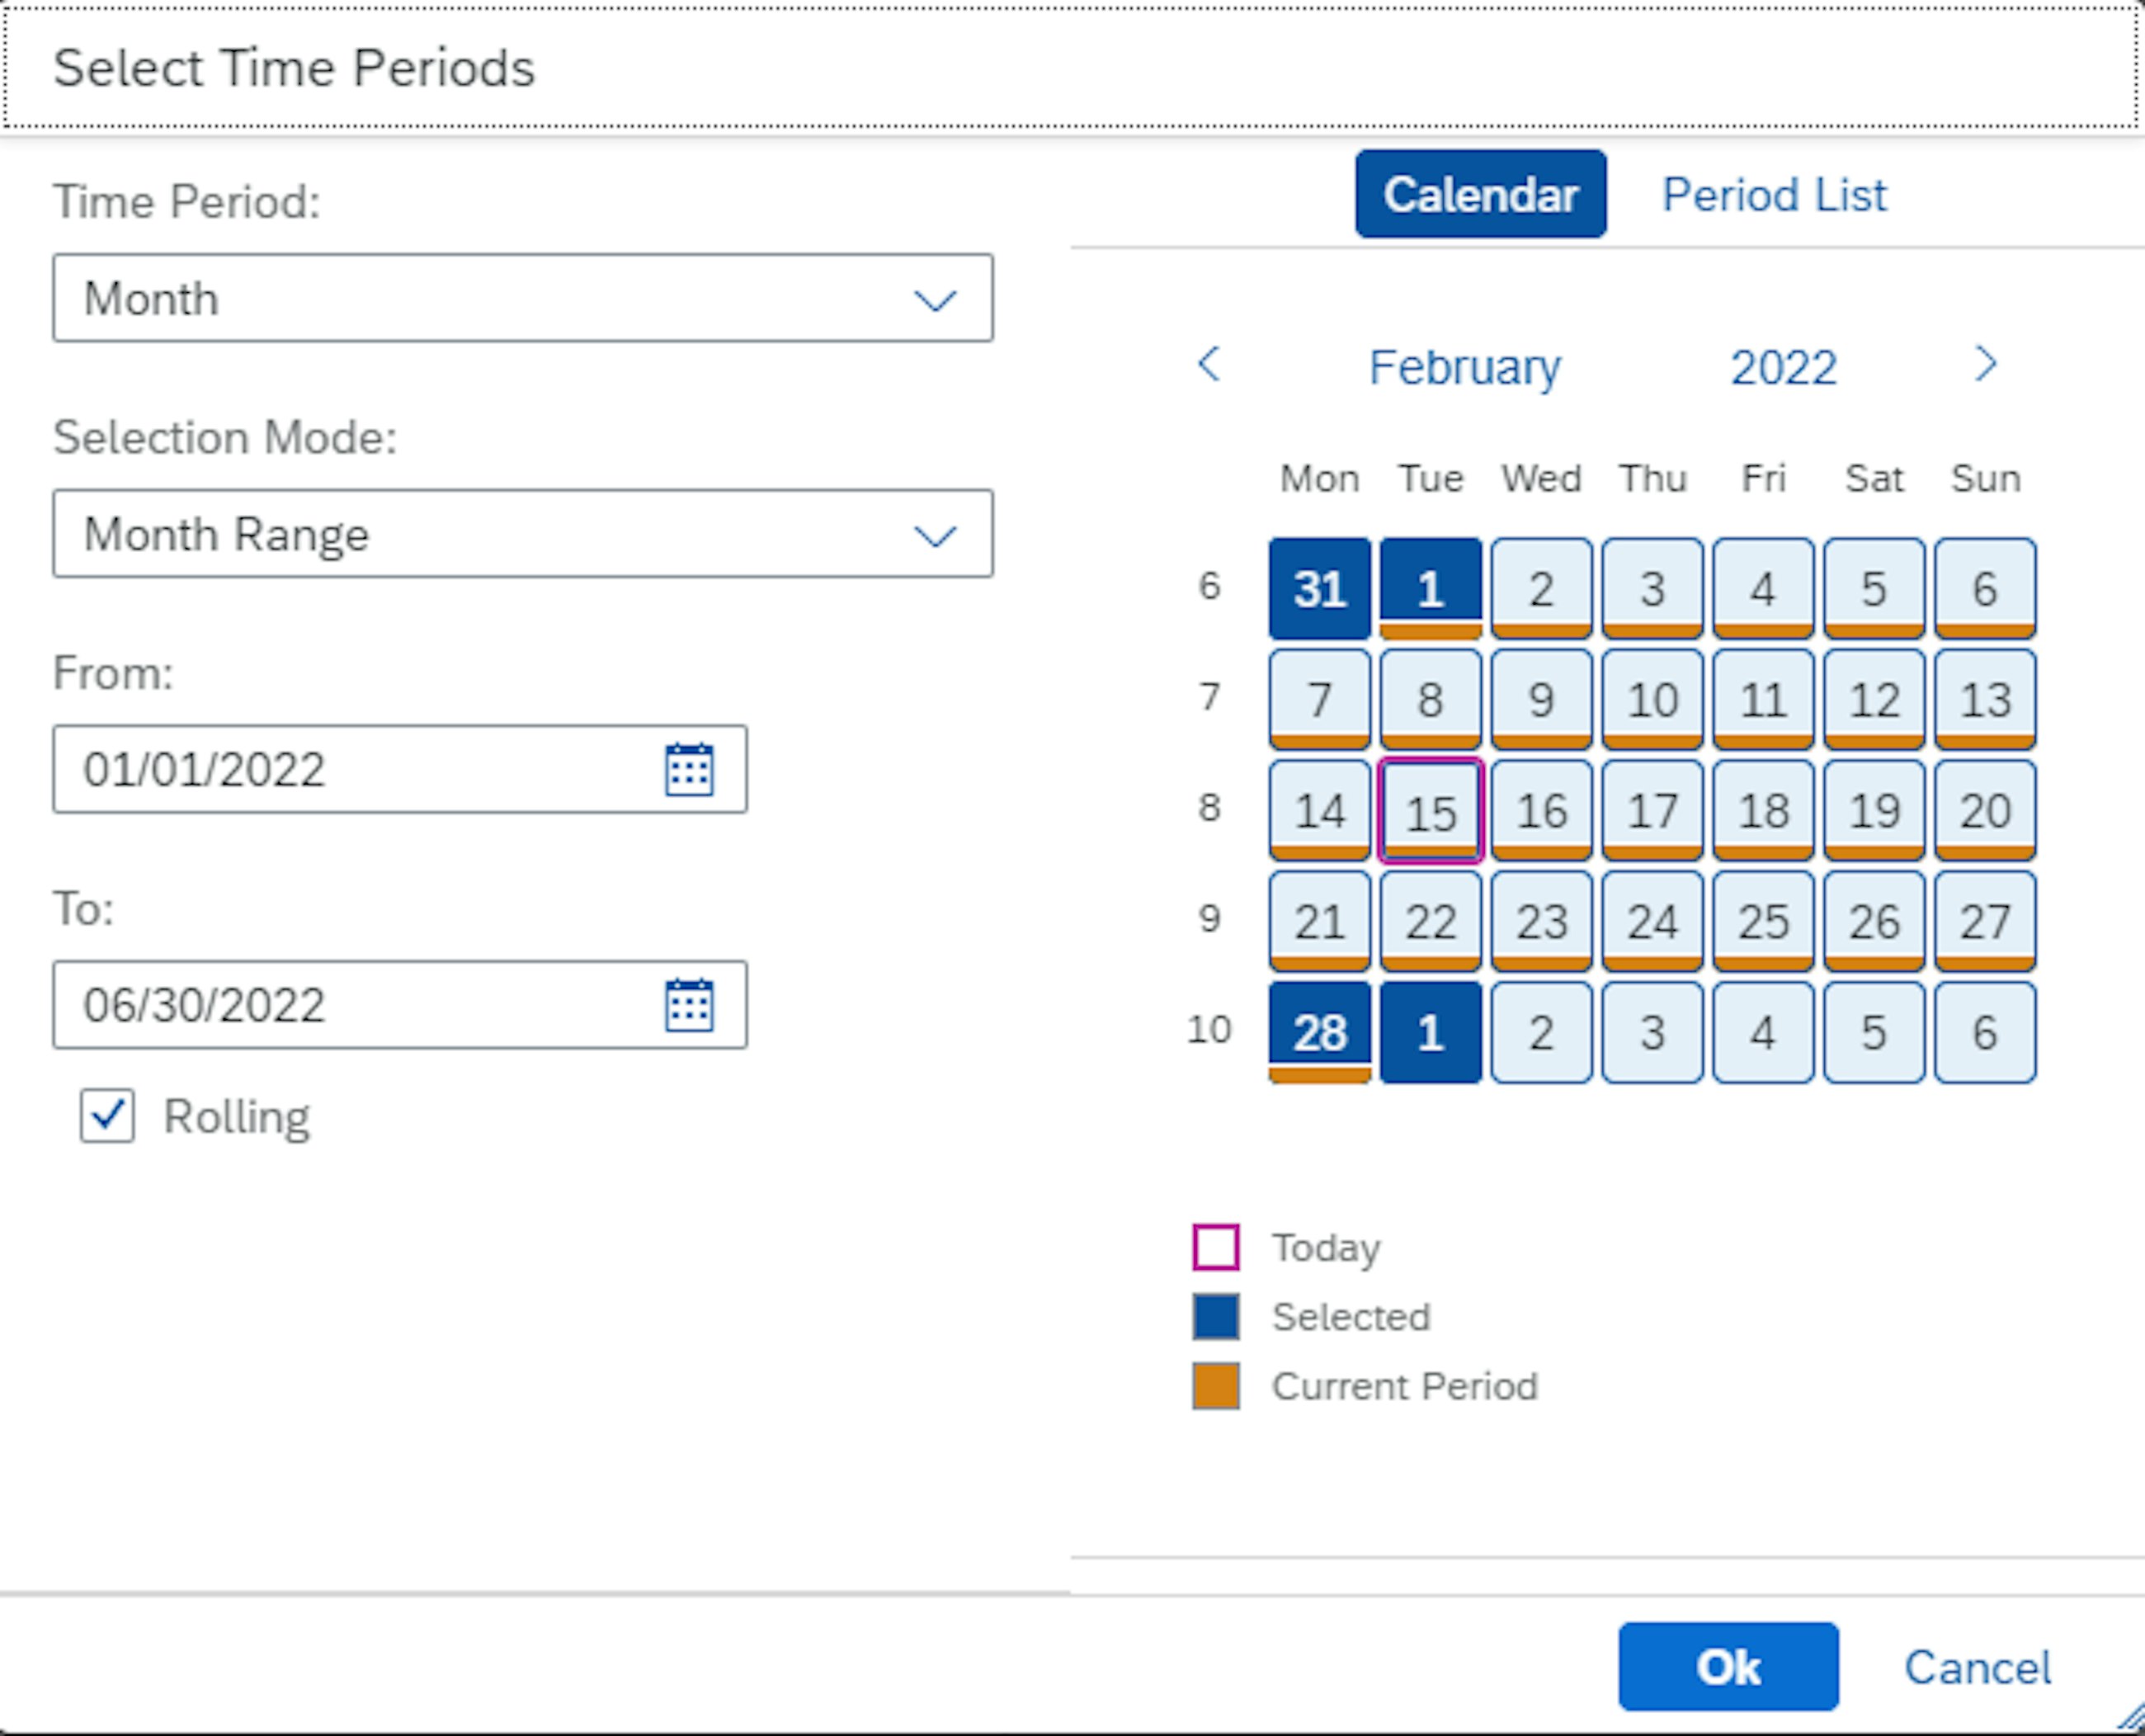
Moreover, with the new release, it is now possible to select the Rolling checkbox shown in the figure below.
By selecting the Rolling checkbox every time you access the Planner Workspace, the data for the components will be dynamically shifted based on your Time Period filter selection.
E.g. you have selected a time range from one month before the current period (current month) to five months after the current period. Every time you access the Planner Workspace, the filter will adjust and shift automatically to one month before and five months after the current month.
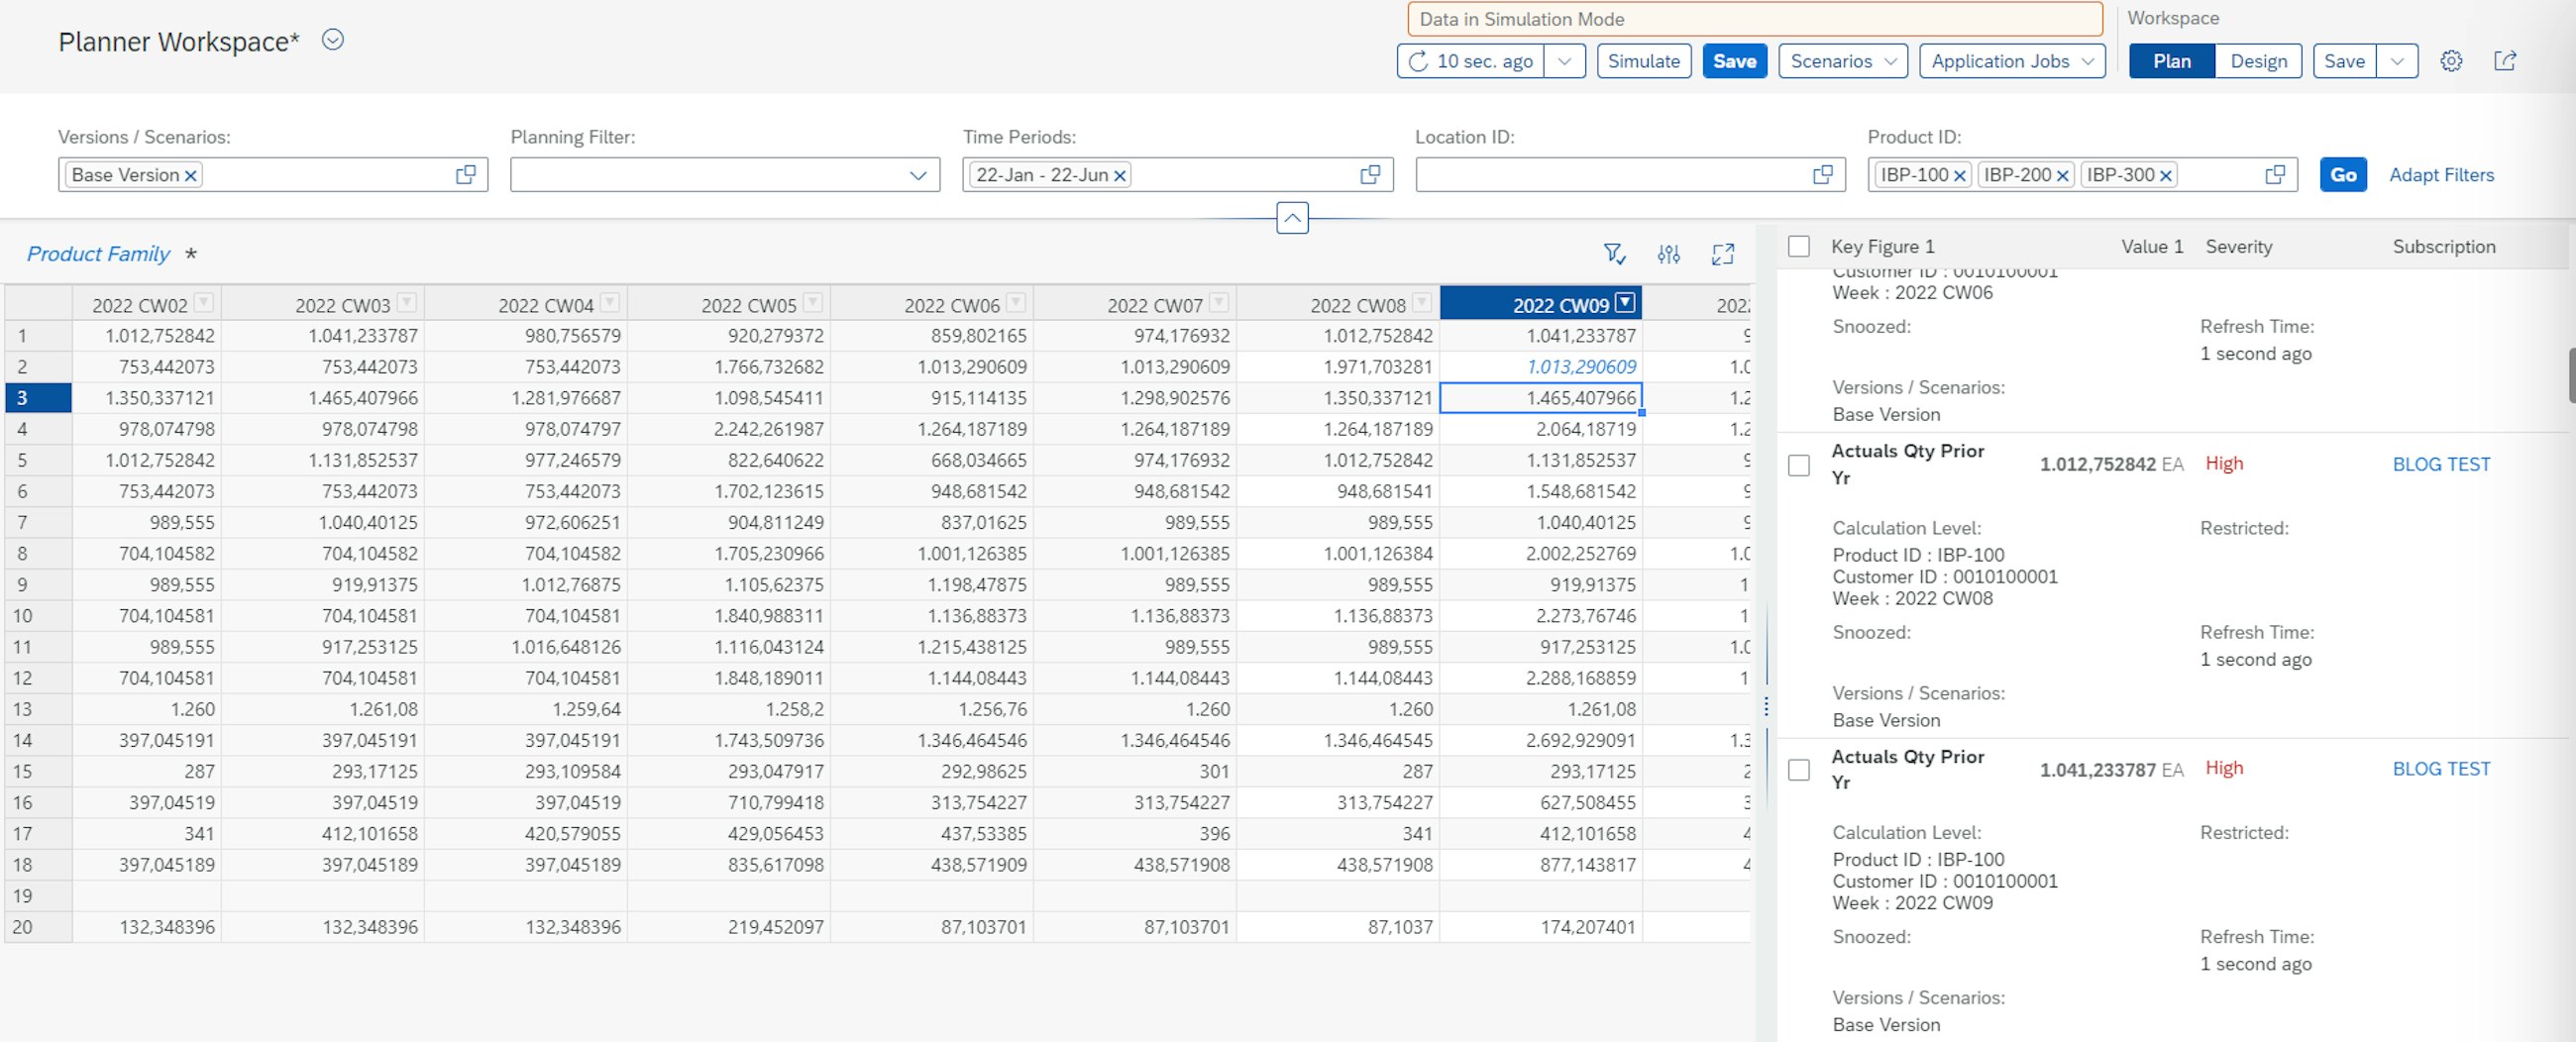
Another feature that has been added is the simulation status. In fact, when you now make changes to a key figure value in a planning view, and you run the simulation, the simulation status is now displayed for the custom alerts on the custom alert overview. This enables you to see and evaluate the implications of the change on your custom alerts before you save your change.
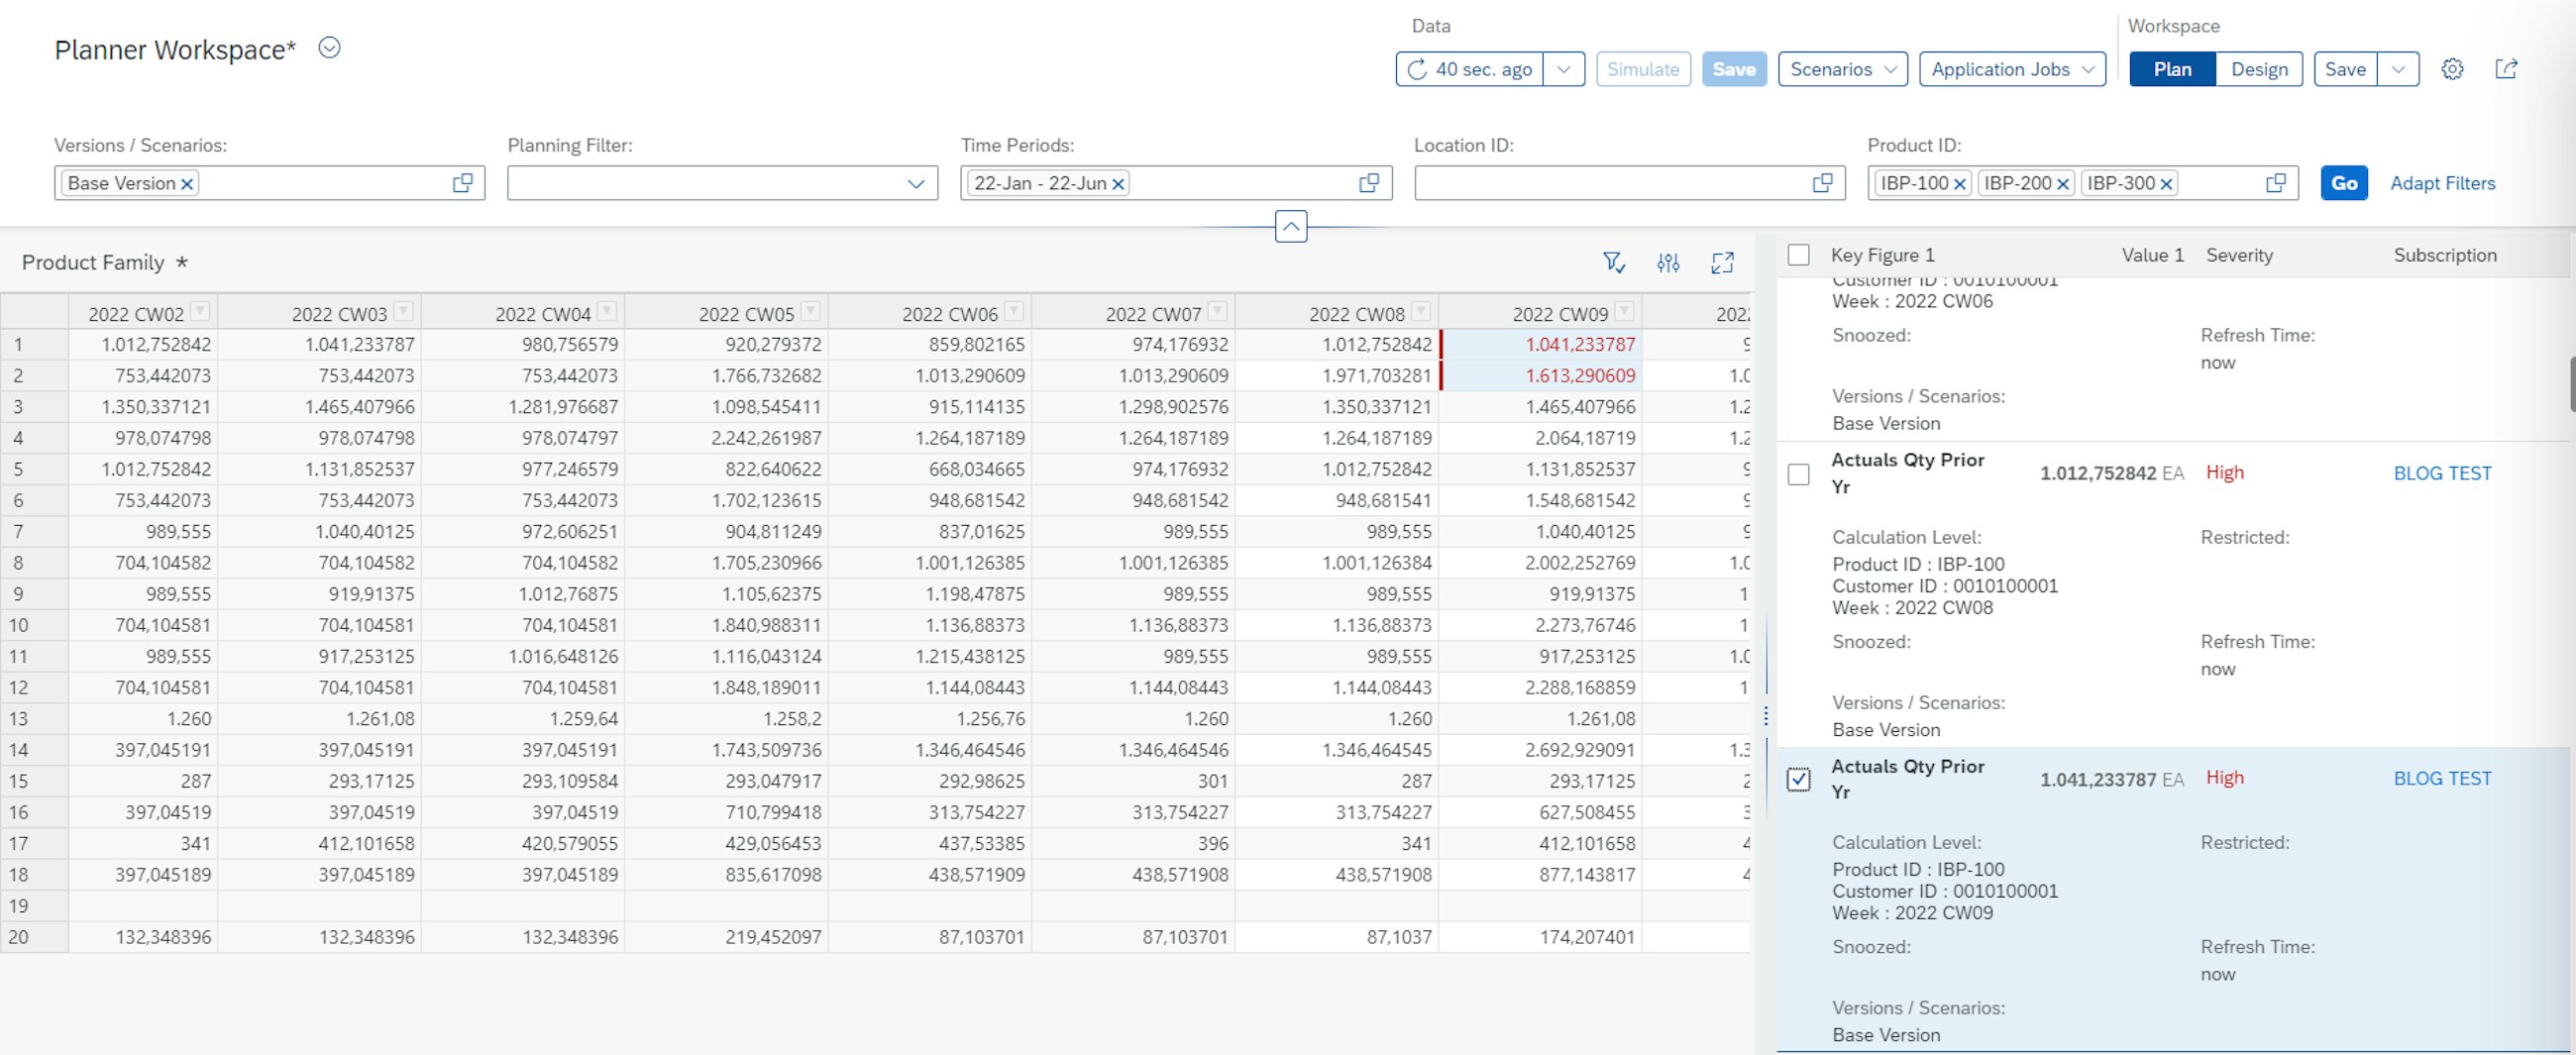
When you select an alert from the custom alert view, this is highlighted in the planning view as shown in the picture below. This allows you to easily identify and edit the key figure value where an alert is triggered.
Once you have edited the key figure value of the alert you want to solve, you can click on the Simulate button, and then you enter the Simulation status. Here, you can see the effect of your changes. In fact, you can now see if new custom alerts have been calculated, have changed, have remained unchanged or have been solved as a result of the simulation.
Once you have defined all the changes you want to make, you can save the data and get out of the Simulation status. The data is now saved.
With the latest release, it is even possible to protect key figure values by providing reason codes and comments for changes to key figure values. In fact, it is now possible to design the Planner Workspace by enforcing the reason codes and comments when a user saves changes to a planning view.
If you want users to provide a reason code when they save changes to a planning view, you can use the global configuration parameters. In fact, there you can set up the settings you prefer by choosing reason codes, comments and a lot more.
All the changes with the related reason codes and comments can then be seen in the Change History app. It provides you with information about the changes that can support you in your planning process such as previous and new values of the changed key figures, reason codes and comments for the changes.
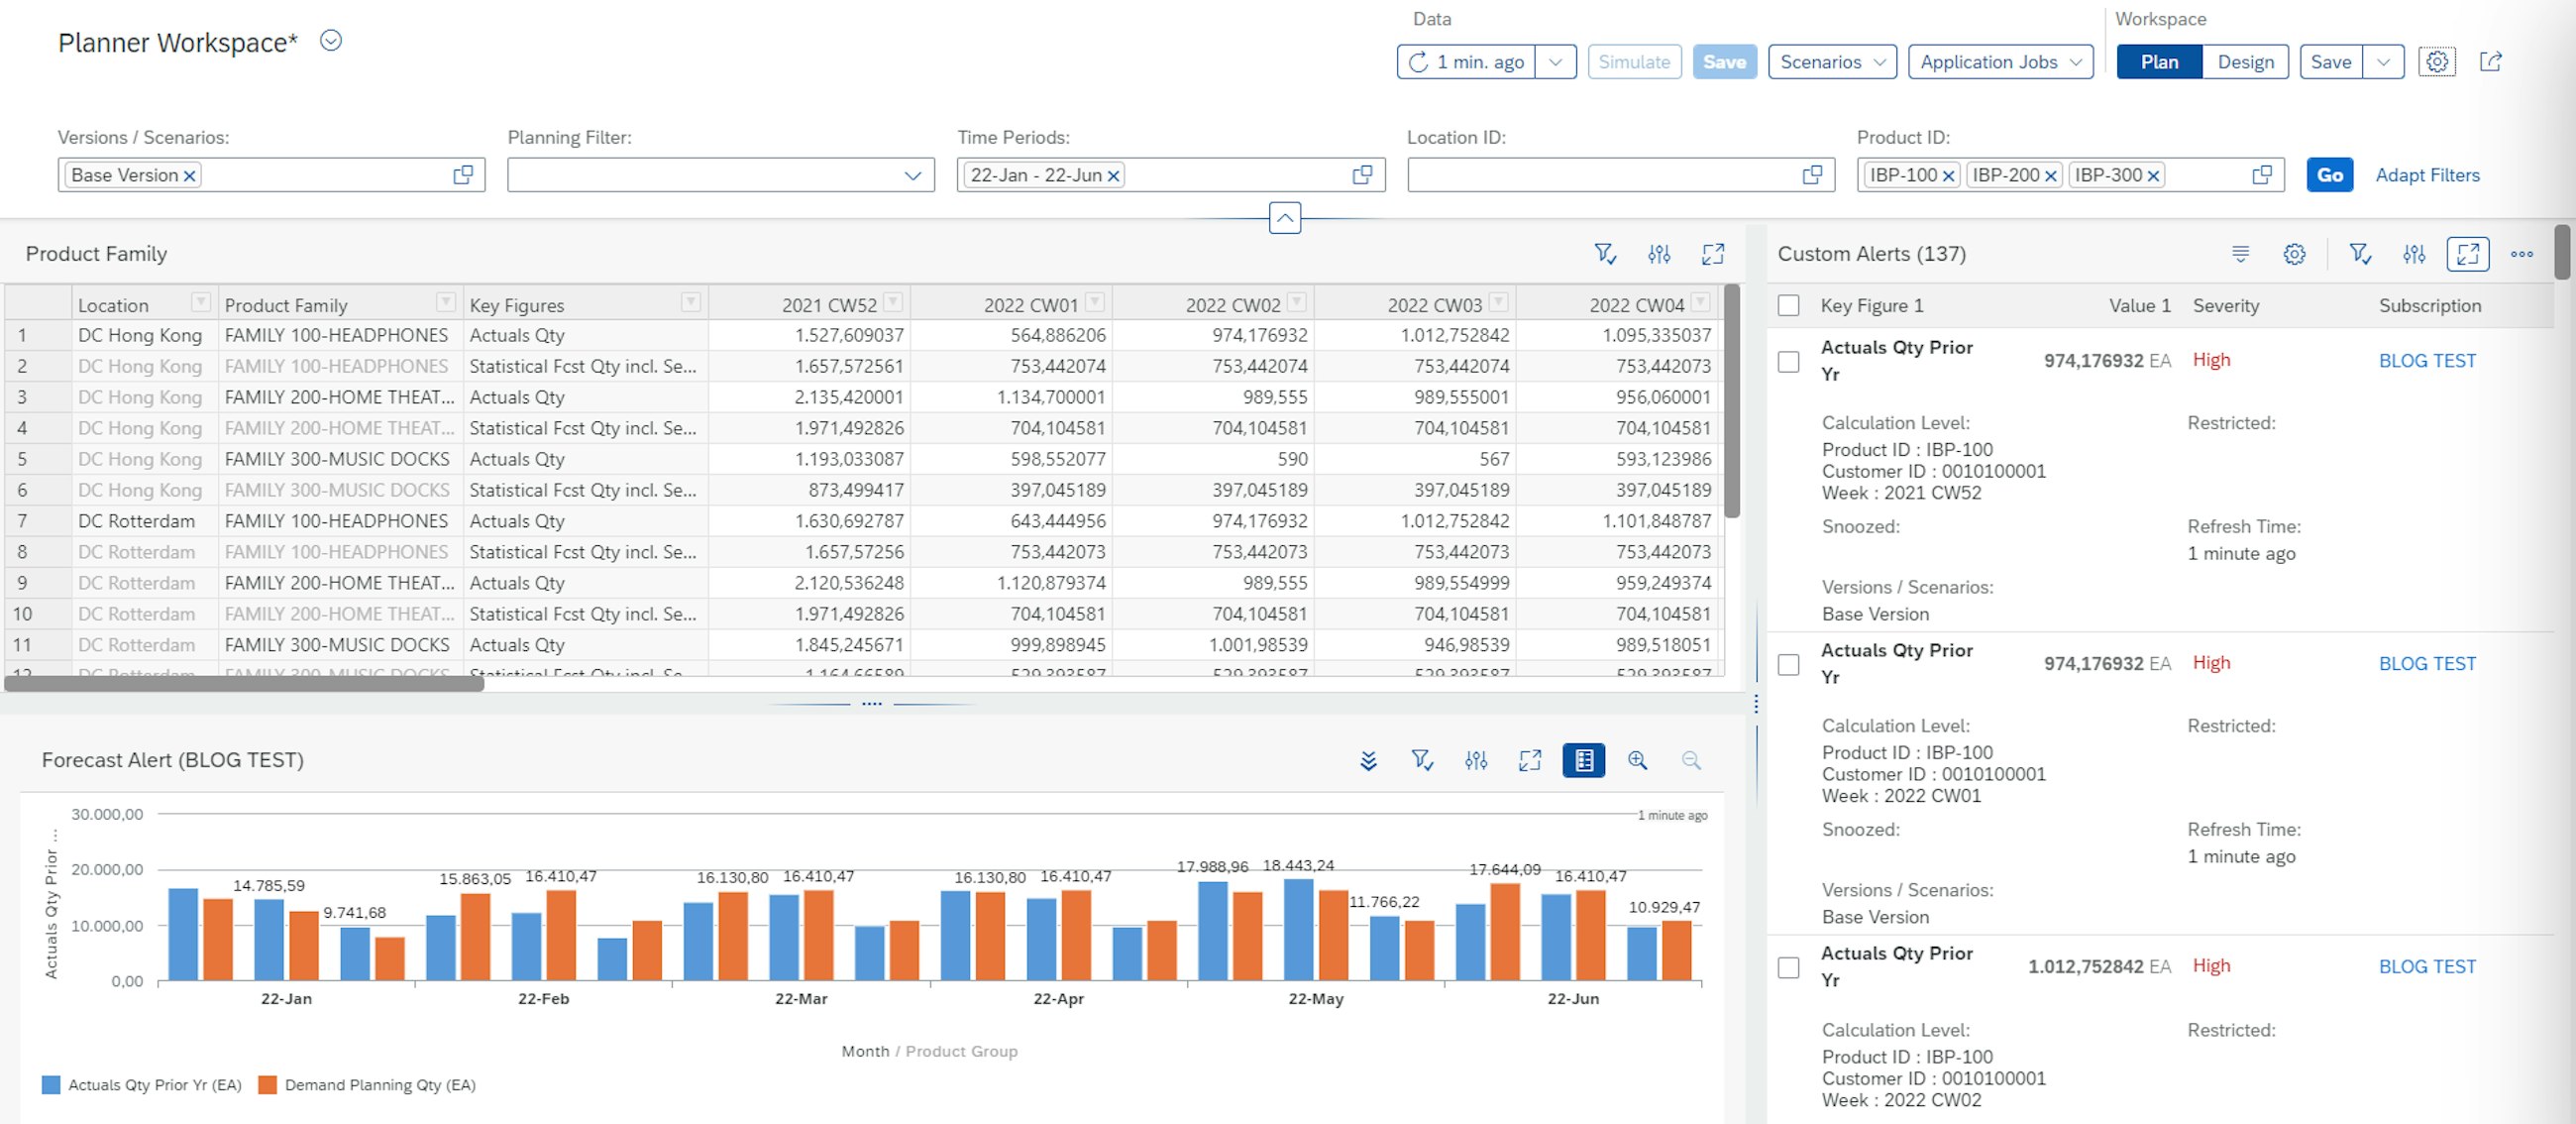
Regarding the chart types, it is now possible to display a larger variance of comparison, distribution and trend charts. By adding these charts, it becomes easier to generate an easy overview of the planning tasks and extract the relevant planning information needed to make the right decisions. This makes the planner workspace even more personalised and intuitive for the planners making the daily tasks.
The chart needs to be created in the Advance Analytics app, and then it can be added to the Planner Workspace. In the Advance Analytics app, you can choose between a large variety of charts, and if a drill-down is added to the graph, it is now possible to display it in the Planner Workspace as shown in the picture above.
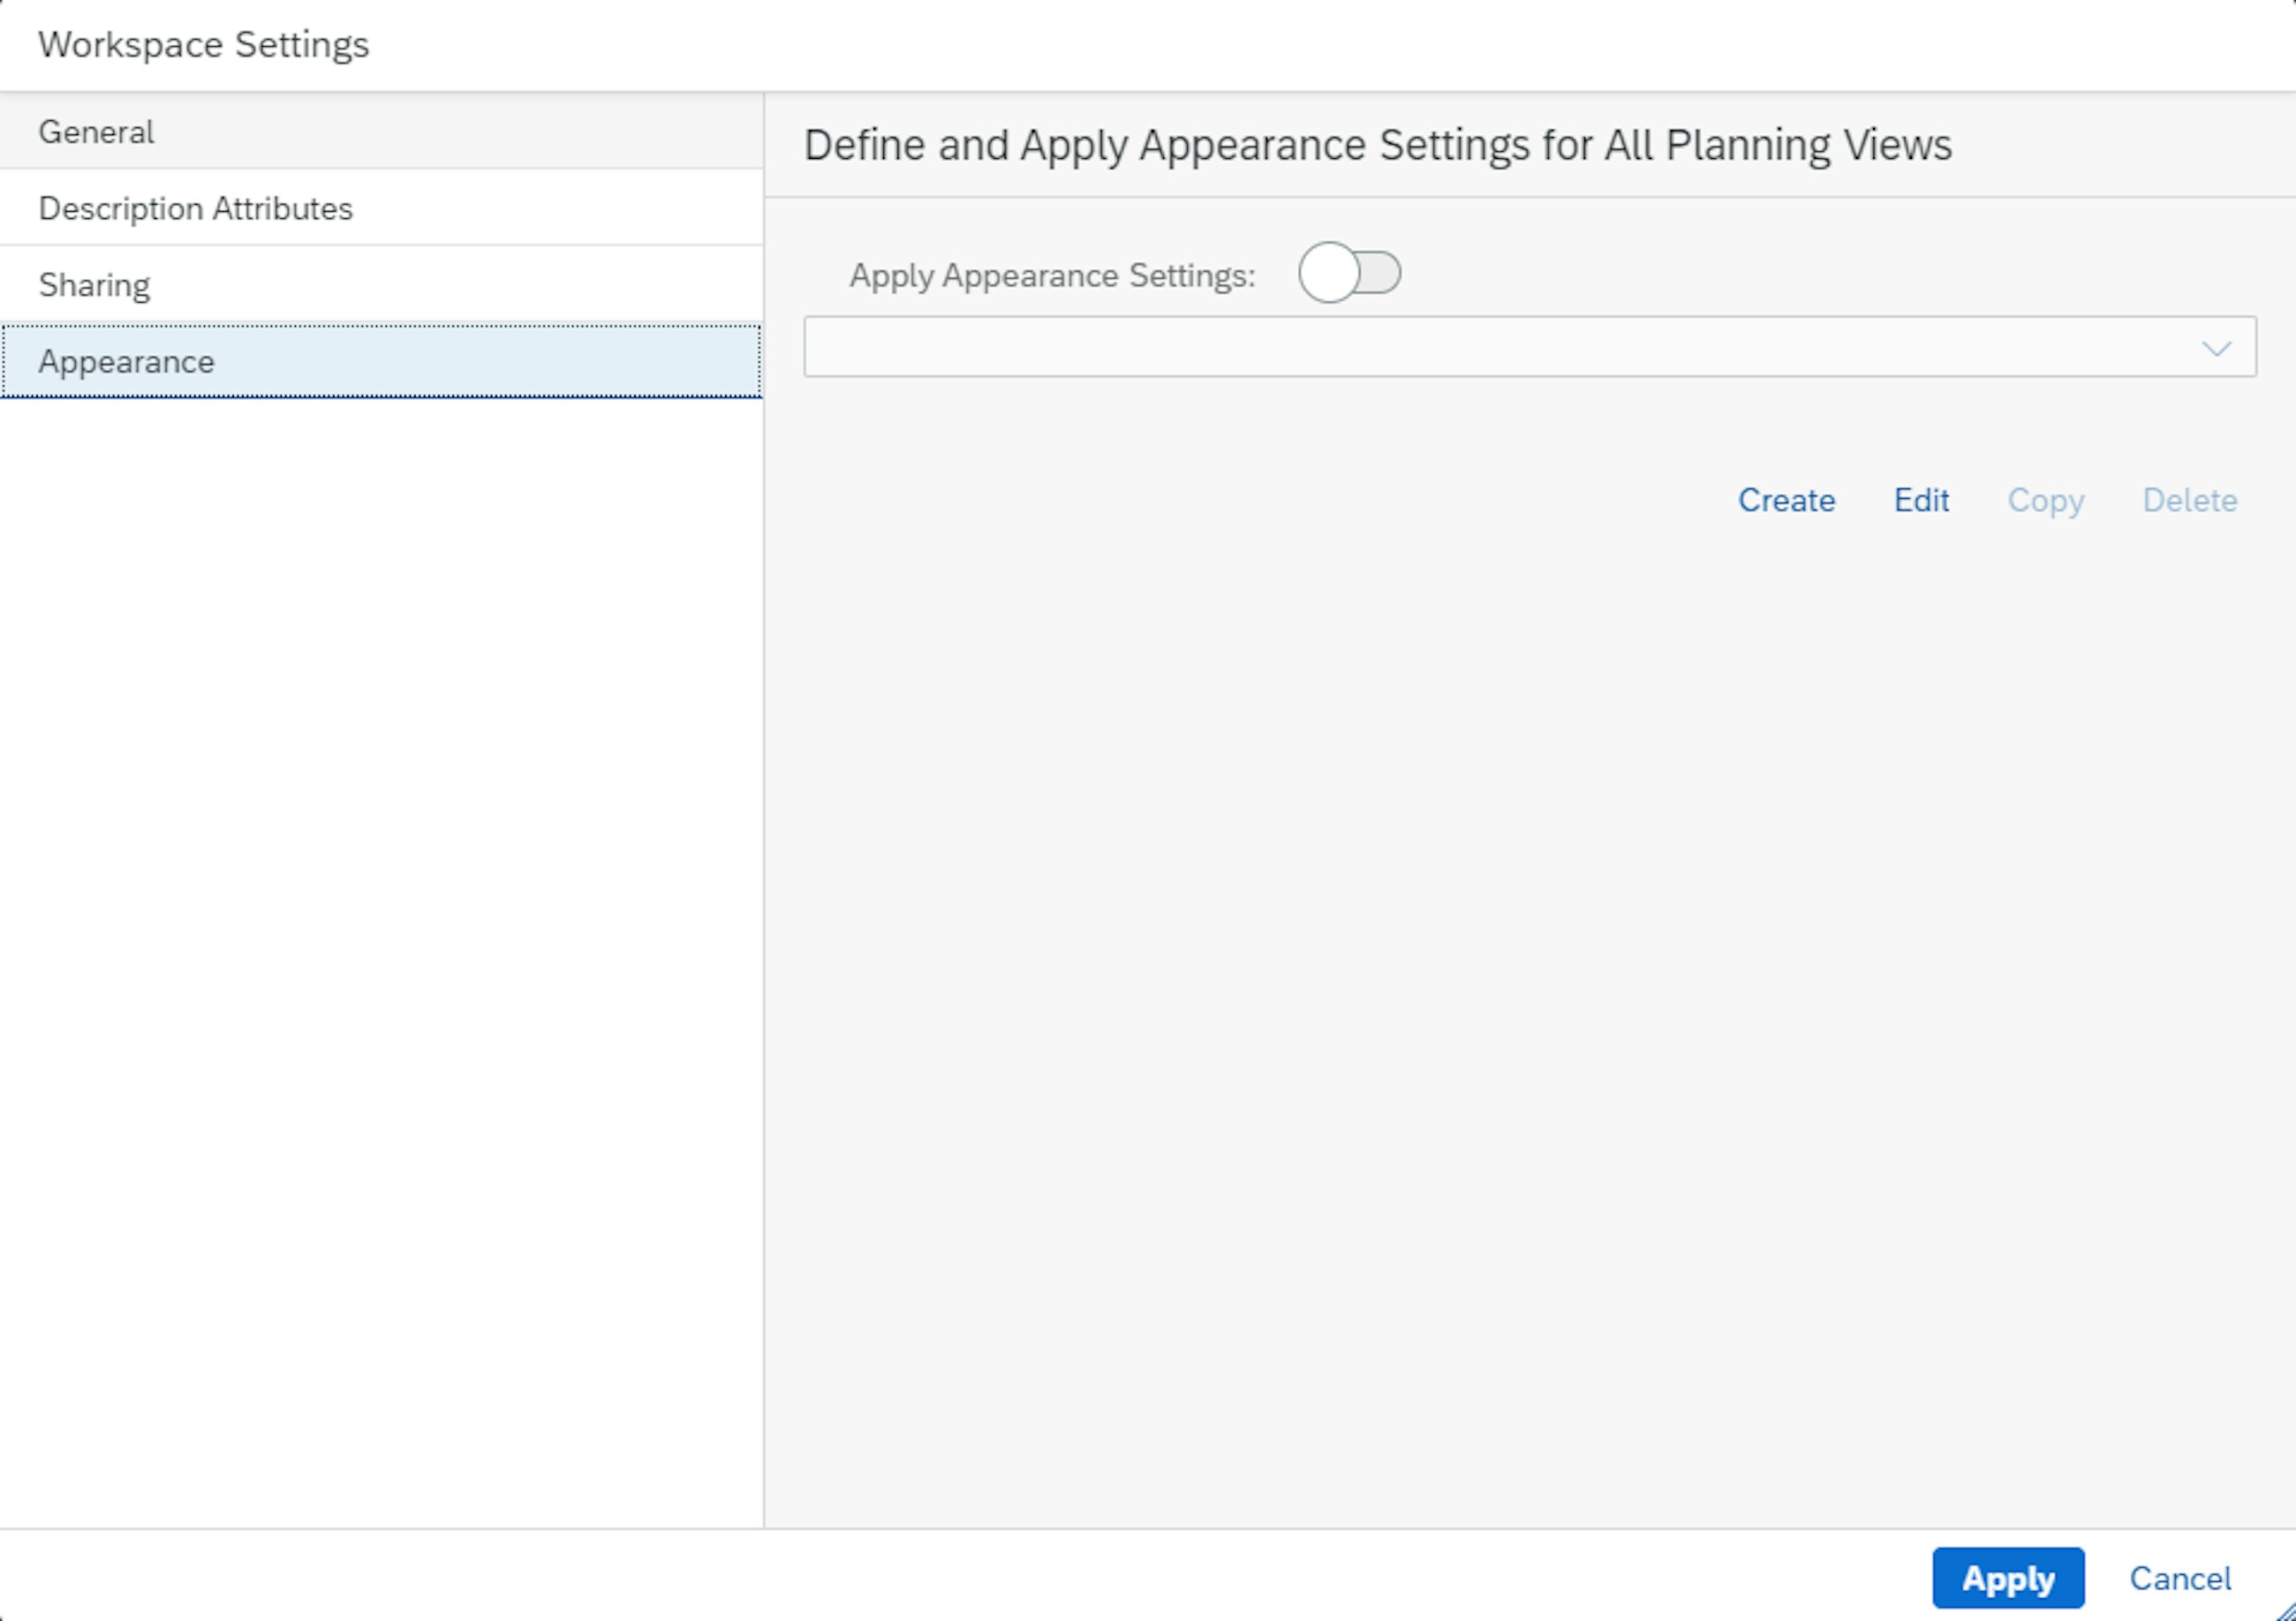
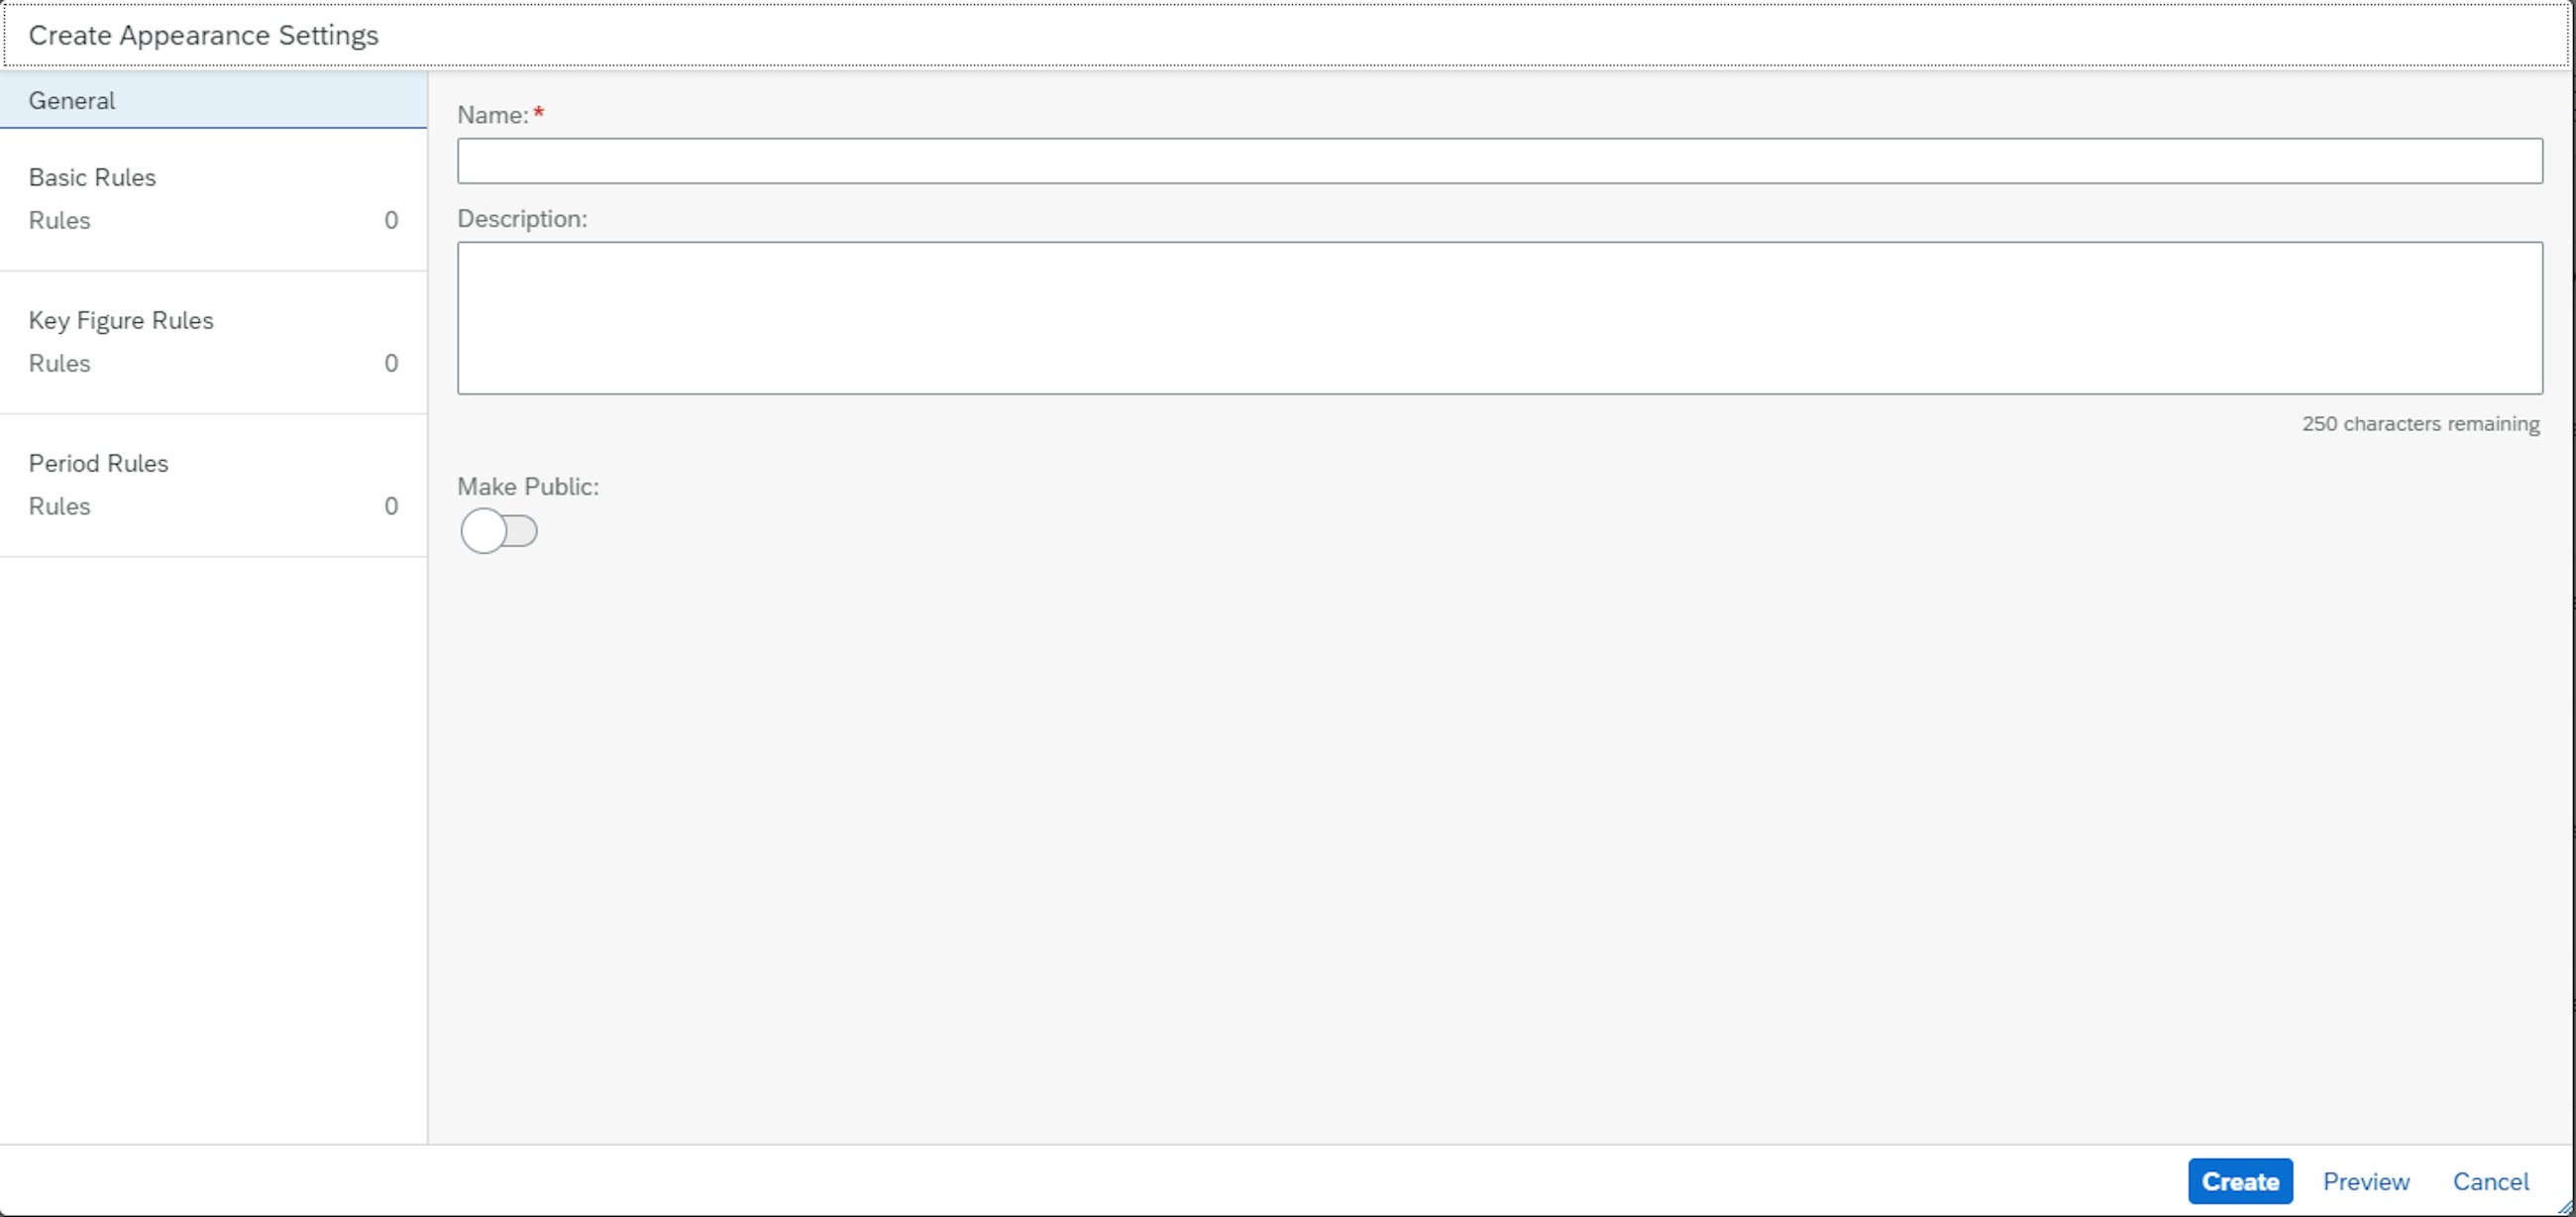
The last feature that has been added to the Planner Workspace is about the Appearance settings. The Appearance settings allow you to create and apply your own colour and formatting settings for the data in the planning views in your Planner Workspaces. With the latest release, it is possible to create, copy, edit and delete Appearance settings for the planning views in a Planner Workspace.
You can create and apply your own Appearance settings and share them with other users by making them public. You do this in the Workspace section by choosing Settings < Appearance.
In the setting, you can apply Appearance settings that were created and made public by other users, or you can create Appearance settings from scratch. This can be done by setting up the basic rules, key figure rules and period rules. Alternatively, you can copy existing Appearance settings created by you or by other users who have made them public. You can also make it public. By doing so, you allow other users to use the Appearance you created in other Planner Workspaces.
With the new features developed in the SAP IBP 2202 release, it has become even easier for some planners to perform simple planning tasks in the Planner Workspace environment instead of using the IBP Excel tool. In the future, SAP is investing even more in improving the usability of the Planner Workspace by adding the following features in the next releases: