Article
Five selected features of the 2108 upgrade of SAP IBP

Published
3 September 2021
In August 2021, SAP released the 2108 upgrade of SAP Integrated Business Planning (IBP). Just as the previous releases, we have compiled a staff-picked list of five features of the IBP 2108 upgrade that we think your company can benefit from and that can leverage your supply chain planning to the next level.
Five selected features of the 2108 upgrade of SAP IBP
1. A new unified workspace for planning business scenarios: Planner’s Workspace
In the 2108 release, SAP has revealed a new app called Planner’s Workspace. This new feature has similarities to the Web-Based Planning feature, but it is not just Web-Based Planning 2.0. The Planner’s Workspace app adds a lot more usable functionality which is useful for cross-functional work streams. Furthermore, Planner’s Workspace provides one unified and central planning workspace for planners to solve any business scenario that may arise in the configurable UI of Fiori.
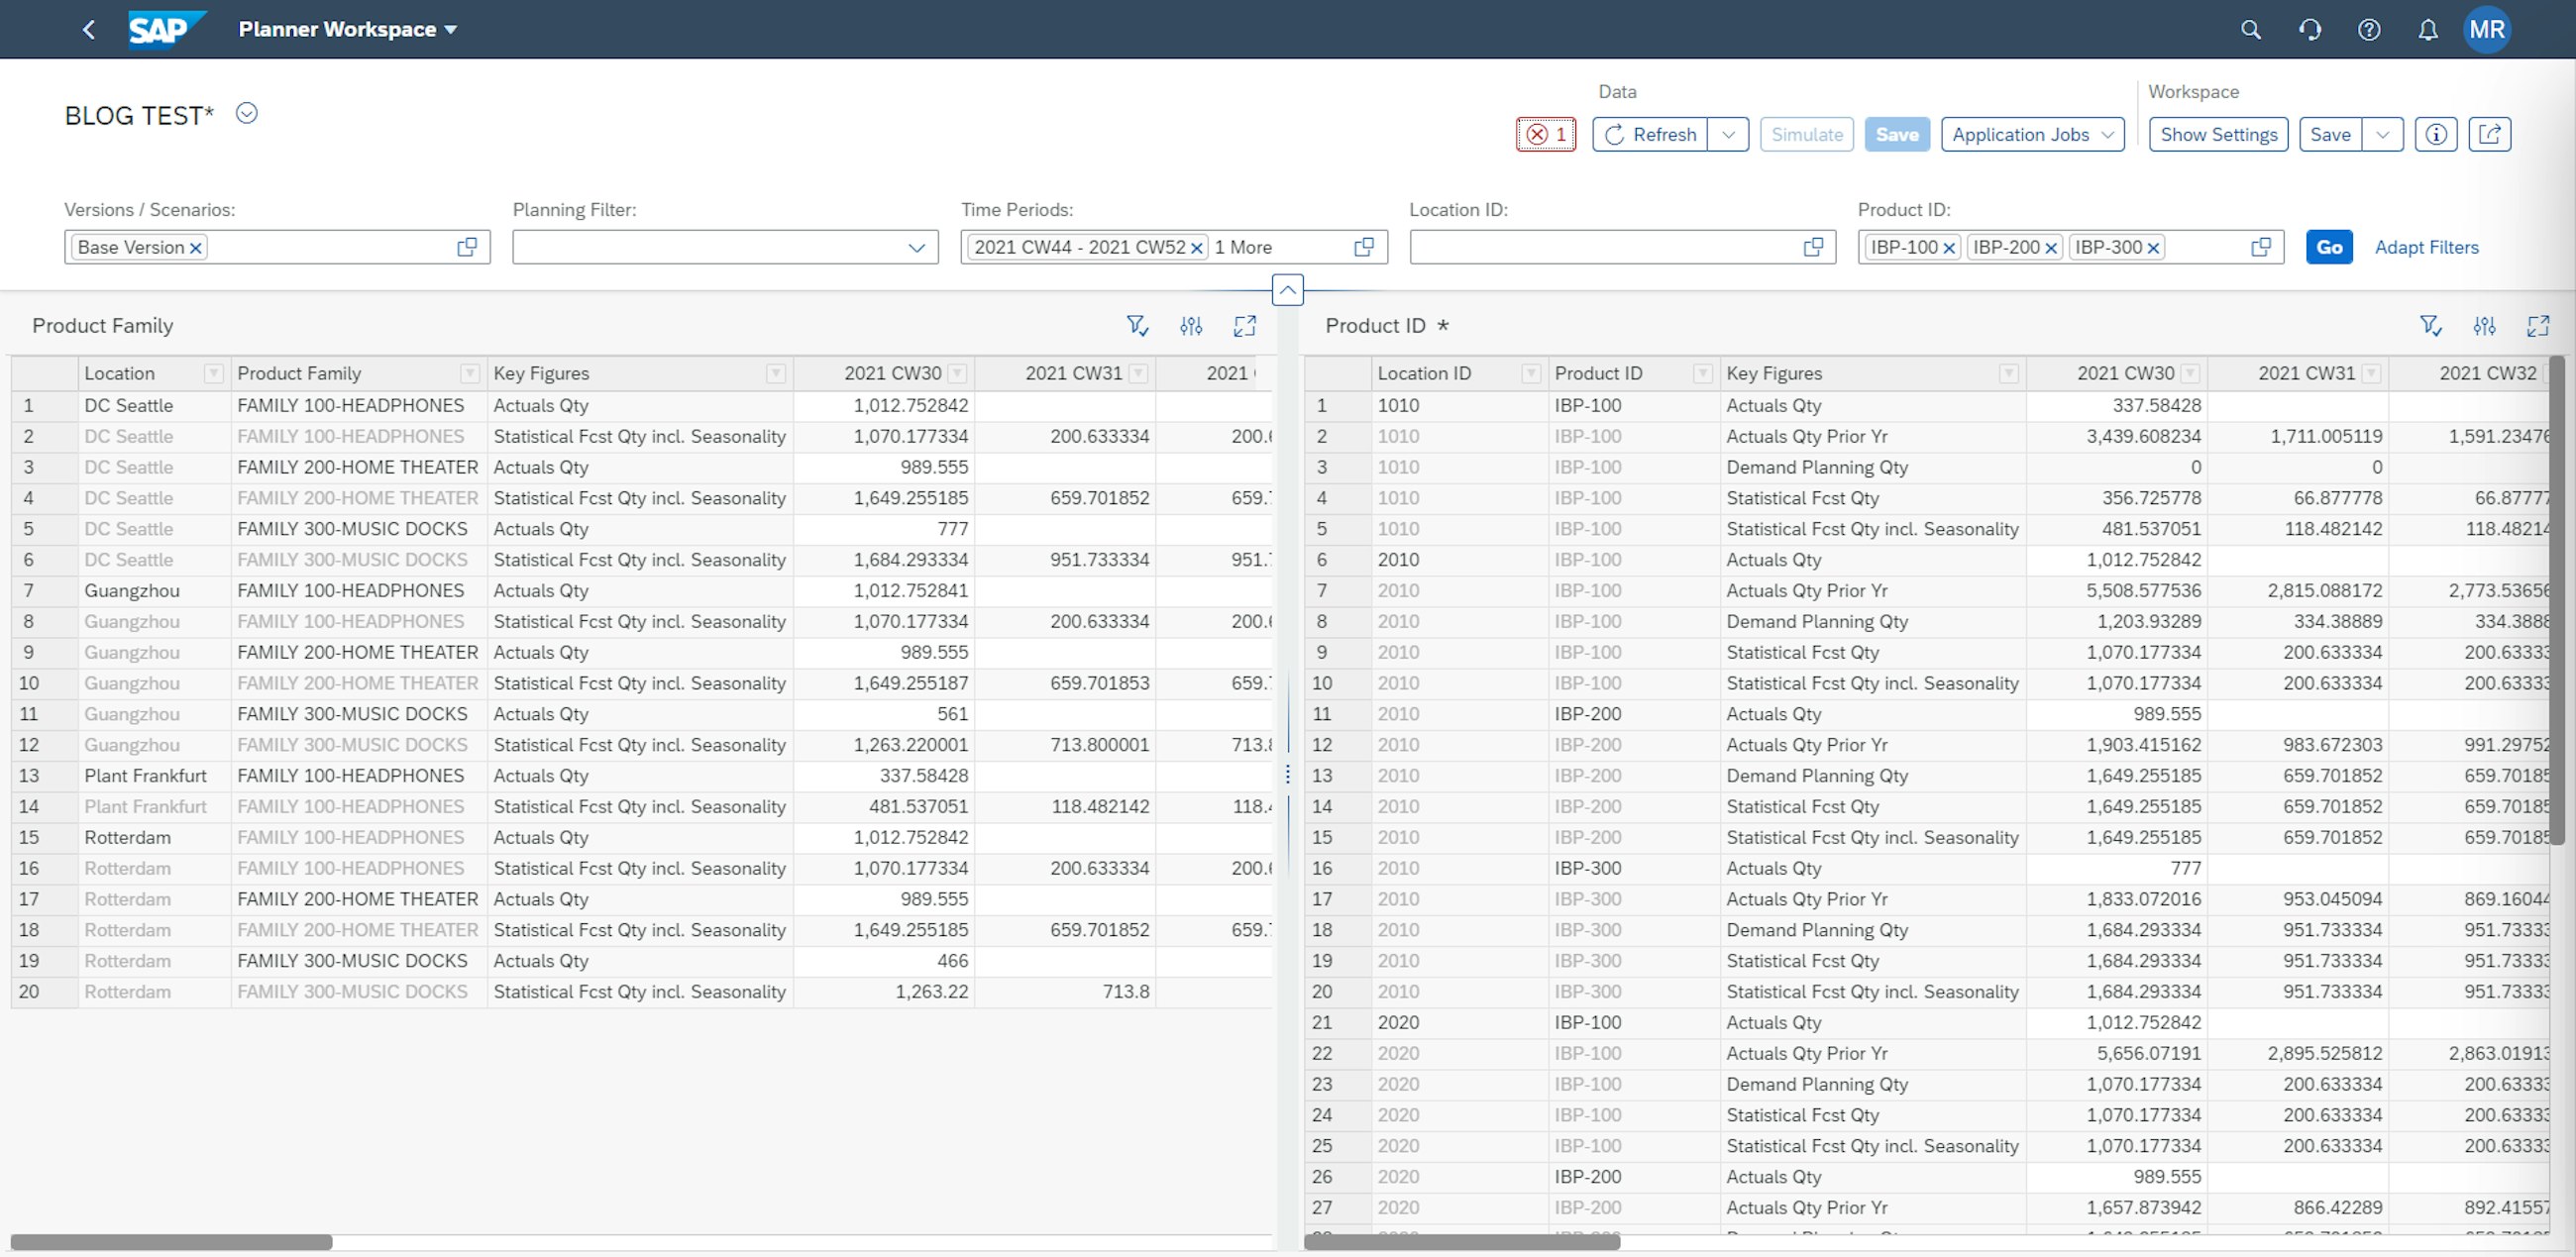
Planner’s Workspace is a configurable planning view where you can customise the planning view any way you may like and use this to perform planning activities on specific combinations, analyse issues with your plan, use custom alerts and do simulations for any specific scenario that you as a user find relevant. Planner’s Workspace allows you to resolve any issue in your supply chain across both planning and execution, thus centralising the numbers and ensuring easy accessibility across multiple business roles.
One of the cool functionalities of Planner’s Workspace is the ability to display different sets of data, scenarios and simulations on one screen without having to switch between apps or planning views. The configuration of the planning views does not require any technical skills for changing the planning views and can be personalised with a layout that suits your business scenario.
Overview of Planner’s Workspace – this view can be customized as desired by the user.
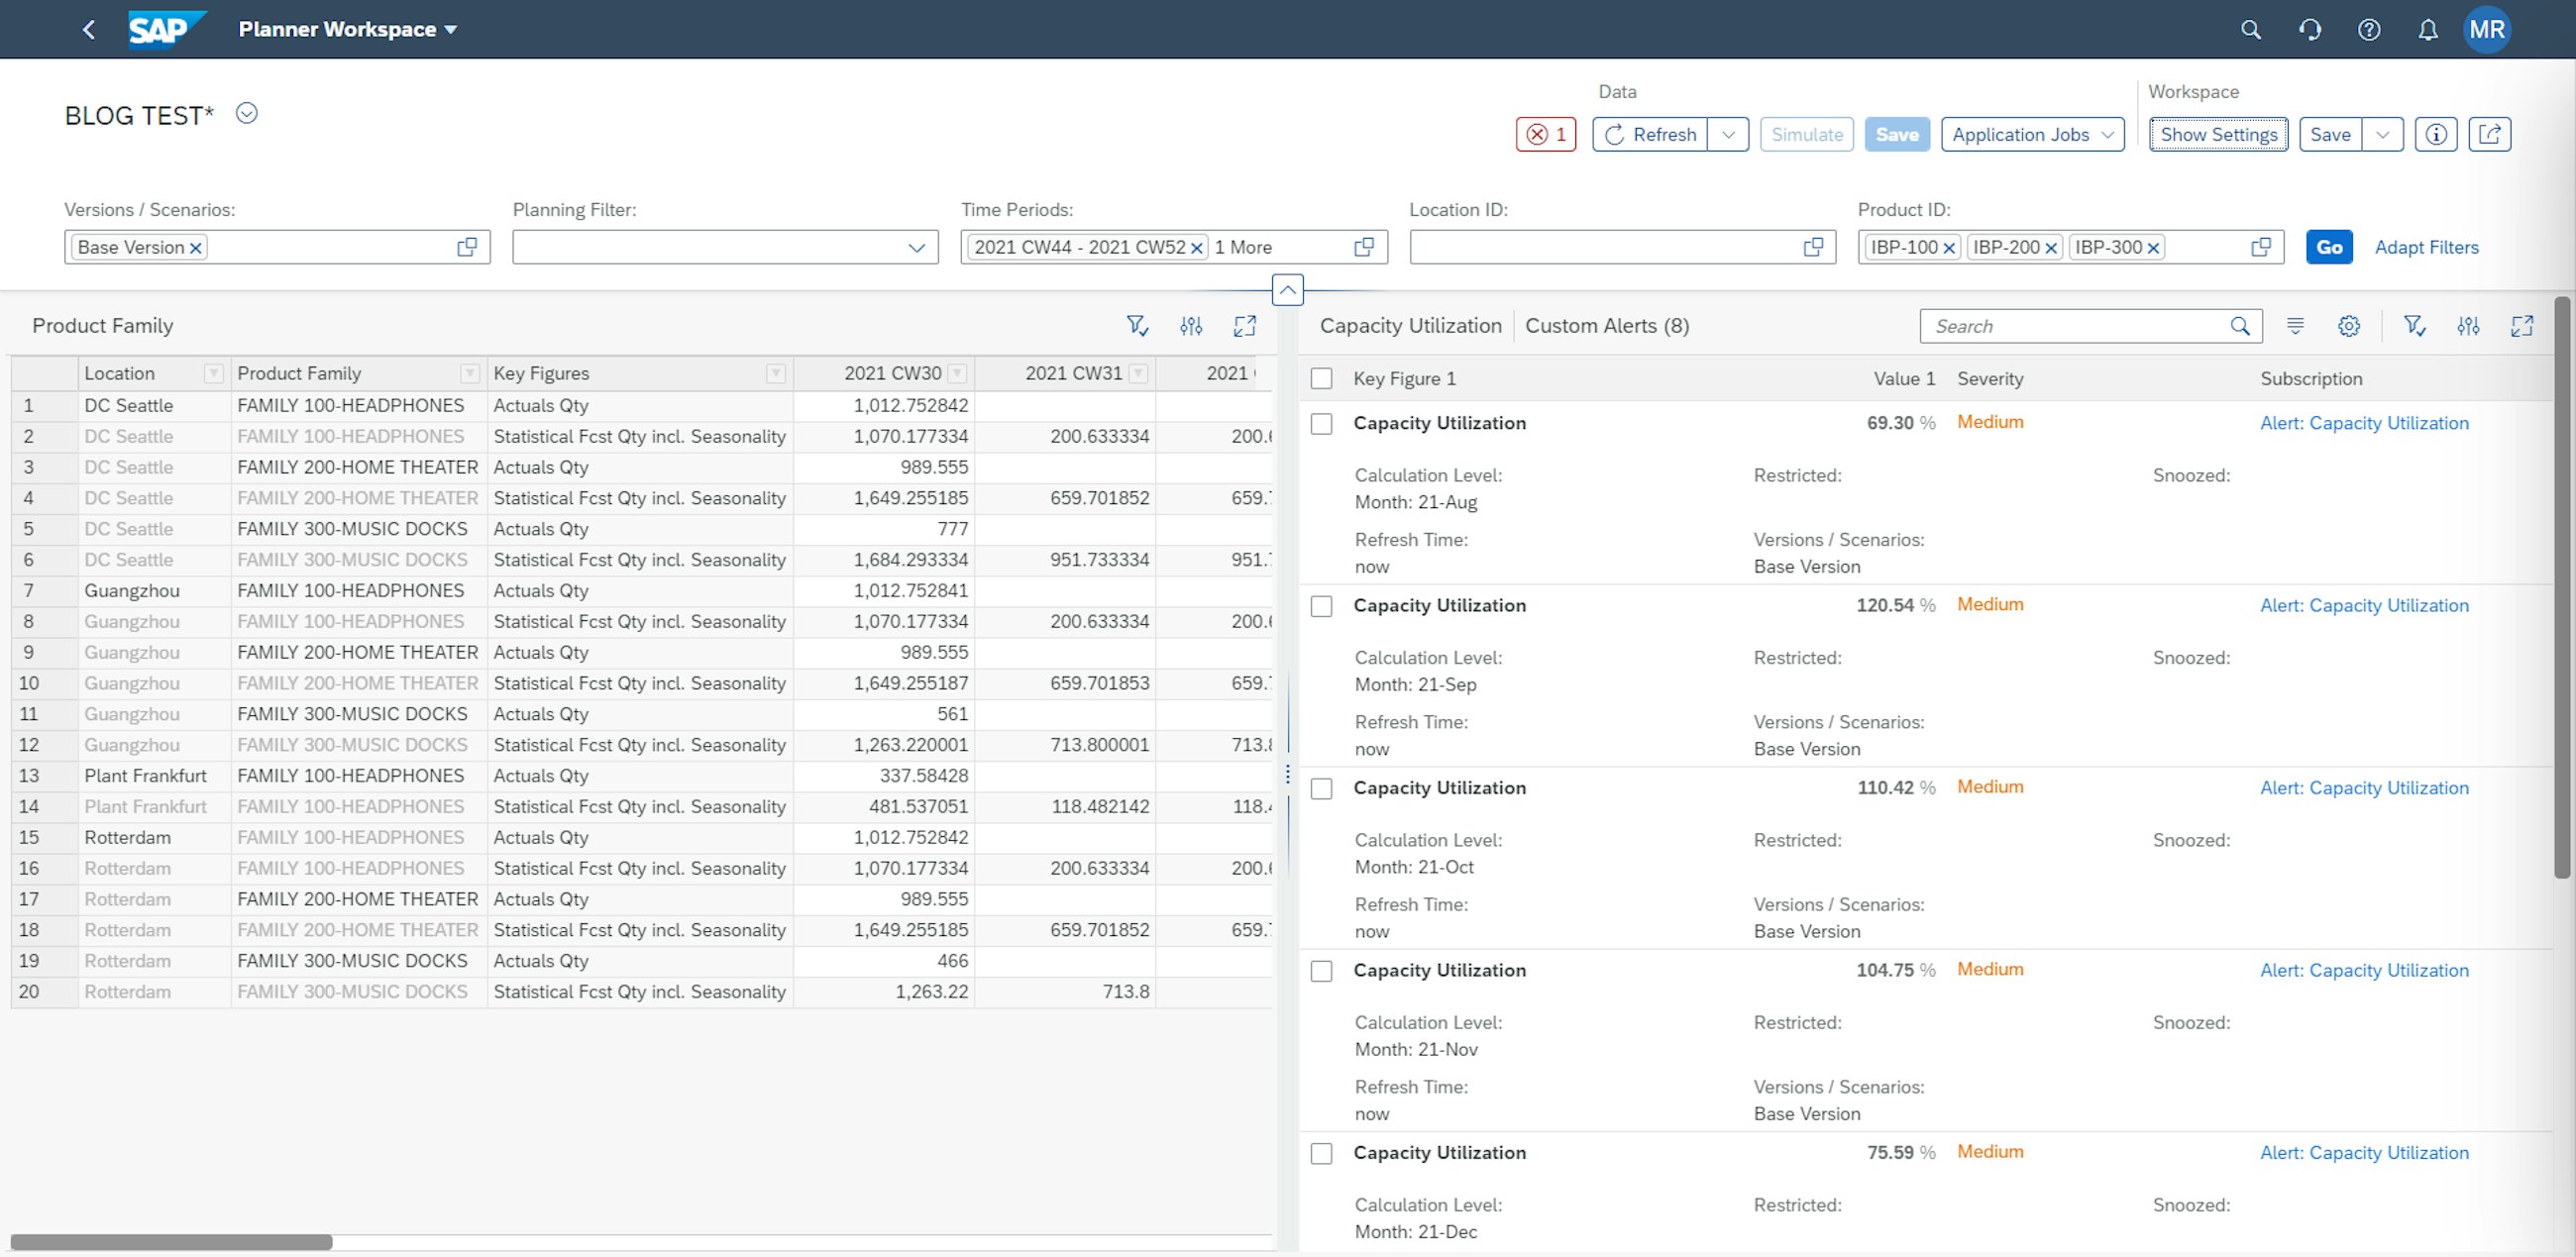
Furthermore, Planner’s Workspace provides the opportunity to create custom alerts or add already existing alerts, which can be highlighted in your planning view, thus enabling you to identify which key figures to investigate and to prioritise your time to solve any potential issues. The alert functionality increases the efficiency of planning as it becomes easier to navigate to the troubling planning challenges that require attention through usage of the alert’s functionality. The alerts can then be added to the advanced analytics app and viewed in any chart you assign it to in the dashboard functionality, enabling analysis of a planning view from an exceptions-based perspective.
Planner’s Workspace is a flexible way of sharing the plans with other users and creating new planning views for specific purposes that will enable a collaborative approach to solving the issues that span across departments and regions.
Detailed view of Planner’s Workspace with alerts to bring critical planning objects in focus.
Some of the key planning tasks performed in the Planner’s Workspace app are similar to the functionalities accessible in the Excel front-end such as changing the key figure data, simulating the effect of your changes in data, scheduling and running applications jobs and fixing and unfixing values of key figures.
You can also apply Planner’s Workspace together with the order-based planning. The new feature provides a link to external key figures stemming from the order-based planning and provides a direct navigation link to the corresponding order-based planning apps directly from the app.
Planner’s Workspace can be a great time saver for planners in the future as it is easy to access and use. Furthermore, aligning on the numbers and decisions can all be done in one UI with linkages to the order-based planning, so it is possible to go from a planning decision to executing the decision without having to change apps.
2. Improved housekeeping possibilities with the new Manage Planning Objects app
For the new 2108 release, SAP has made it a lot easier to clean and do housekeeping of your planning area ad hoc with the new Manage Planning Objects app, which has been introduced. The new app allows you to view newly created planning objects and delete planning objects that are obsolete for your planning area. For the 2111 release, SAP is also expecting to introduce the ability to create planning objects in the app, making it even easier to have one place where all planning objects can be assessed, created and deleted.
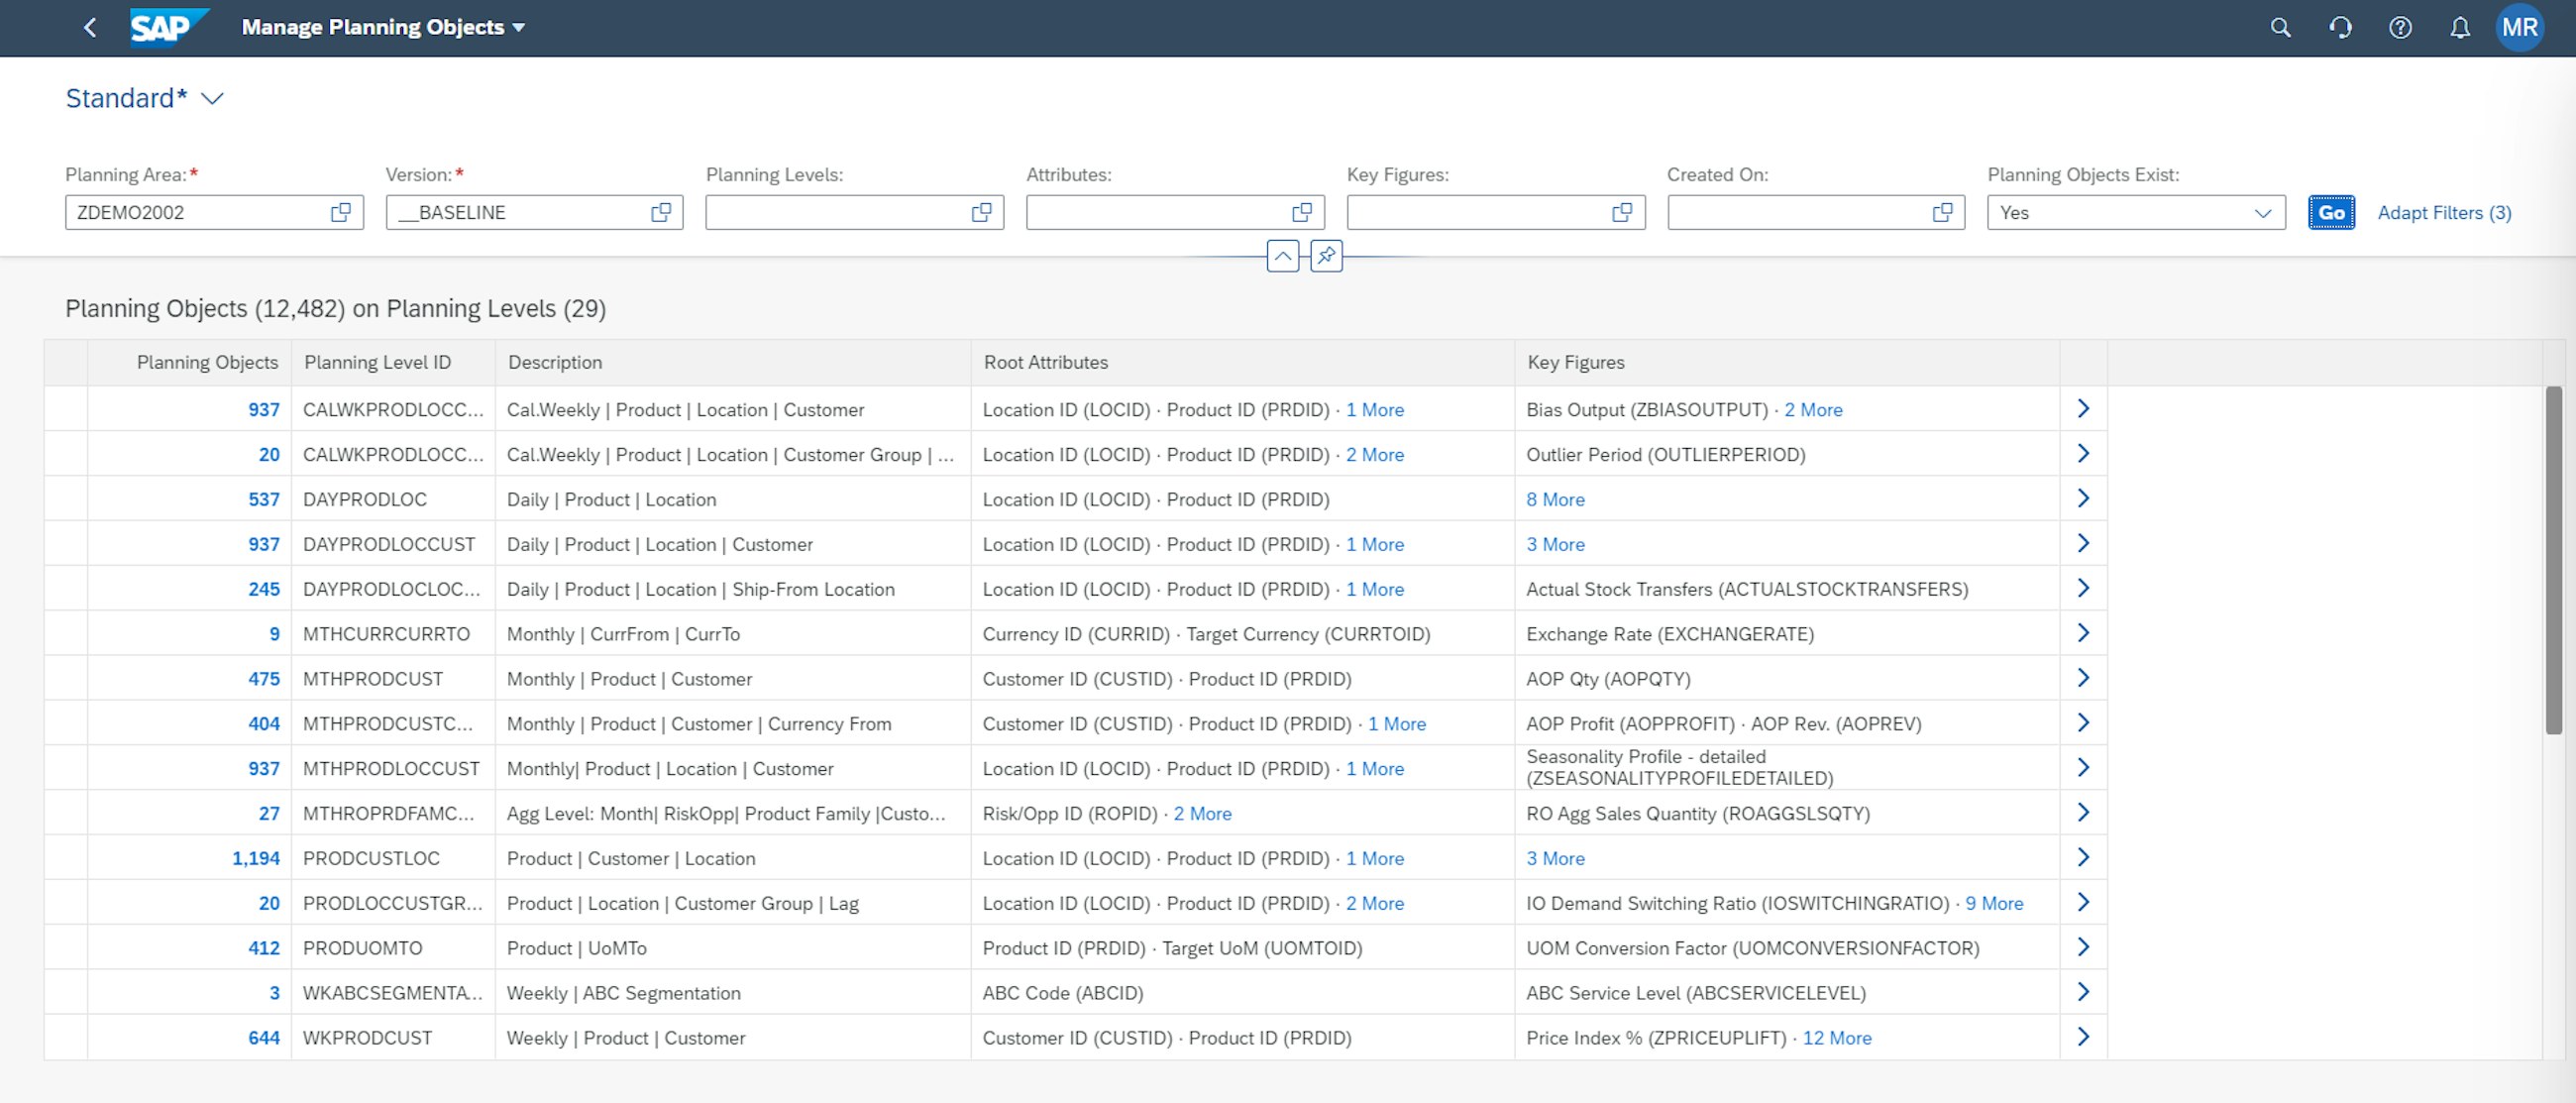
The new app helps you maintain your planning areas and display what planning objects have been created to see if a sudden increase has happened. This way, it is possible to ensure that no undesired increase in planning objects happens which may affect the performance. By using the filter option in the app, you can identify the amount of planning objects that exists for a specific selection on your planning level and navigate to the list of planning objects directly in the list. This option will also help you with analysing only the attributes that you find relevant for your analysis.
Overview of the Manage Planning Objects app, where all planning objects of a planning area can be analysed.
The new app helps with housekeeping within a planning area, and the typical usage of the new feature is concerned with:
- Seeing the increase in the number of planning objects that have been created within a specific time frame, e.g. in the last three weeks, to analyse if an unexpected growth has happened.
- Identification of obsolete planning objects – just like running the application job Purge Non-Conforming Data in the Application Jobs – e.g. planning objects that have not had any values in it for the last 12 months.
- Identification of existing planning objects for a planning level before one starts modelling a configurational change.
If you have ever had to delete planning objects separately in the Excel Add-in, the benefit of the app is clear. Currently, this is either done through the Manage Planning Objects function in the Excel Add-in where planning objects can be deleted one at a time, or alternatively, this is done through an application job where everything is deleted that has non-conforming data. With the new Manage Planning Objects function, it is possible to perform housekeeping activities and analyse the development of planning objects ad hoc or in a monthly process which is truly a lifesaver for the configurational experts out there also considering the performance of the system.
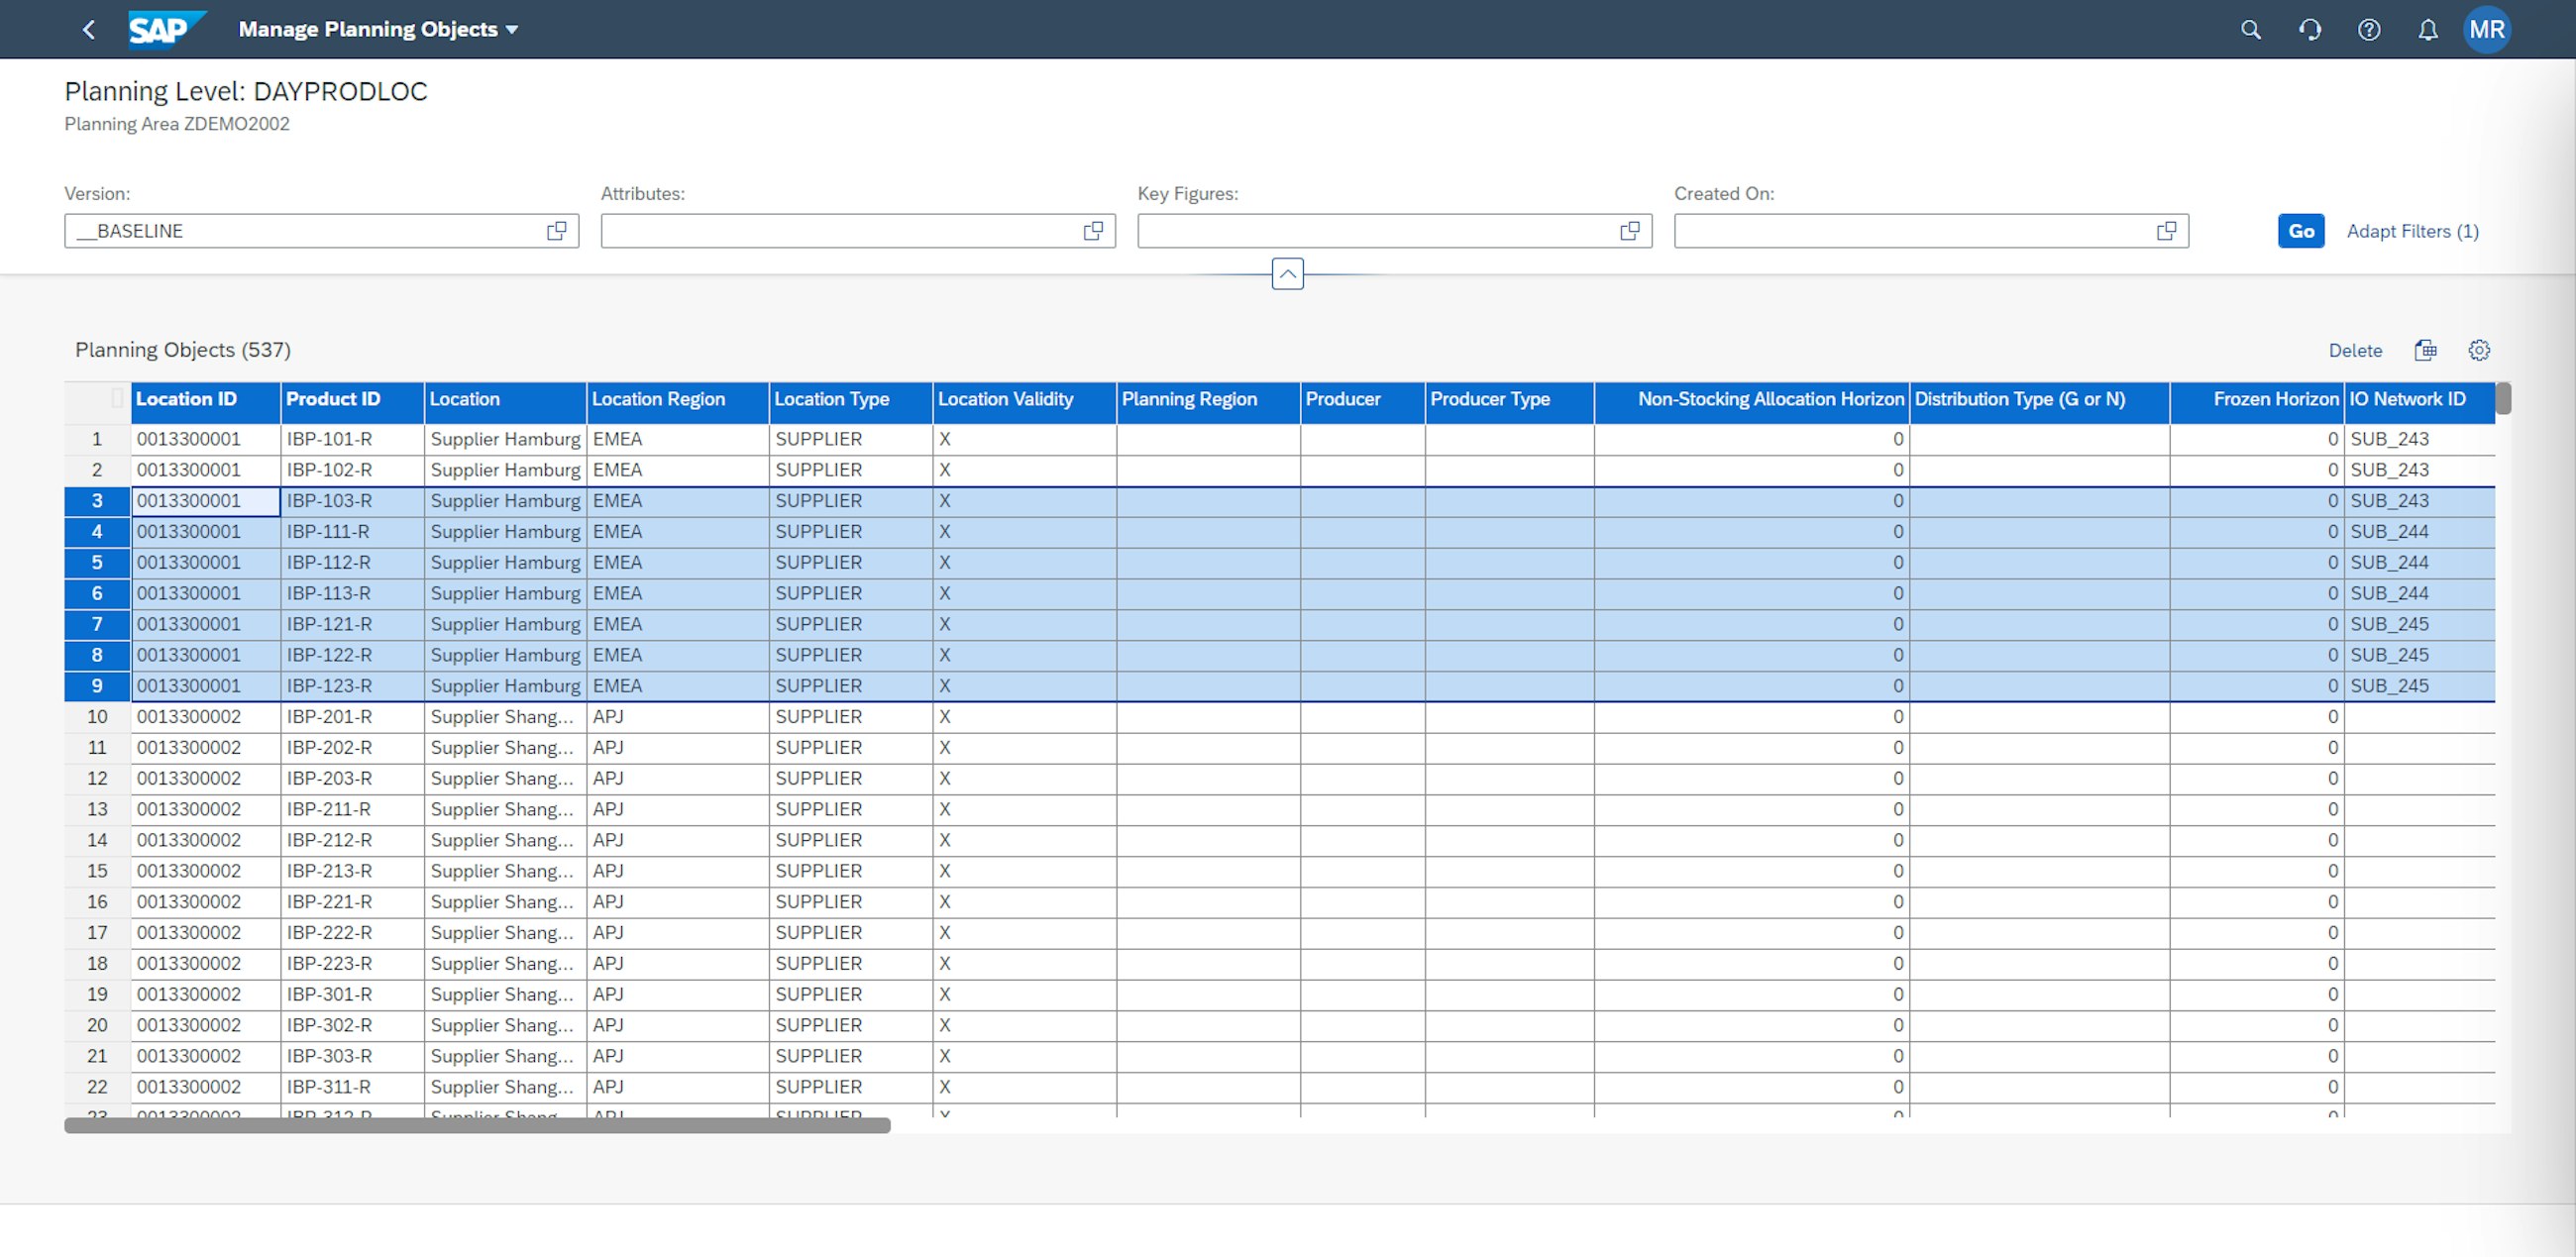
A more detailed view of the individual planning level can also be selected where obsolete planning levels can be deleted.
3. Enhancements to time-based disaggregation in various time dimensions
One of the things that we have been eager to present to our clients and has been demanded by planners in multiple companies is now ready! With this release, SAP has now made it possible for planners to edit a key figure value for the current period at an aggregated level, e.g. quarterly level, even if the period is only partially editable.
Imagine that we are now in August 2021 and our planning view for the S&OP process is in quarterly buckets looking several quarters ahead. The planner task is to adjust the forecast with last-minute input from sales, so it is included in this quarter’s forecast due to major changes in customer behaviour. The adjustable key figure is stored at a monthly level, and it is editable in the current and future periods according to the configuration of the key figure in the Planning Areas app. Until now, it has not been possible to change the key figure on an aggregated level, but now the values entered in the key figure will be distributed to the remaining periods in the quarter.
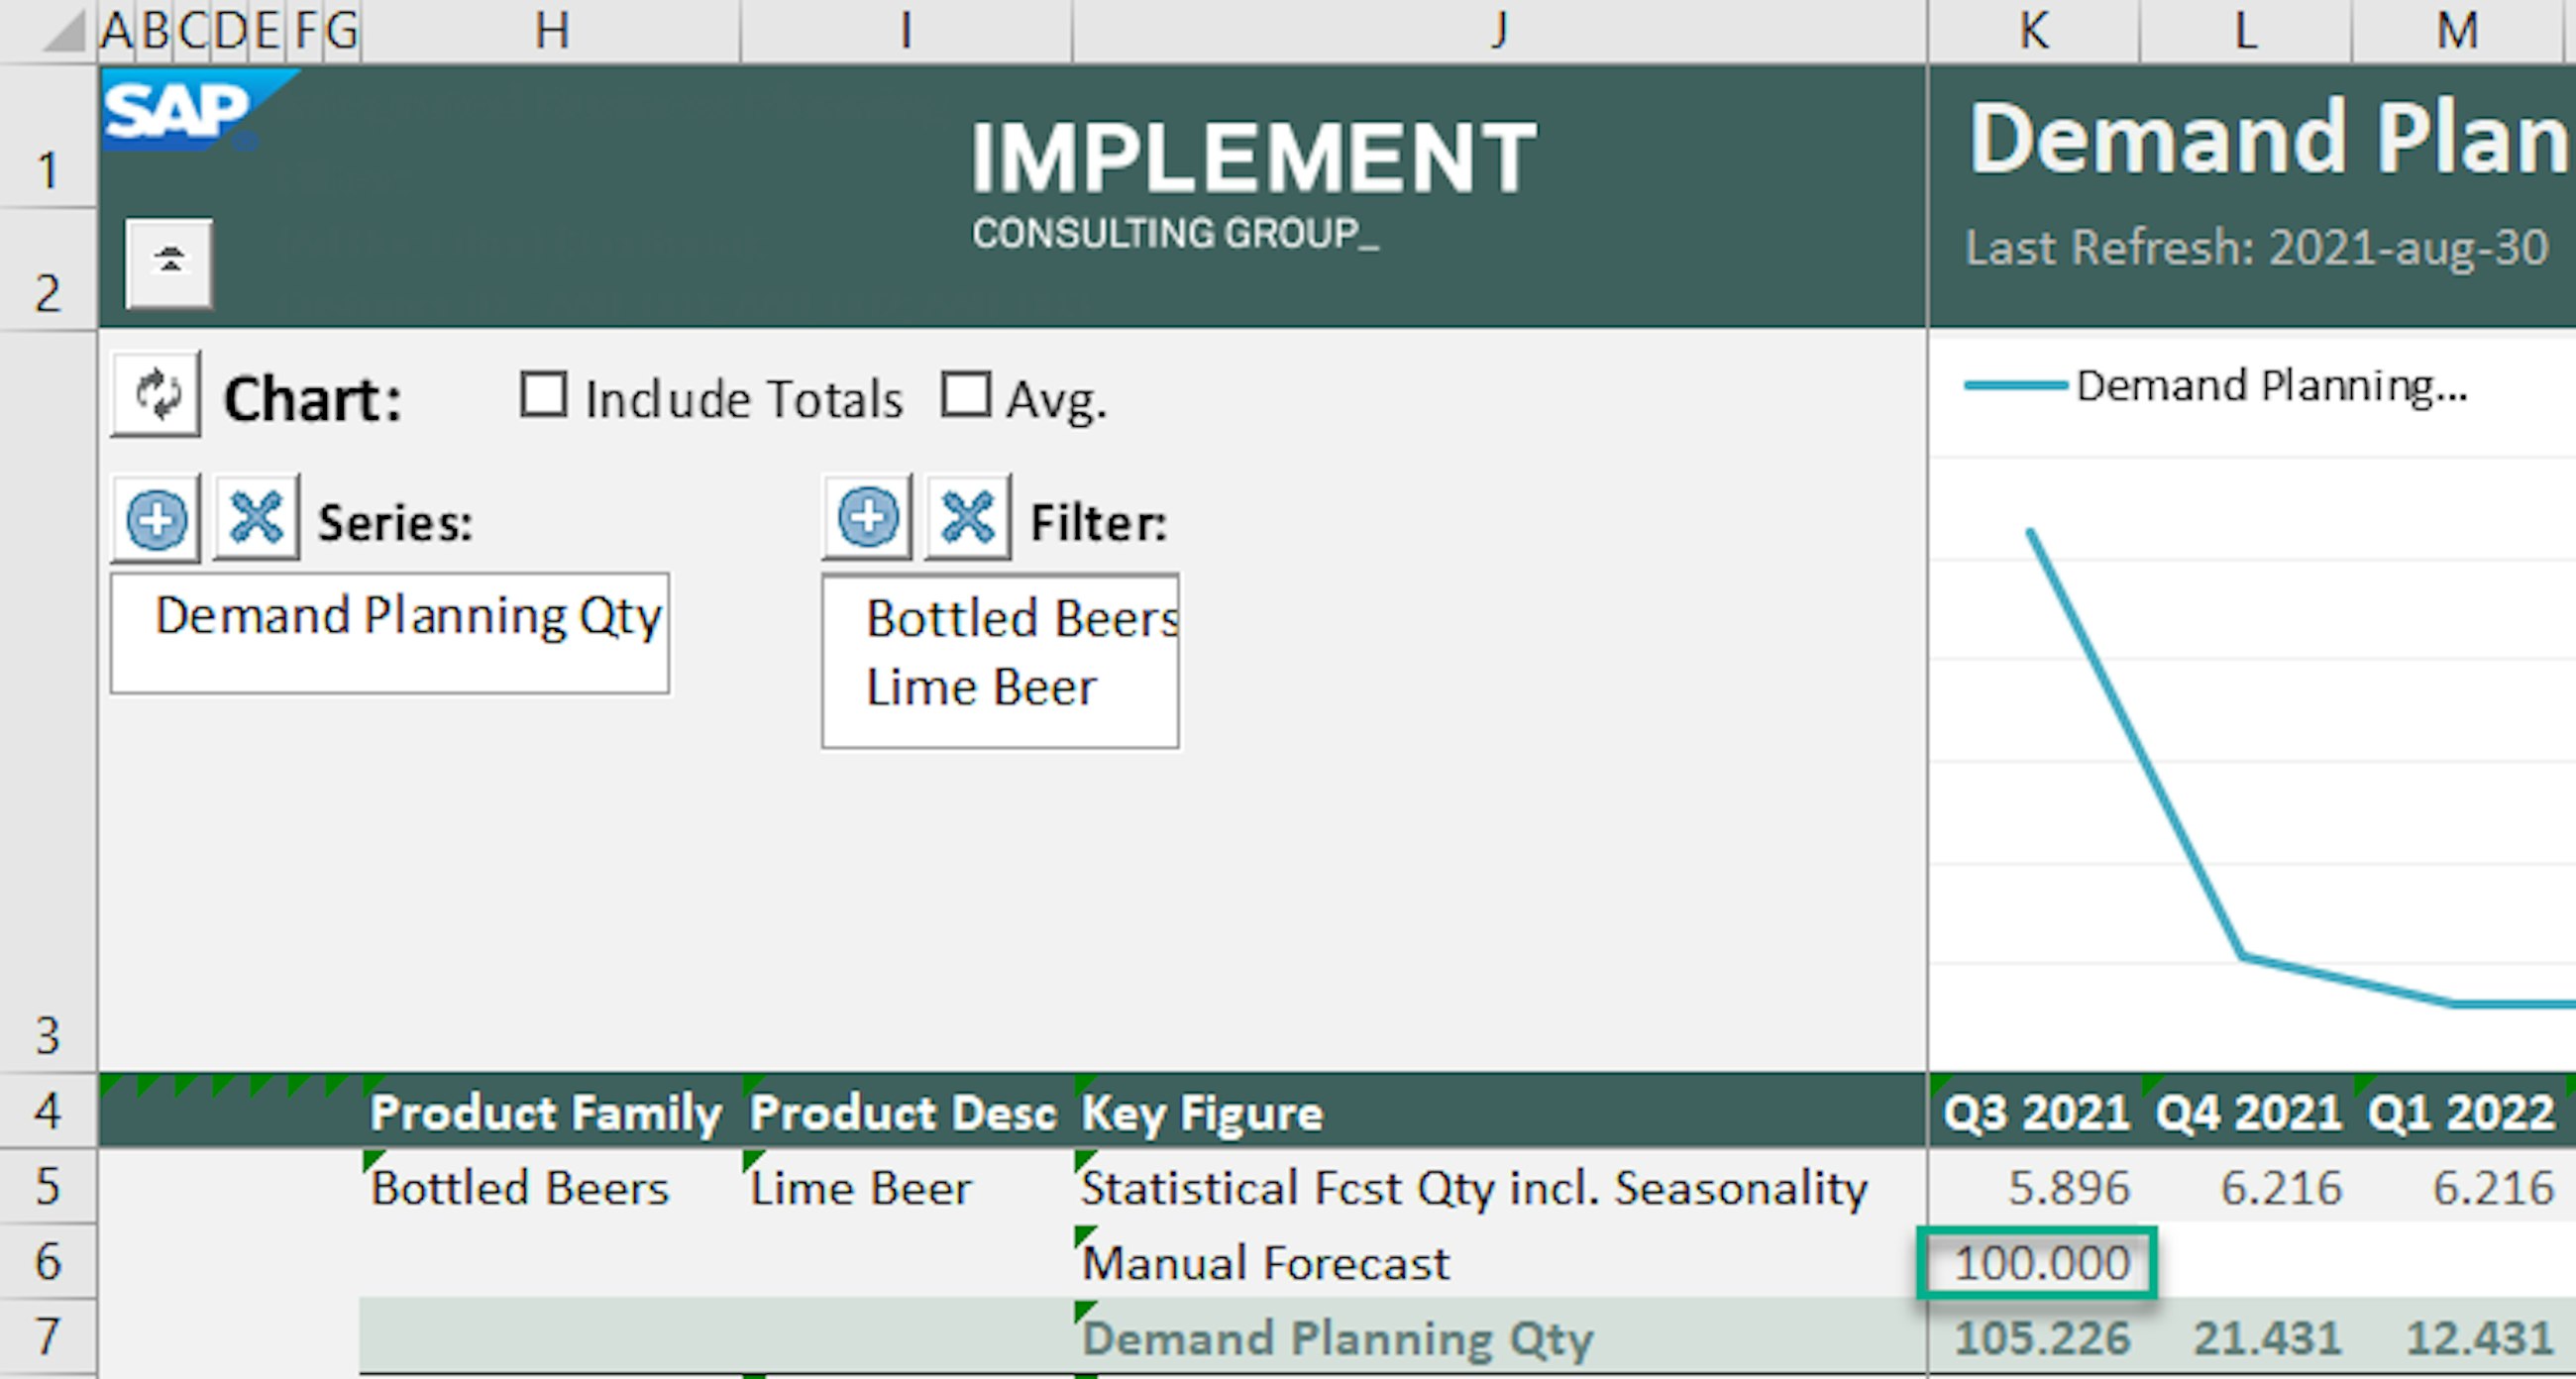
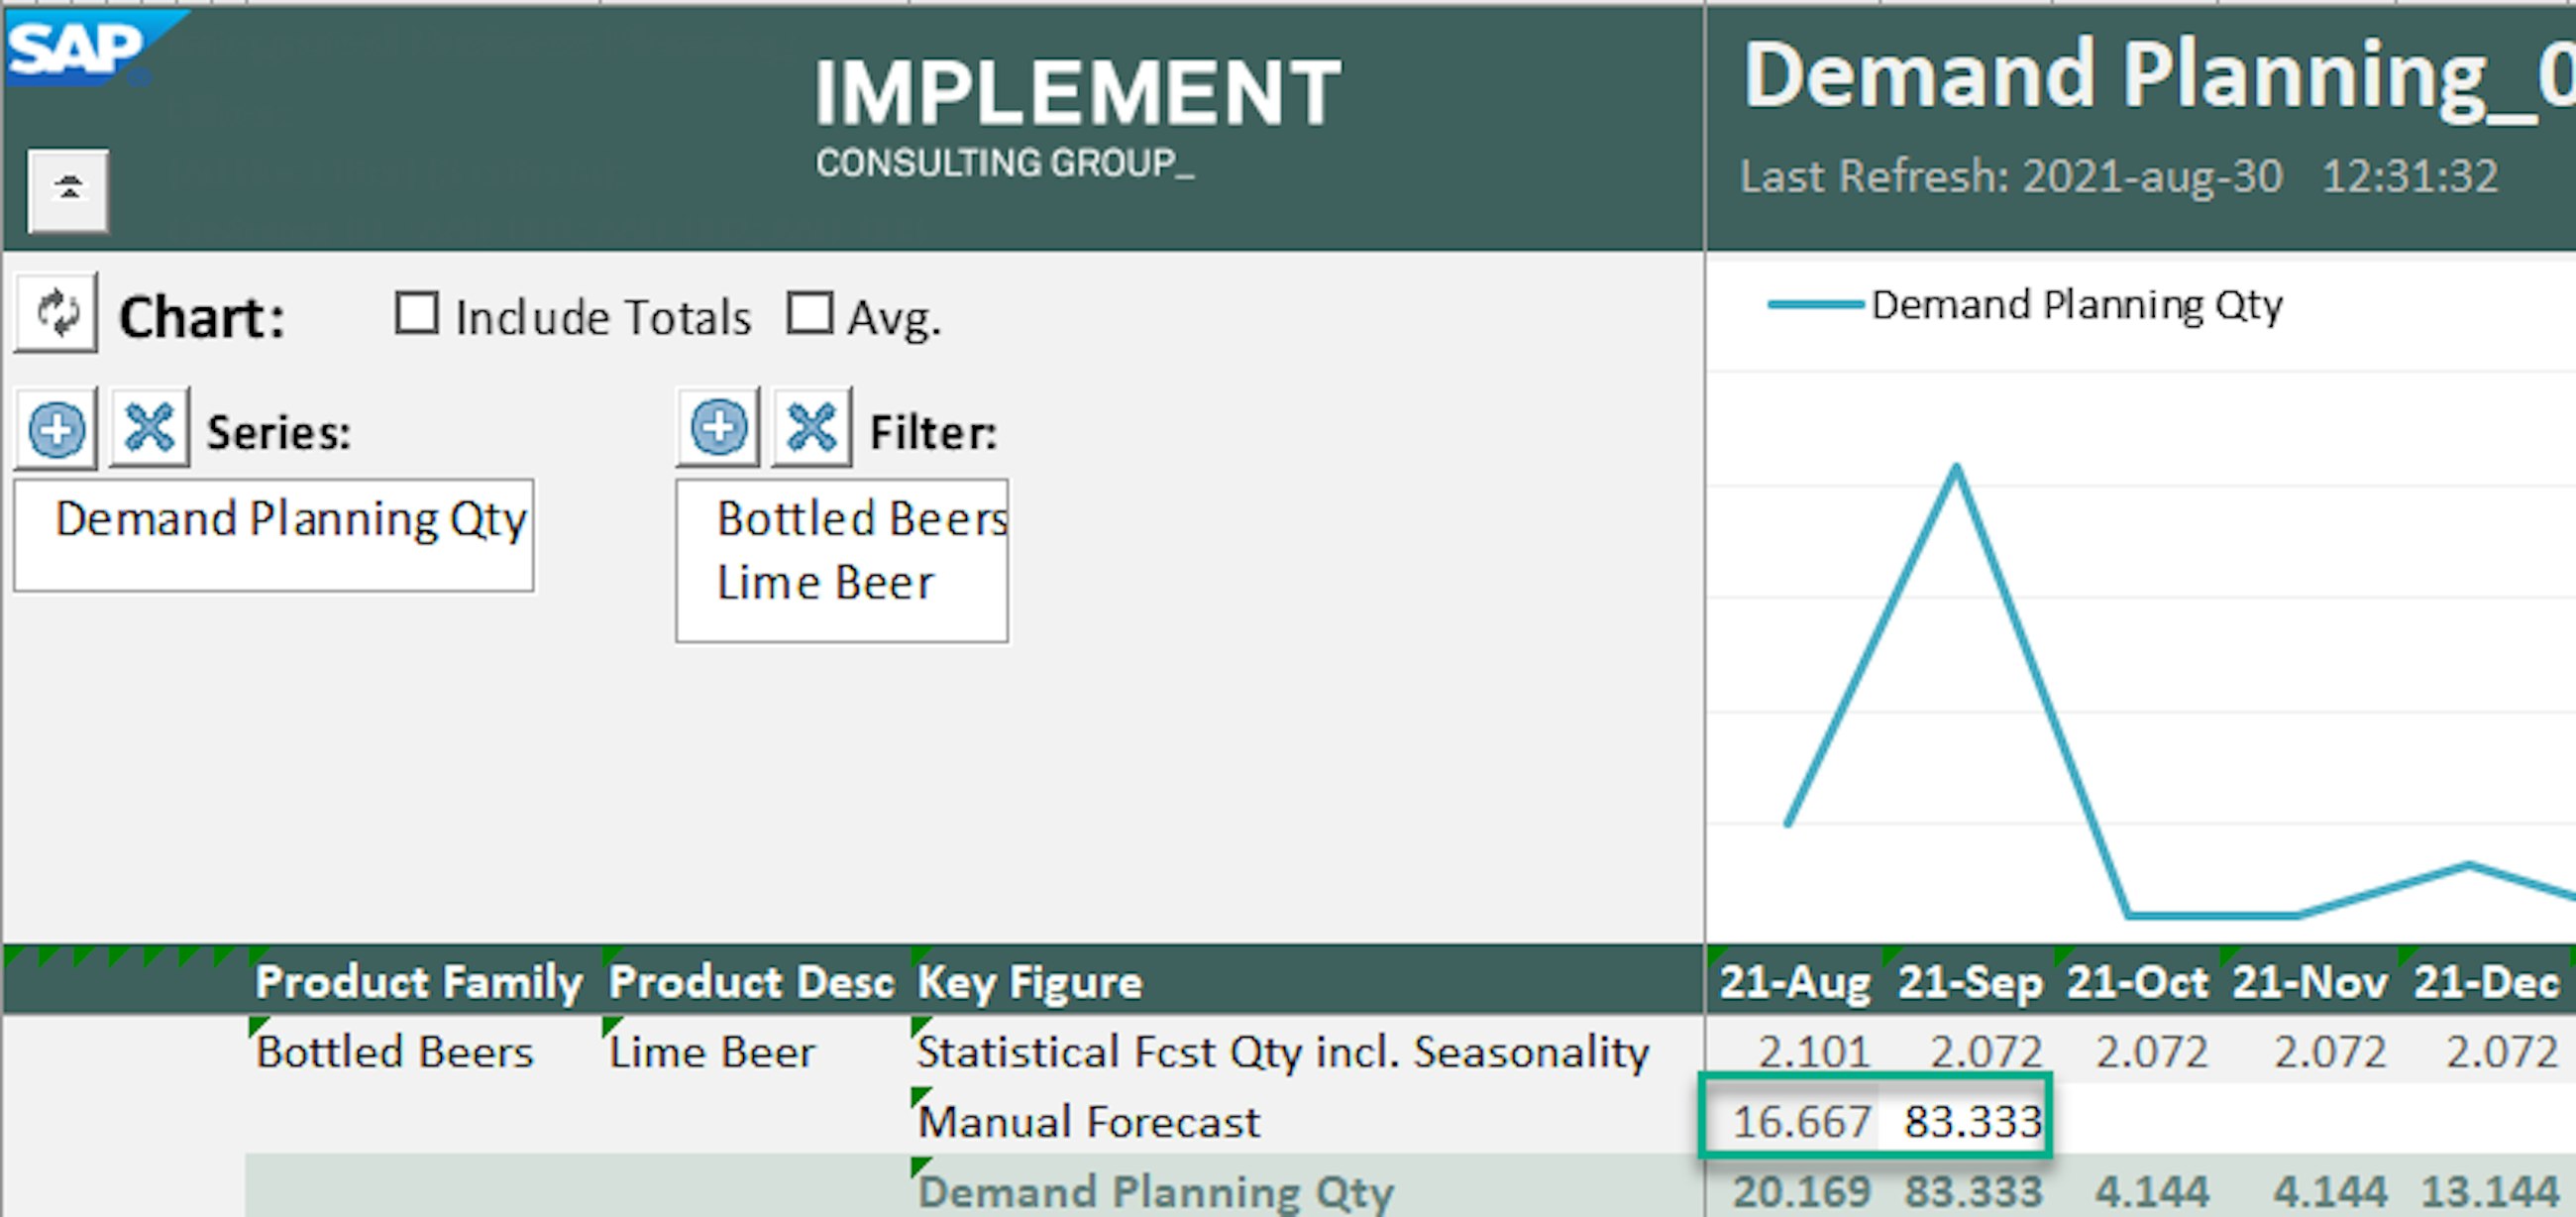
The changes to the key figure values at an aggregated level are disaggregated based on the periods remaining in the quarter.
We see this as a significant improvement for planners, as they now can adjust the key figures in the near future without changing the time buckets for planning.
For the functionality to work, you must have the latest Excel plug-in installed, and the time-based disaggregation to partially editable child nodes is currently not supported by the Web-Based Planning nor the Planner’s Workspace app.
4. Improved user-friendliness when analysing change history
SAP IBP offers various ways of collaboration across the organisation which provides the possibility of getting the right inputs from the right persons. The use of change history is a key to continuously improving the planning processes and reducing risks of making the same mistake twice. If for example a forecast can be amended by various stakeholders in the organisation, planners sometimes need to trace where the amendments came from in order to prepare for the demand review meetings.
With this upgrade of SAP IBP, the Change Analysis application has gained a facelift with improved functionalities. The app has gotten enhancements in the effects view and the original view of the Change History Analysis, where the following changes are:
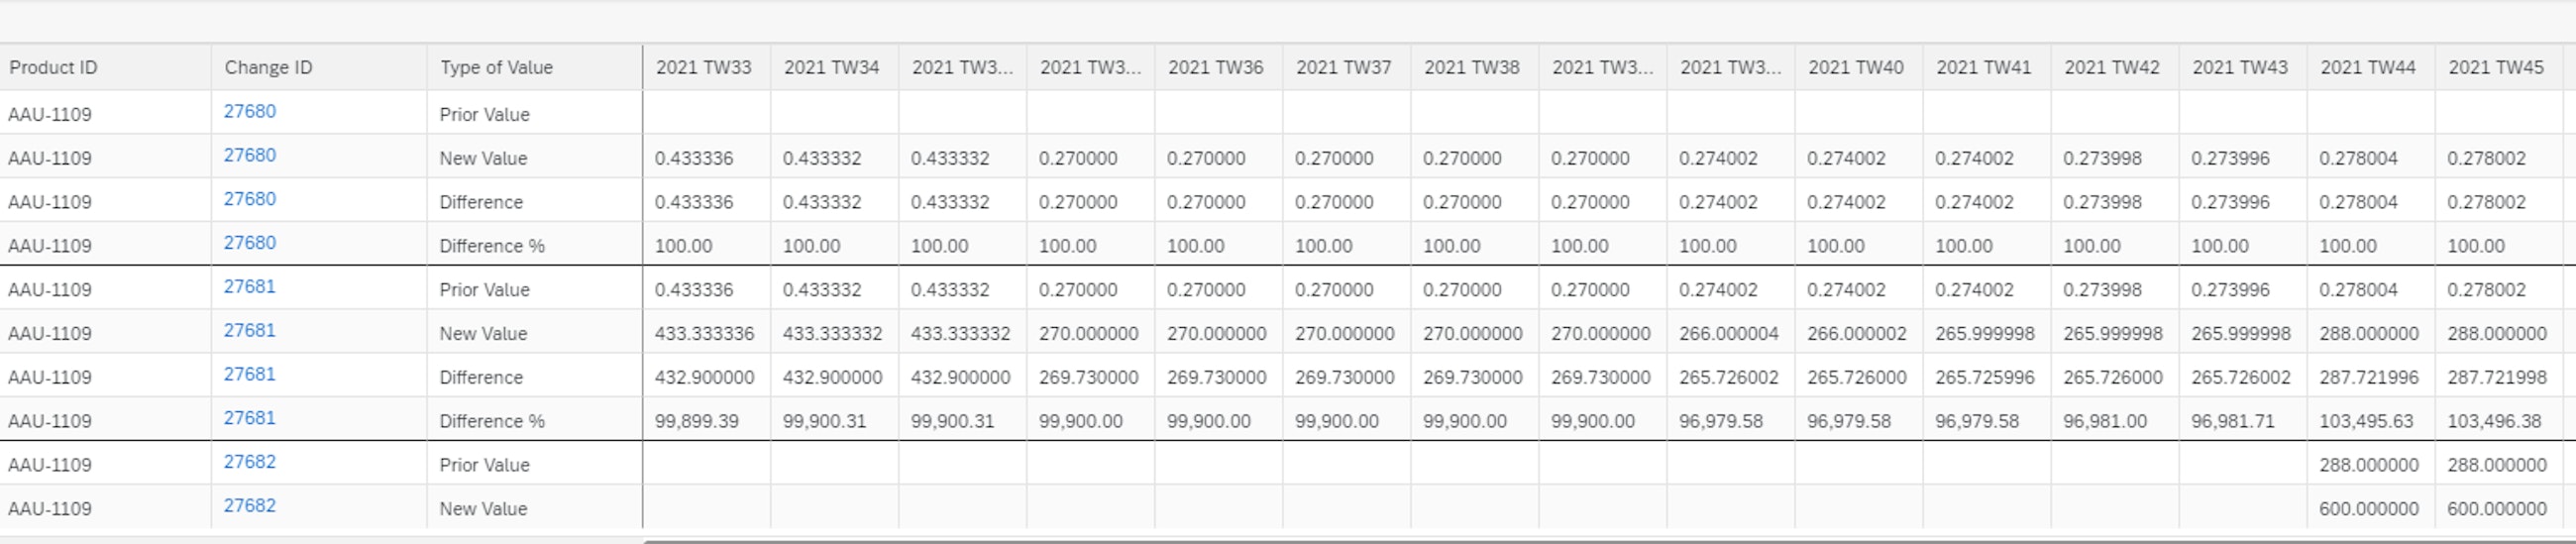
Values in the following columns are no longer exported as strings but as numbers:
- Prior value
- New value
- Difference
- Difference %
More detailed information is now available in the Change History app
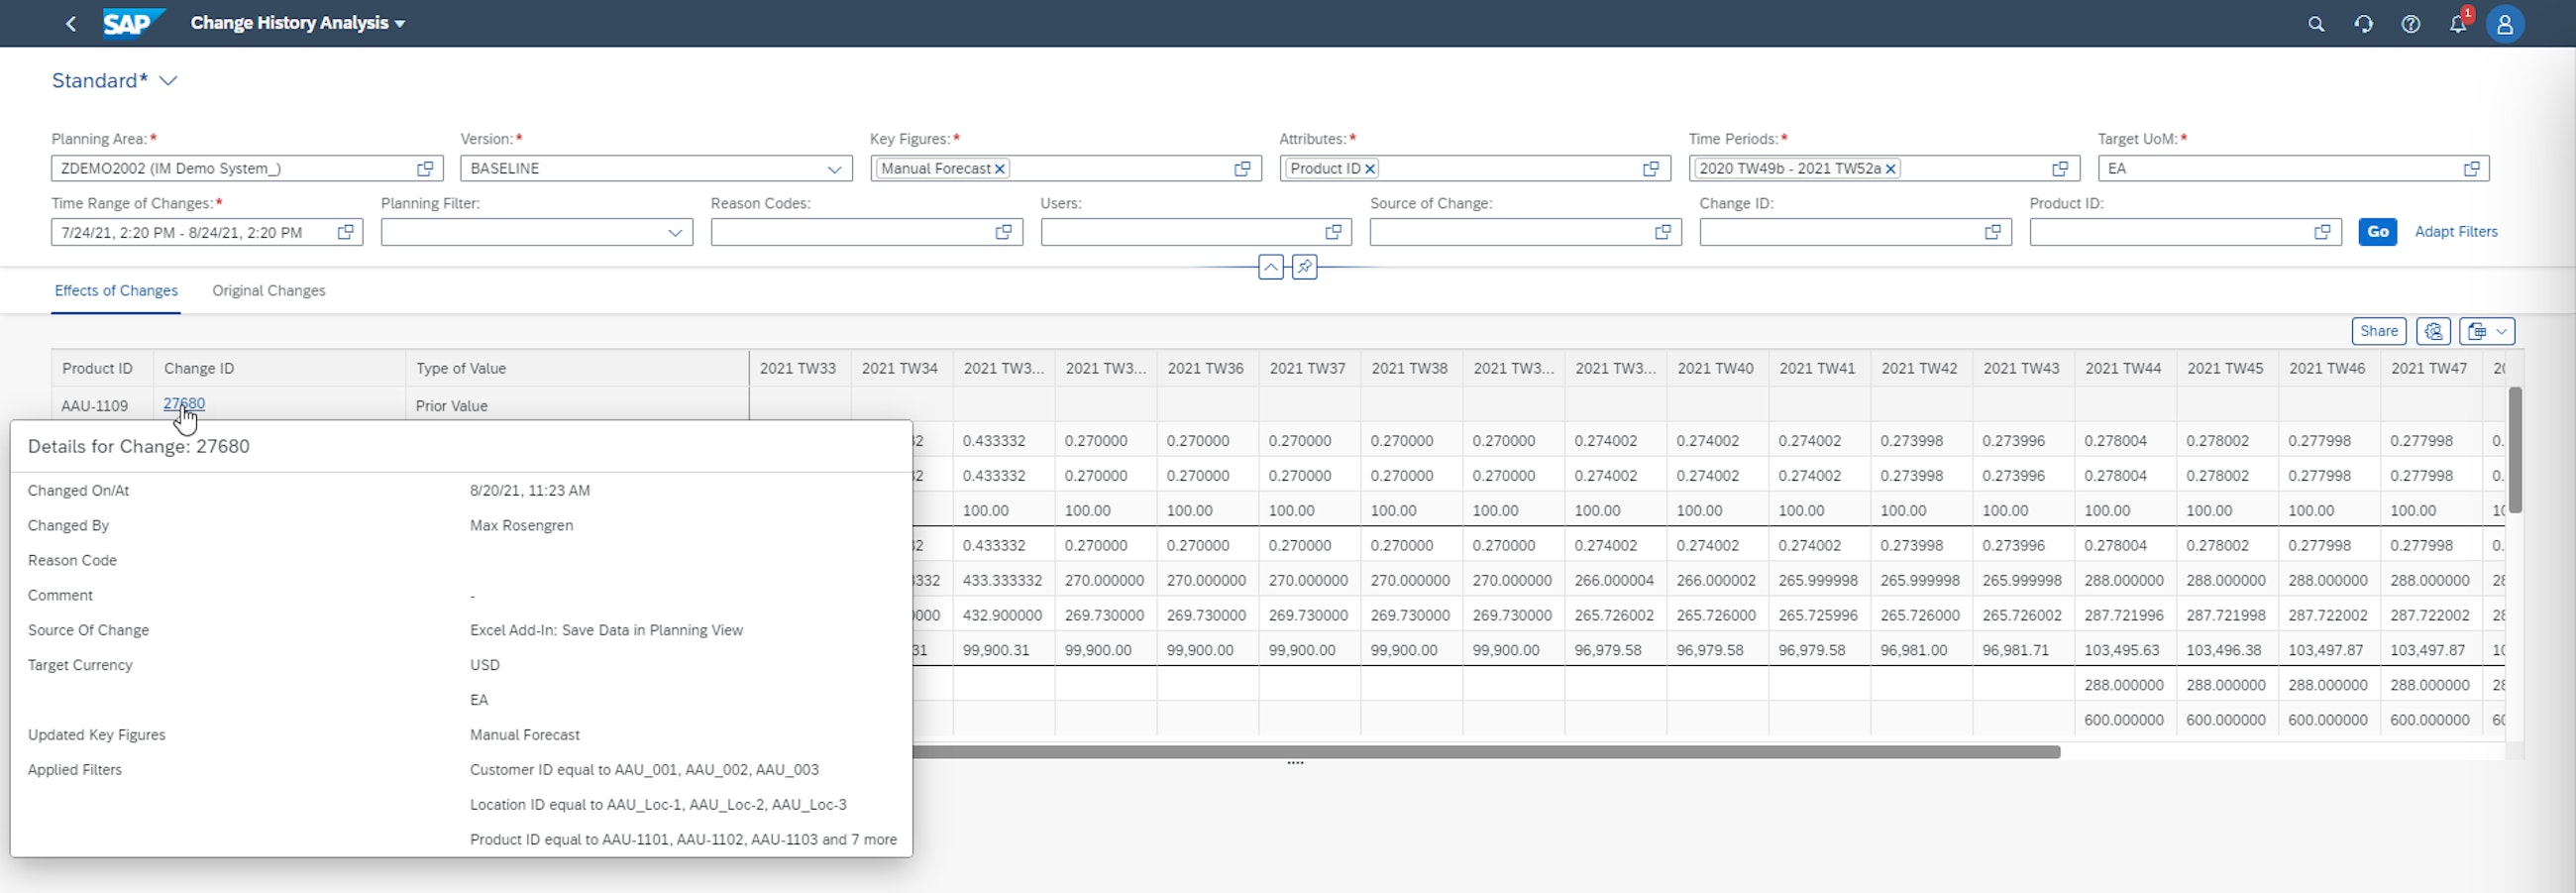
In addition to this, planners can now, when cursing over the change IDs, find more information about manual changes such as the updated key figures, the target UoM or target currency for conversion-relevant key figures and the applied filters for sub-changes.
Not only the values have gained attention from SAP, but also the layout of the app itself. The changes can be viewed on a horizontal time axis as you know the Excel UI. We see this as a big support to help planners work more effectively when analysing change history, especially if they are used to the user interfaces from the Excel UI or the Web-Based Planning app as we wrote about in our blogpost for the 2102 release.
The change history is now more user-friendly and similar to other UIs in SAP IBP
5. Let IBP calculate the impact of independent variables on your forecast
Some of the key questions for supply chain experts are how the planning systems can support their daily tasks and free up capacity for planners without compromising the quality of their plans. When making the best possible plan, supply chain planners are using experience and knowledge about their markets to make “the best man’s best guess” about the future. With the variable impact analysis by multiple linear regression, planners can now use IBP to compare results and see for example how the quantities of promotions and the outside temperature each will impact the calculated forecast.
Linear regression is an approach to modelling the linear relationship between a dependent variable, e.g. the statistical forecast and one or more independent variables such as price, temperature or GDP. The forecast depends on the future values of these independent variables which are known or can be estimated. IBP looks for coefficients to multiply the independent variables with, thus getting results that are as close to the historical values as possible. This way, it can predict the future values of the independent variables and calculate a forecast for the future that takes these variables into consideration.
You specify what the system should analyse in the Manage Forecast Models app
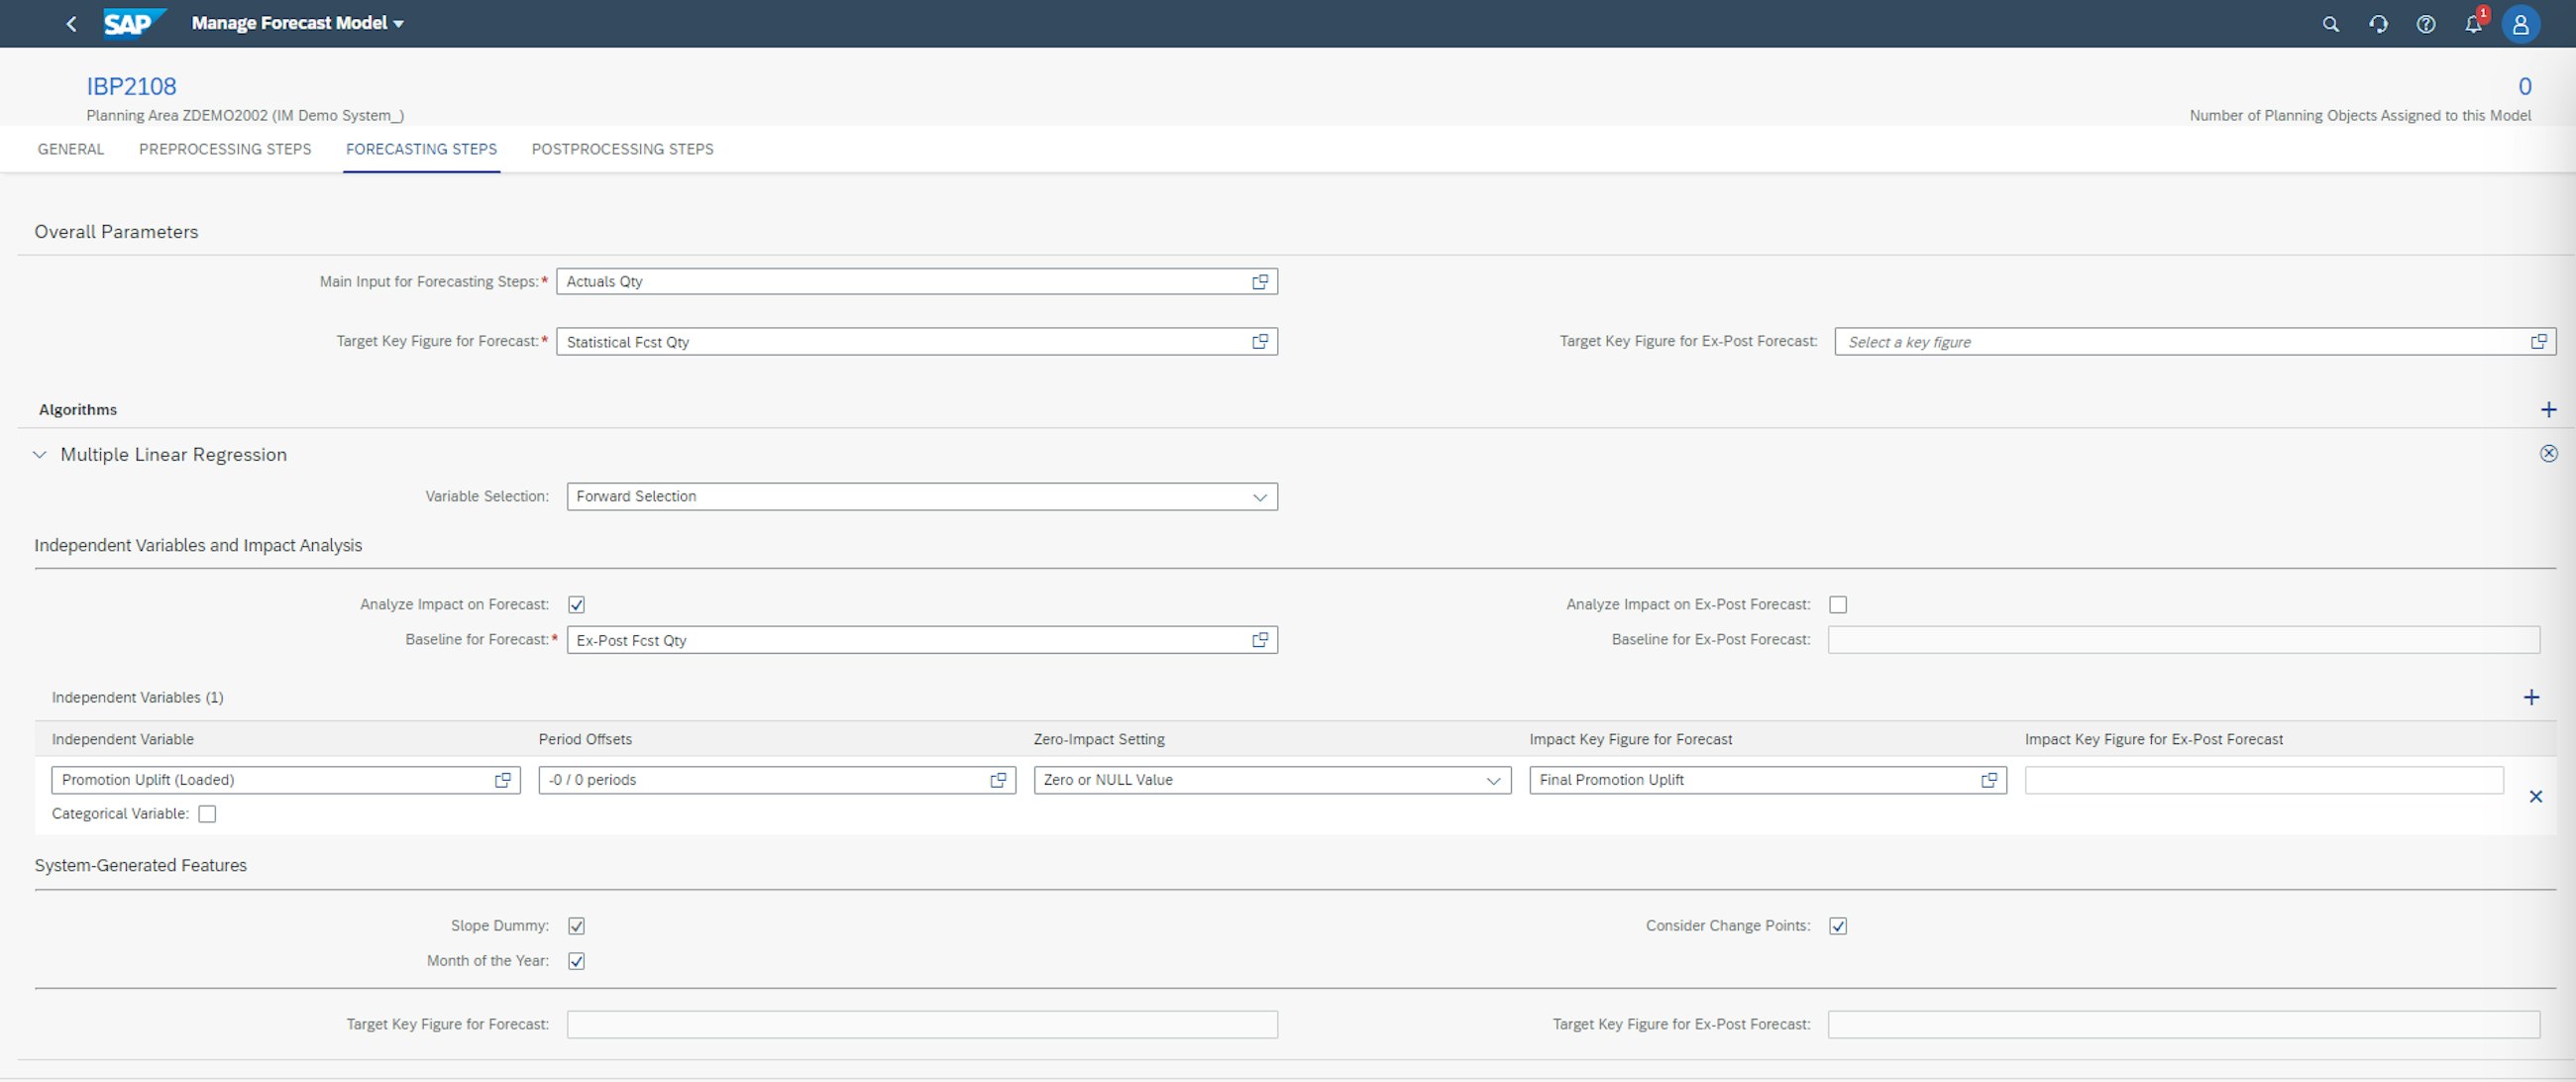
One use case that we often see in companies is that clients want to analyse the impact of a promotion on their forecast. The key figures chosen to store the impact of the promotion will show how many litres, pieces or the like were forecasted due to the promotion. It is possible to set the multiple linear regression algorithm in the Manage Forecast Models app to calculate the impact of each selected independent variable on the forecast and, optionally, the ex-post forecast. The analysis can be run both on categorical and non-categorical variables.
We see this as a huge improvement to forecasting, and something that can add value to decision-making when evaluating and reviewing forecast performance and future events impacting the baseline forecast.
Read our previous blog posts 12


Article
Read more

New features of SAP IBP 2011
Five selected features of the 2011 upgrade of SAP IBP.Article
Read more

New features of SAP IBP 2008
Five selected features of the 2008 upgrade of SAP IBP.Article
Read more

New features of SAP IBP 2005
Five selected features of the 2005 upgrade of SAP IBP.Article
Read more

New features of SAP IBP 2002
Five selected features of the 2002 upgrade of SAP IBP.Article
Read more

New features of SAP IBP 1911
Five selected features of the 1911 upgrade of SAP IBP.Article
Read more