Article
Five selected features of the 2105 upgrade of SAP IBP

Published
26 May 2021
In May 2021, SAP released the 2105 upgrade of SAP Integrated Business Planning (IBP). Just as the previous releases, we have compiled a staff-picked list of five features of the IBP 2105 upgrade that we think your company can benefit from and that can leverage your supply chain planning to the next level.
Five selected features of the 2105 upgrade of SAP IBP
1. Solve your supply chain issues with a Procedure Playbook
If you want an effective S&OP process, one key success factor is to keep the deadlines and adhere to the process steps of the S&OP cycle. However, as a planner you sometimes experience challenges or encounter problems that you cannot solve yourself, especially if you do not know where to find the guides or documentation for solving these.
With the new Procedure Playbook app, you can now define standardised procedures for solving issues in your S&OP process and share them with other users. The Procedure Playbook helps users get an overview of the issues, the reasons for the issues and the activities and actions that can be taken to resolve them. Furthermore, the Procedure Playbook is now attached to the identified issues, which makes it easy for the users to find instructions on how to solve them.
When an issue is detected, e.g. in a custom alert, users with whom the Procedure Playbook has been shared can use the playbook while trying to resolve the issue. The Procedure Playbook provides information about the activities and actions that need to be taken to resolve the identified issues, e.g. if a custom alert highlights a problem.
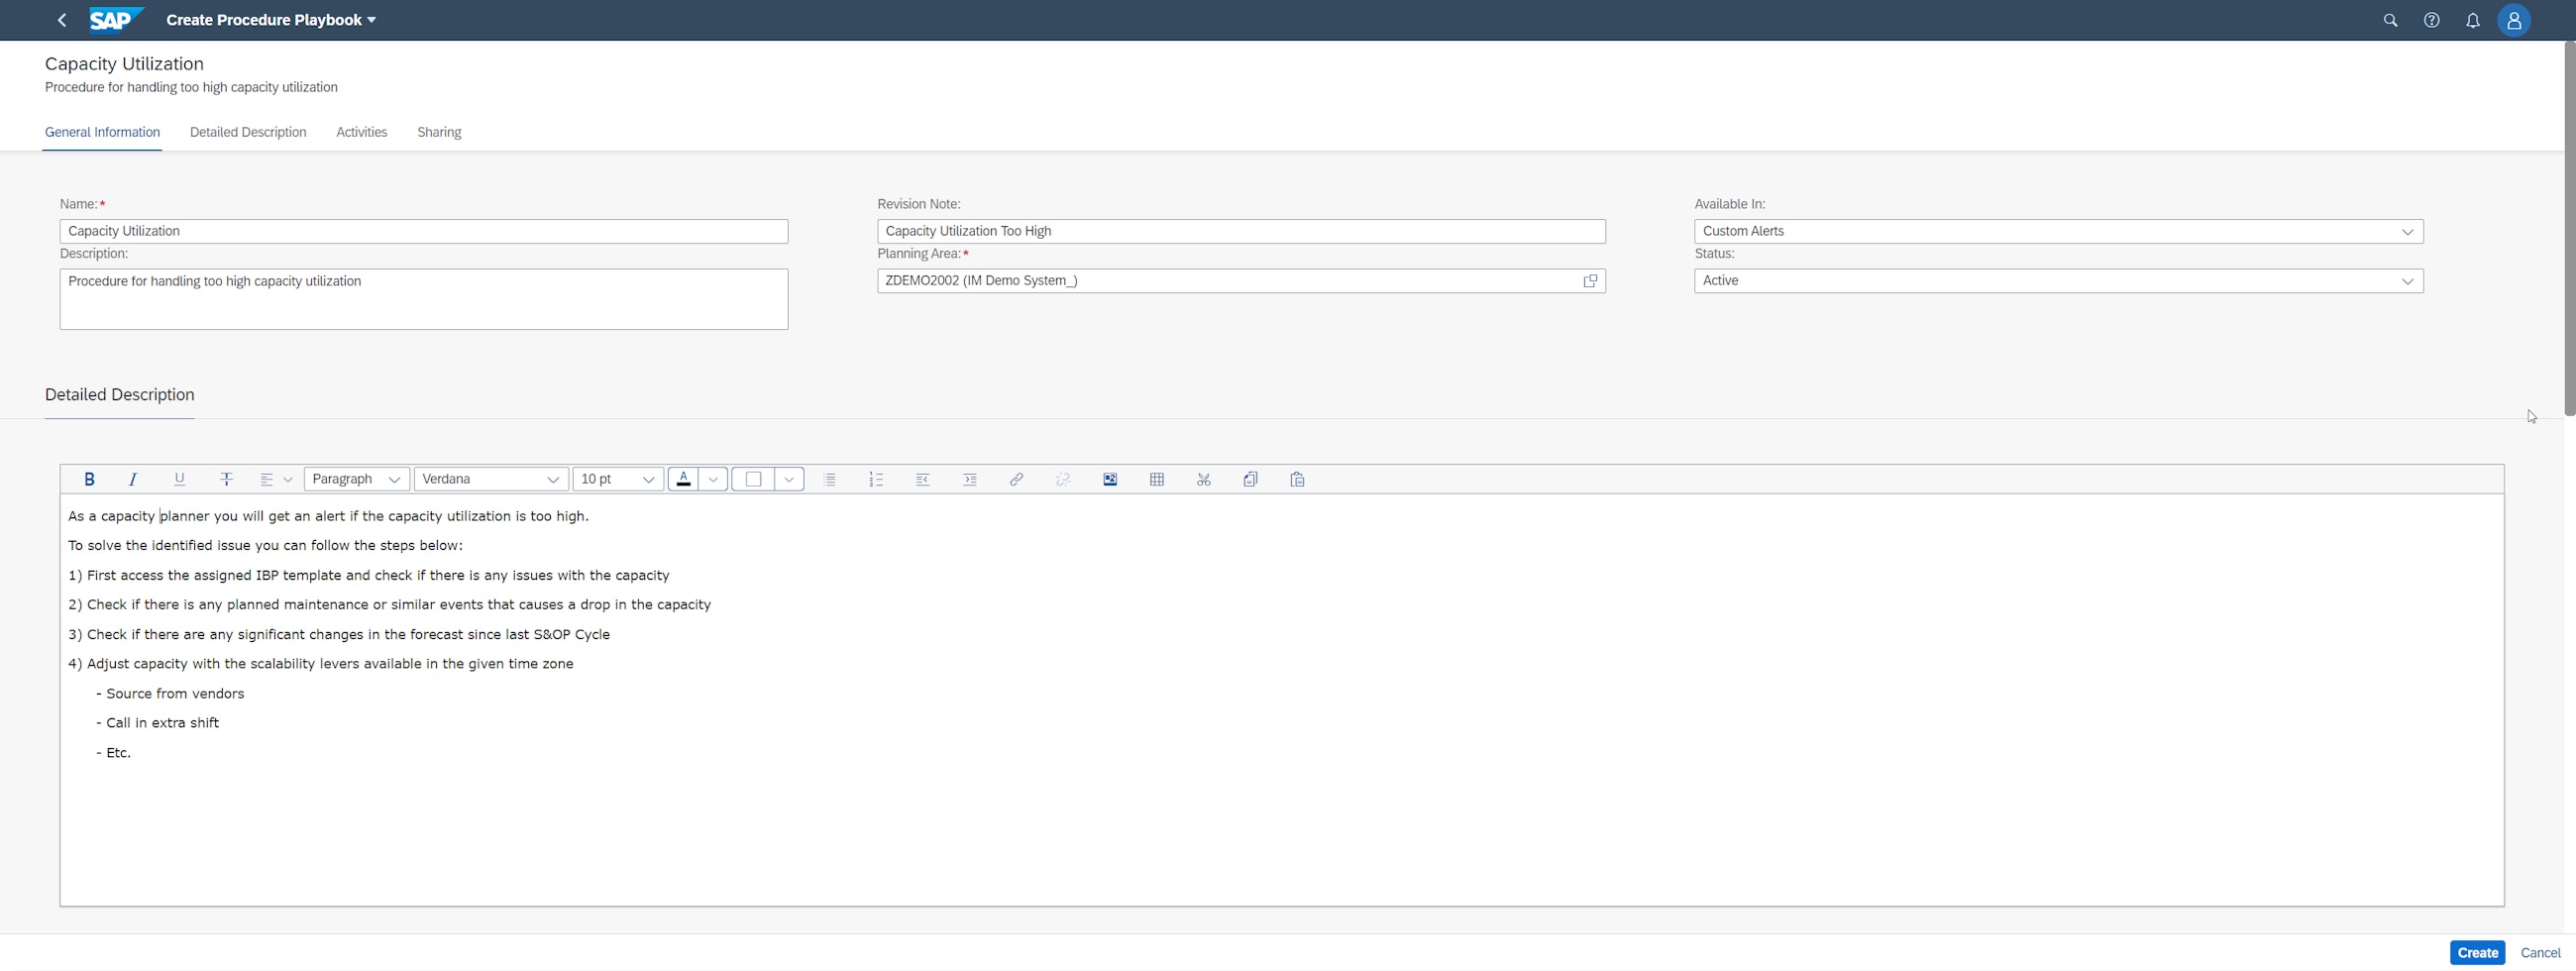
The Procedure Playbook contains different types of information such as images, text and hyperlinks to relevant material.
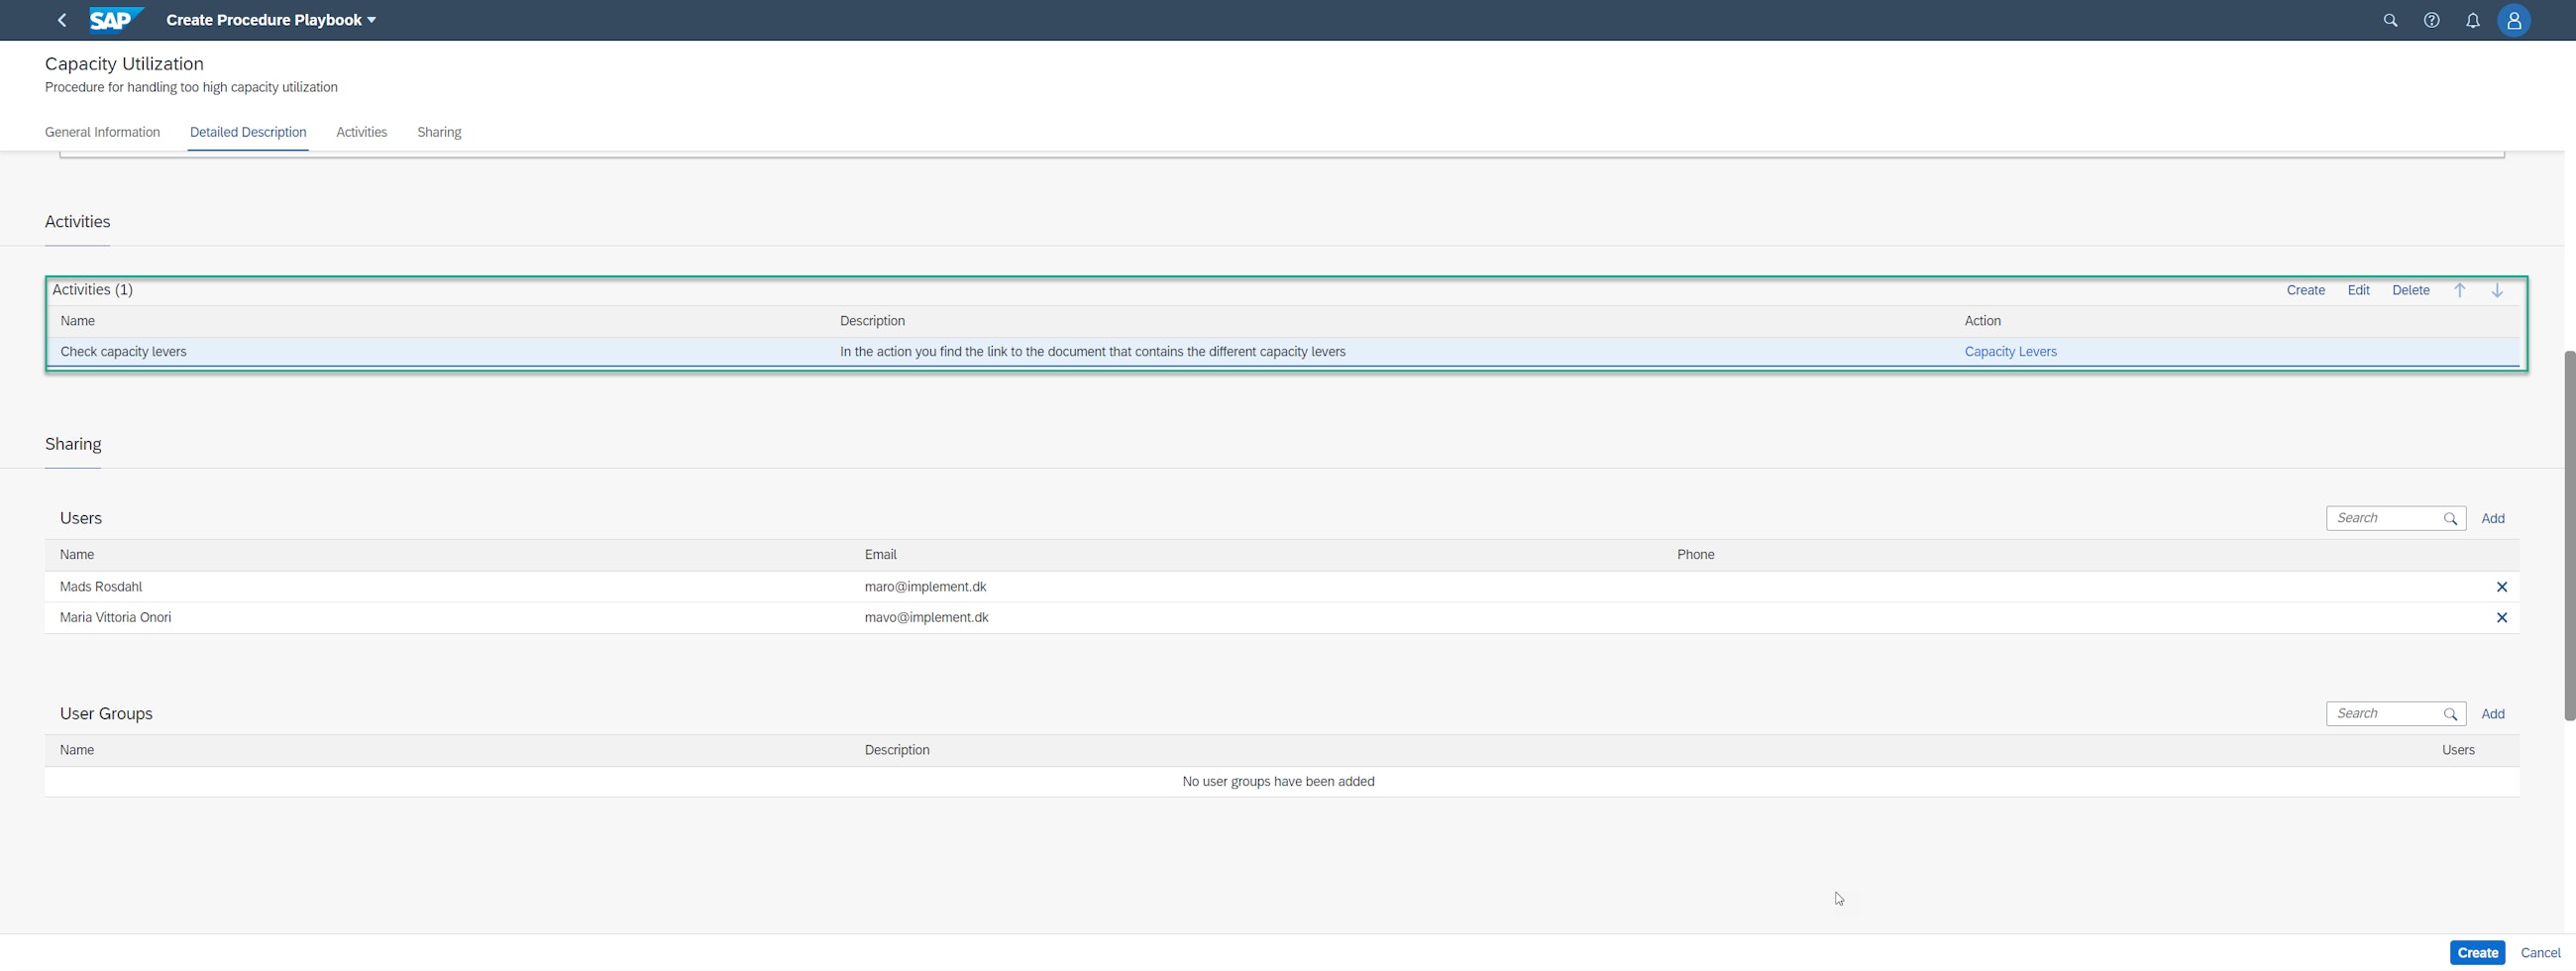
If you need to take several actions and activities to solve the issue, you can create more than one activity and add actions to each of these, e.g. via hyperlinks where you can guide the planners to more information related to that particular issue. Otherwise, you can add a detailed description to the playbook containing internal best practices, including standard levers for solving the issue.
As an extra element in the collaboration in SAP IBP, SAP has created an additional feature enabling you to share the Procedure Playbook with other users or user groups. The users with whom you have shared the Procedure Playbook can assign it to custom alert definitions in the Define and Subscribe to Custom Alerts app. The users can then view it along with the alert in the Monitor Custom Alerts or Intelligent Visibility app and perform the activities listed in the Procedure Playbook.
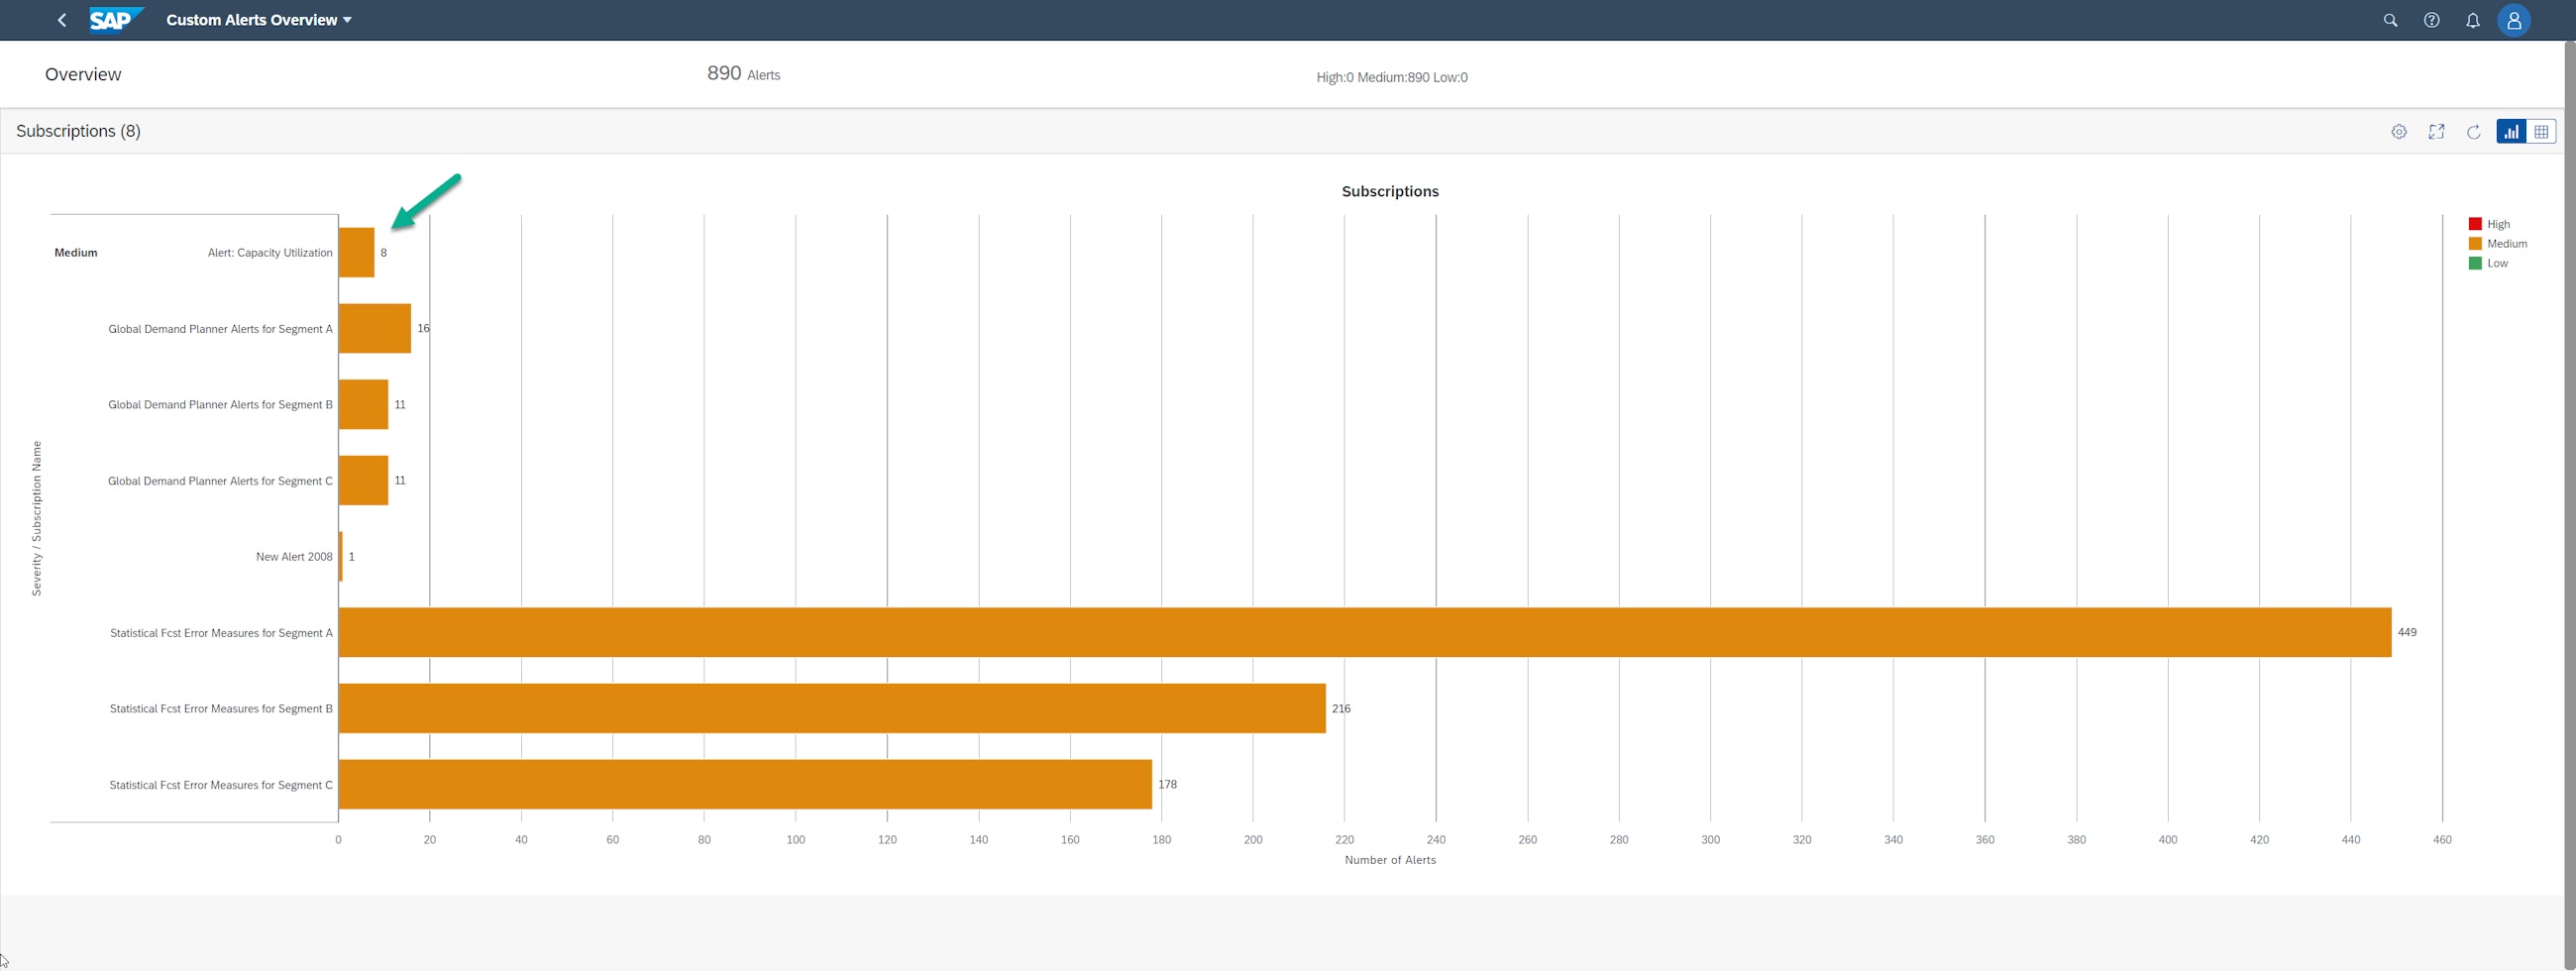
The users can identify the alert in the Custom Alerts Overview.
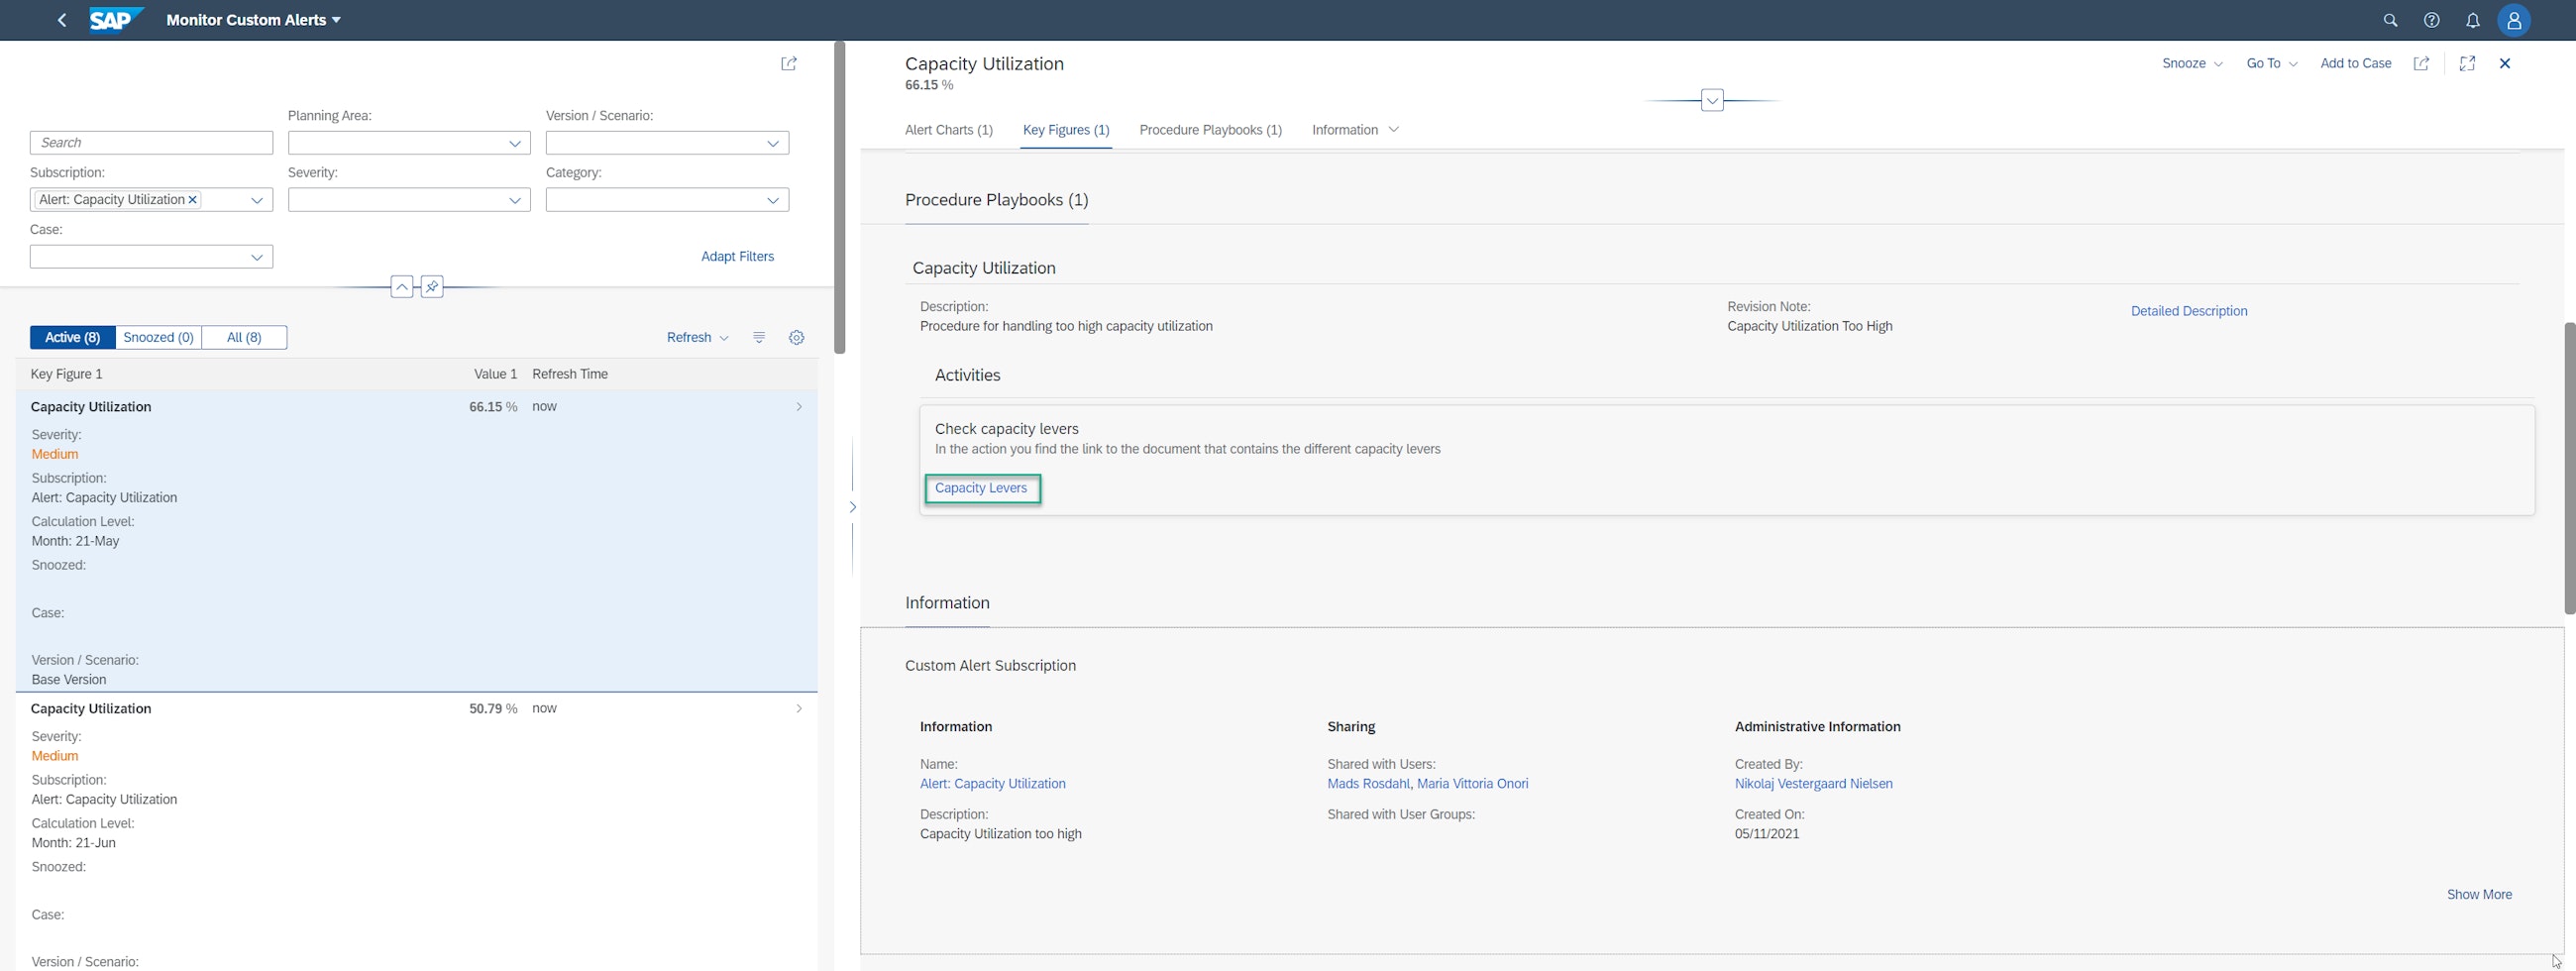
The assigned Procedure Playbook is visible in the alert.
2. K-means: machine learning now supports where to focus the planning effort
In this release, SAP continues the journey of improving the machine learning capabilities in IBP. Machine learning is one aspect that can improve planning quality by automating the planning process, which can free up planners’ capacity so that they can focus on meaningful tasks.
Segmentation is one of the key methods for narrowing down the focus and prioritisation of customers and materials in supply chain planning. In some companies, all materials are planned in the same way, which leads to lack of prioritisation and makes it difficult for planners to focus on what is most critical and plan their product portfolio effectively. By using the Manage ABC/XYZ Segmentation Rules in SAP IBP, planners can use the output of an algorithm to get an indication of where to focus and pay valuable attention. With the new release, further enhancements have been added to the segmentation model, which now also supports the K-means segmentation method.
K-means is a cluster analysis approach and best known from machine learning techniques. To put it simply, the objective of K-means is to group similar data points together and discover the underlying patterns that these data points have in common. To achieve this objective, the K-means method looks for a fixed number of clusters, e.g. ABC, XYZ (three clusters and three clusters) or more, in a data set.
The segmentation profile will cluster the products based on homogeneous clusters; hence, there are no thresholds to be stated for the segmentation profile for segmentation with K-means.
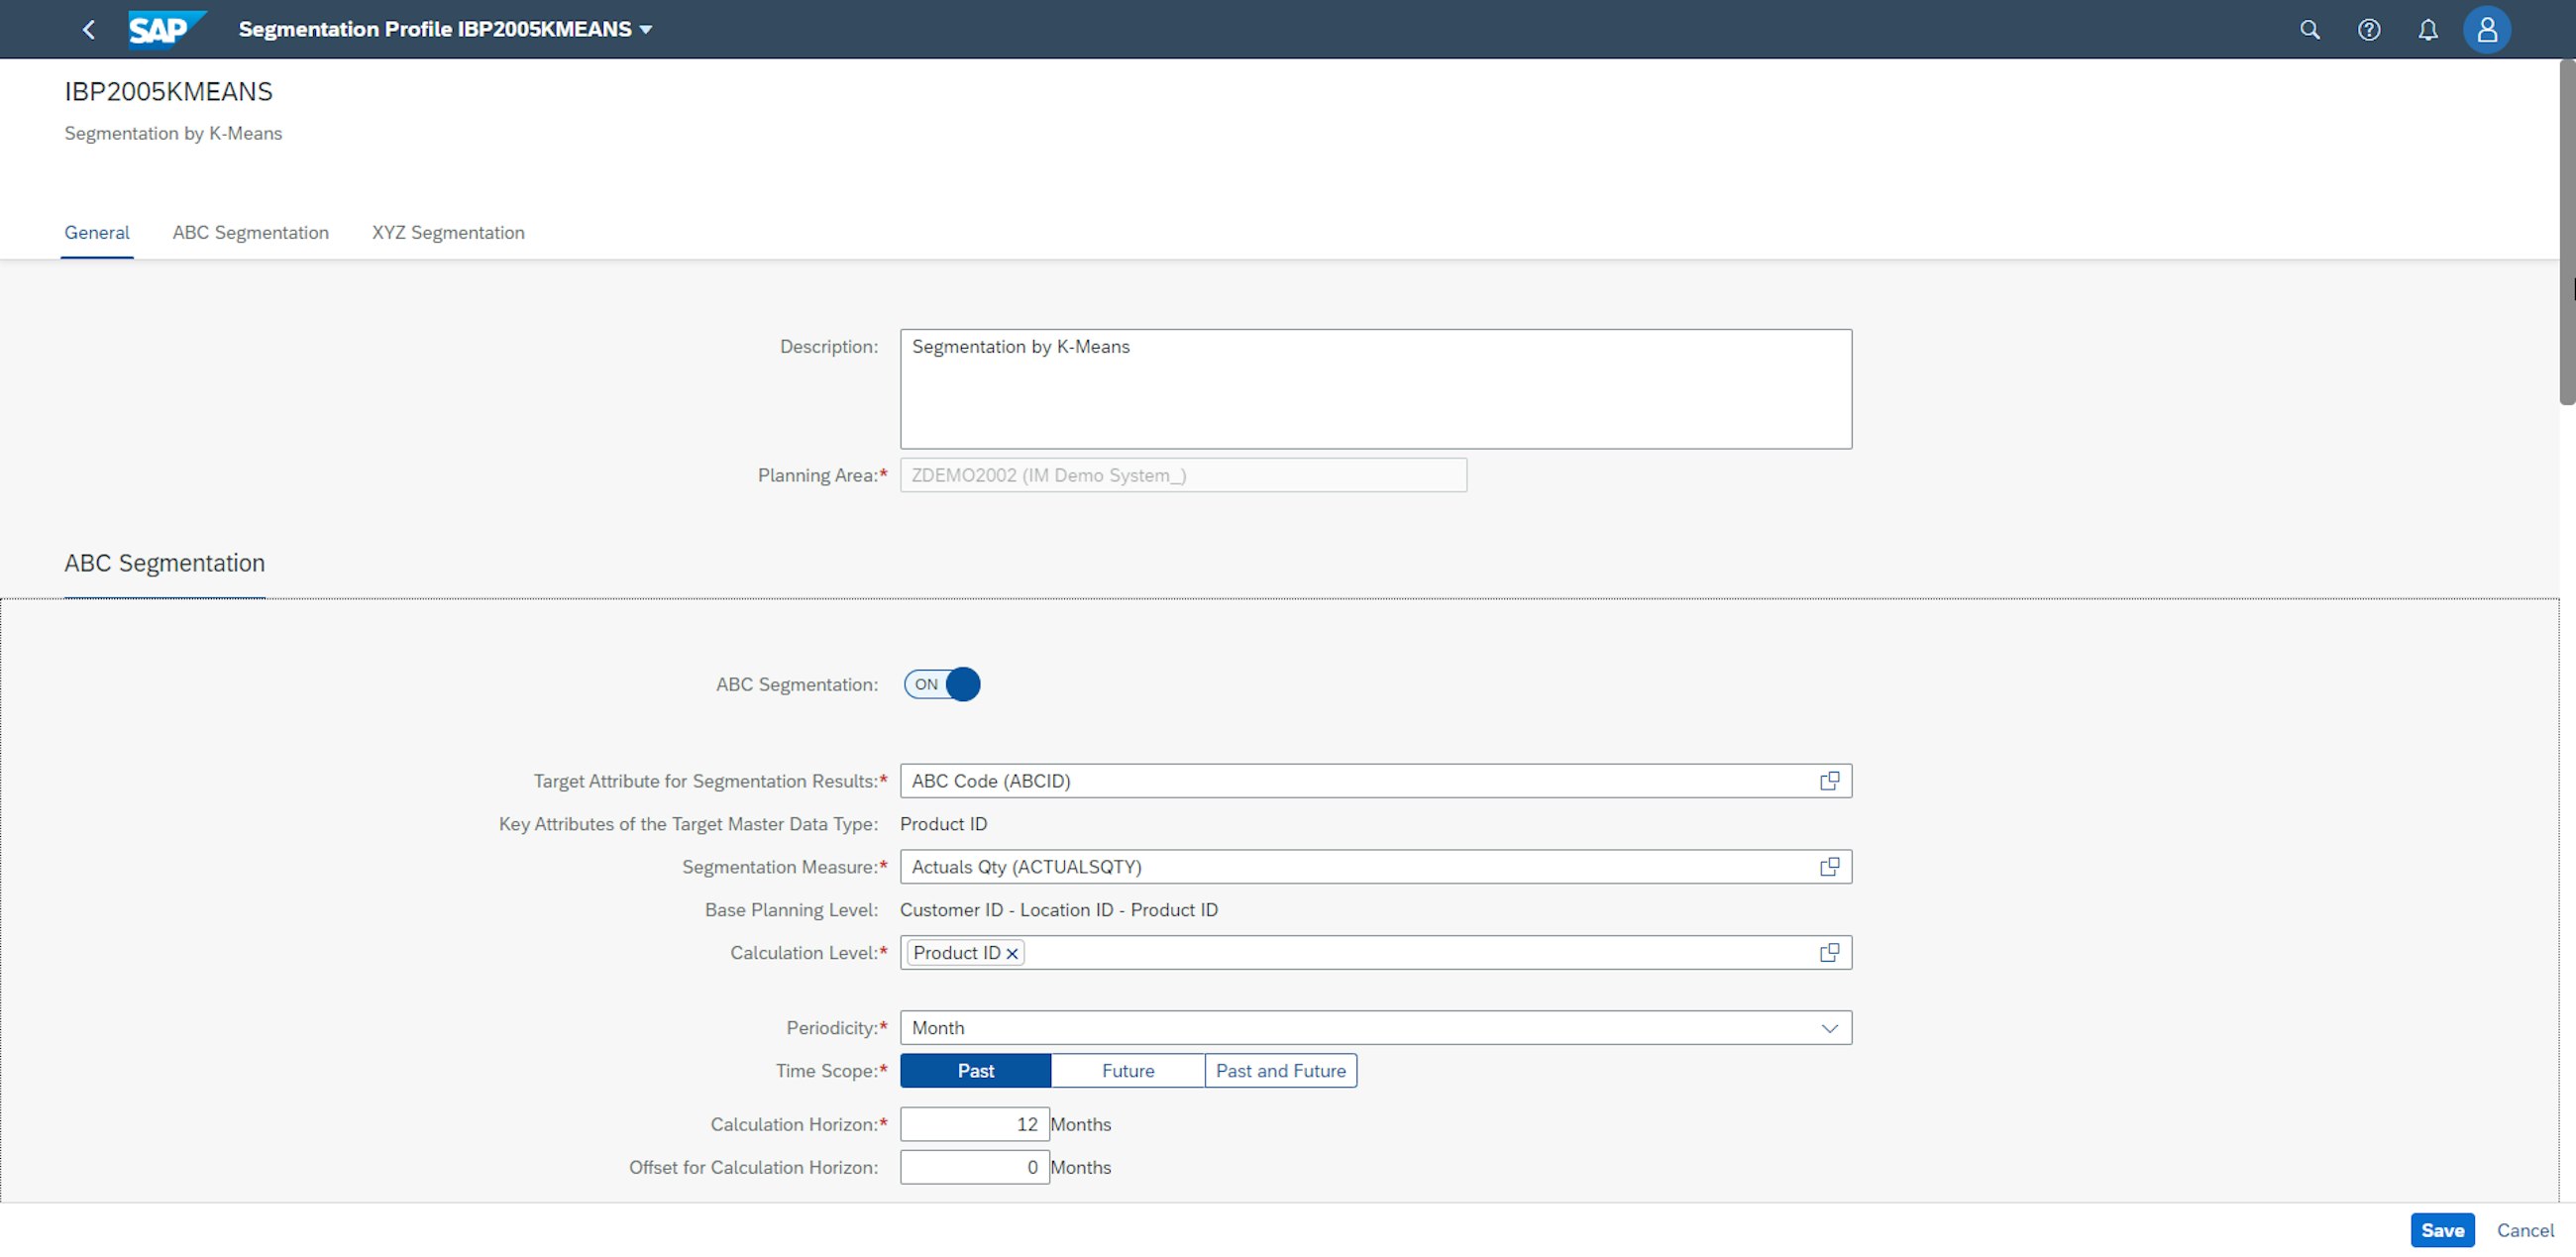
With the new release, K-means can be used for grouping planning objects with similar volumes based on the segmentation measure. This is done in the ABC segmentation, whereas in the XYZ segmentation, you can use it to group planning objects with similar coefficients of variation. The K-means method is useful if you are not certain about how to define and what the thresholds should be for the segments. When using the K-means method, IBP uses machine learning to create segments and will create the segments as homogenously as possible with regard to the values of the segmentation measure.
The K-means segmentation groups the products differently compared to the normal ABC/XYZ segmentation with predefined thresholds.
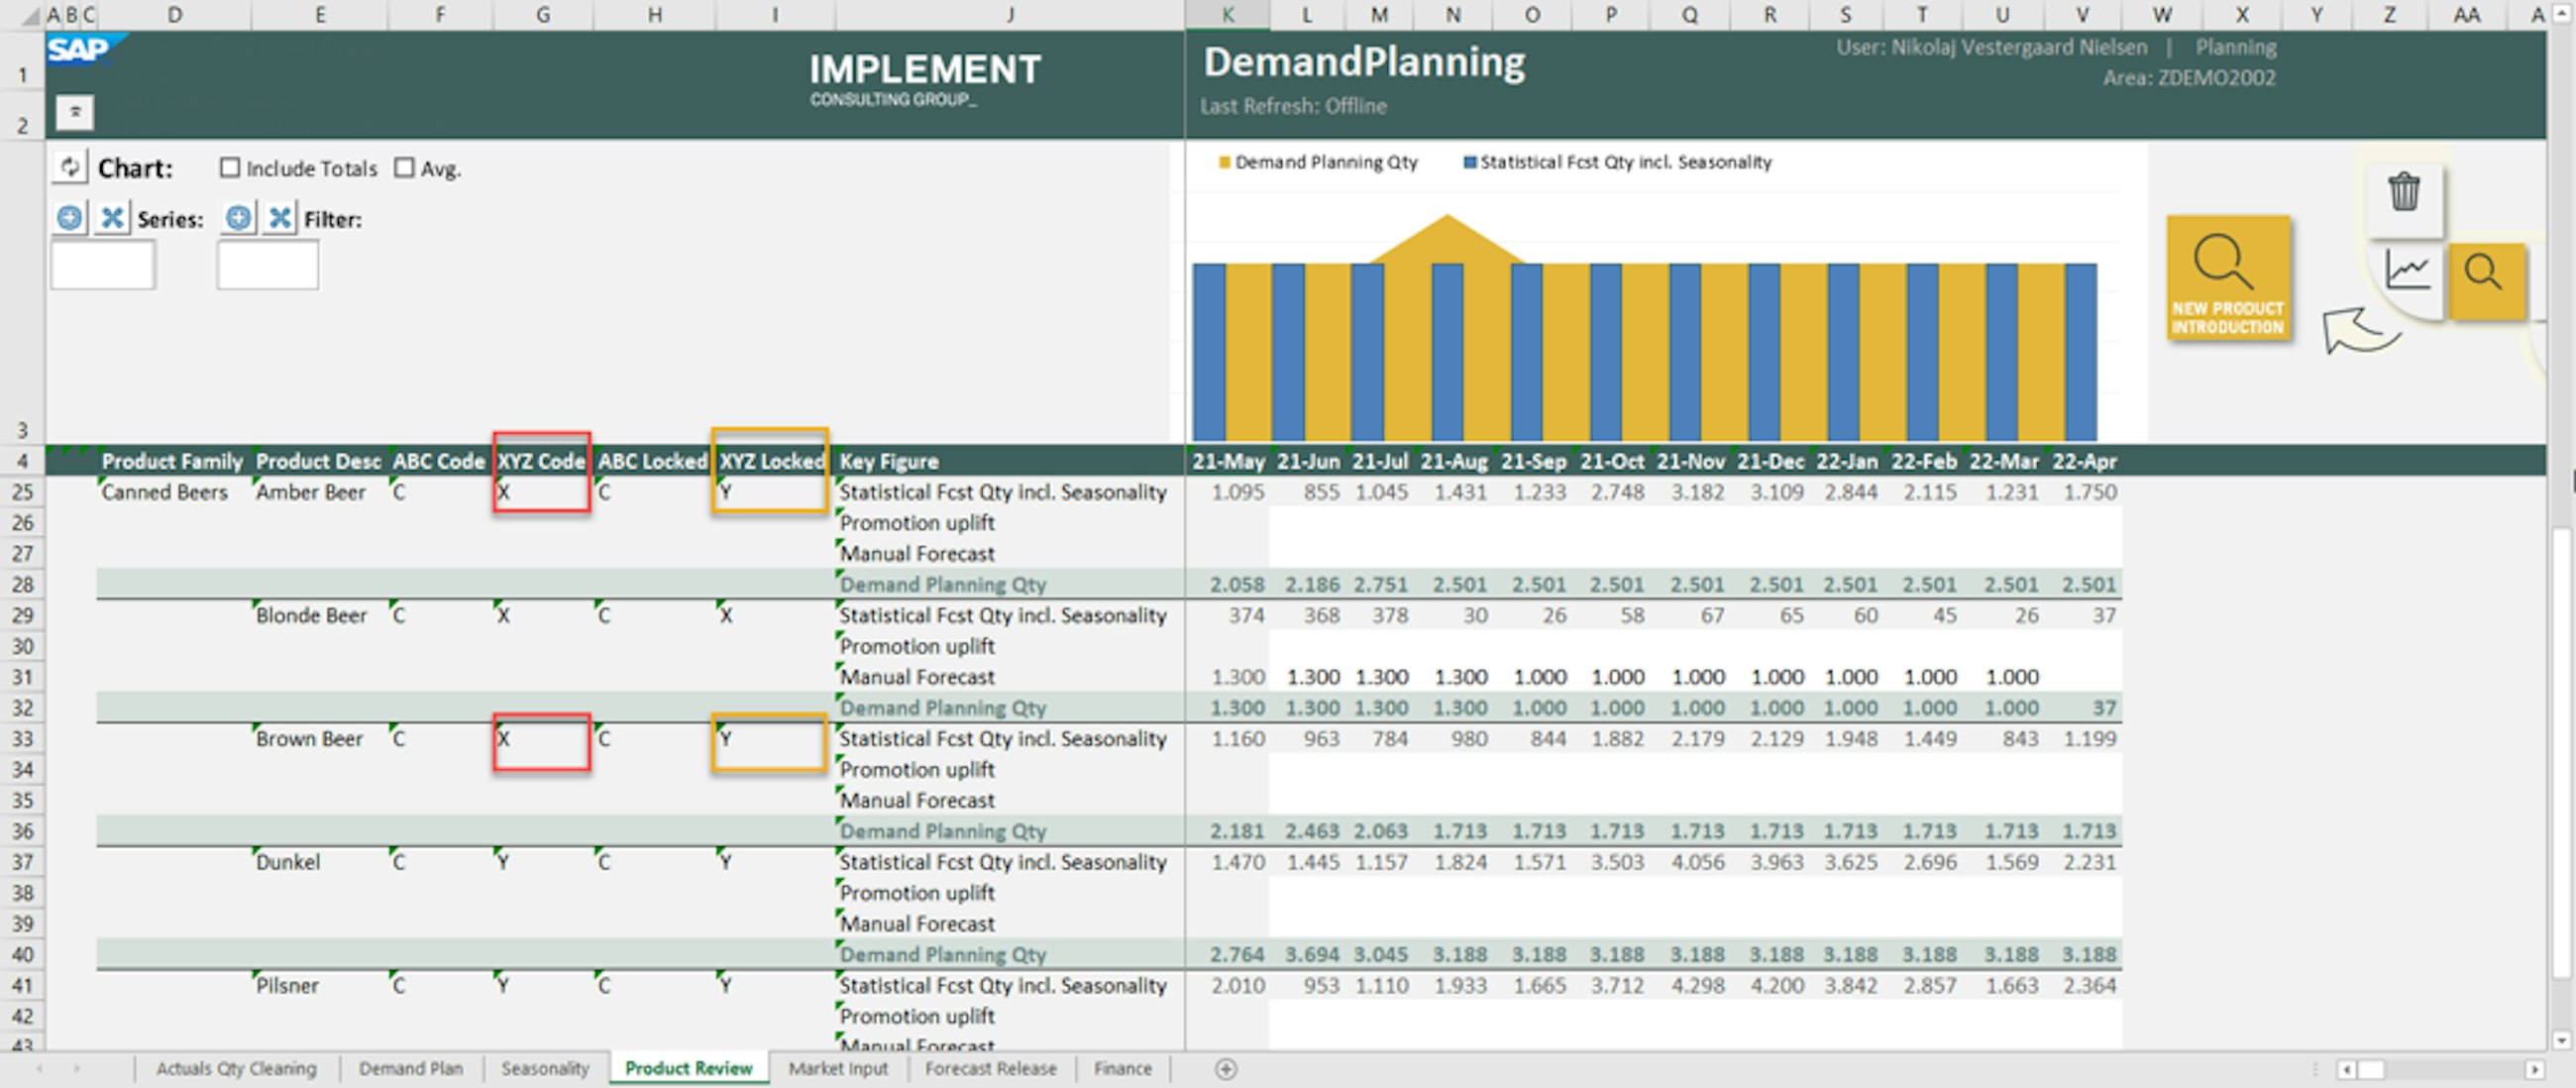
Usually, a company’s portfolio of products has different characteristics. Different characteristics require different planning approaches, which is why differentiated planning should be considered.
Even though segmentation with K-means is seen as an improvement in the planning process, it is still recommended not to recalculate the segmentation too often; otherwise the planning approach for the given product will change too often, causing imbalances in the supply chain. Cycle planning could be used for high volume and high predictability where focus should be on stabilising the plan, reducing lot sizes and monitoring stock limits. For products with low predictability but significant volume, focus should be on getting input from sales to improve the forecast, and the planning principle should be manual planning or make-to-order.
3. Bringing back the frozen horizon: Manage Editability Horizons for Key Figures
With the newest release of SAP IBP, you finally get a way to limit the number of manual changes that can be made to a plan.
Adjustments to demand and supply plans are a fundamental part of any supply chain planning process, and these happen weekly, if not daily. However, in some cases you might want to restrict the changes that a planner can make to a specific time frame: for instance, you may want to fix the plan within the order lead time or within a defined frozen horizon. Up until now, there was no easy way to do this, which is something that has been raising eyebrows among IBP users; but with the new update, you get this new functionality that solves the issue.
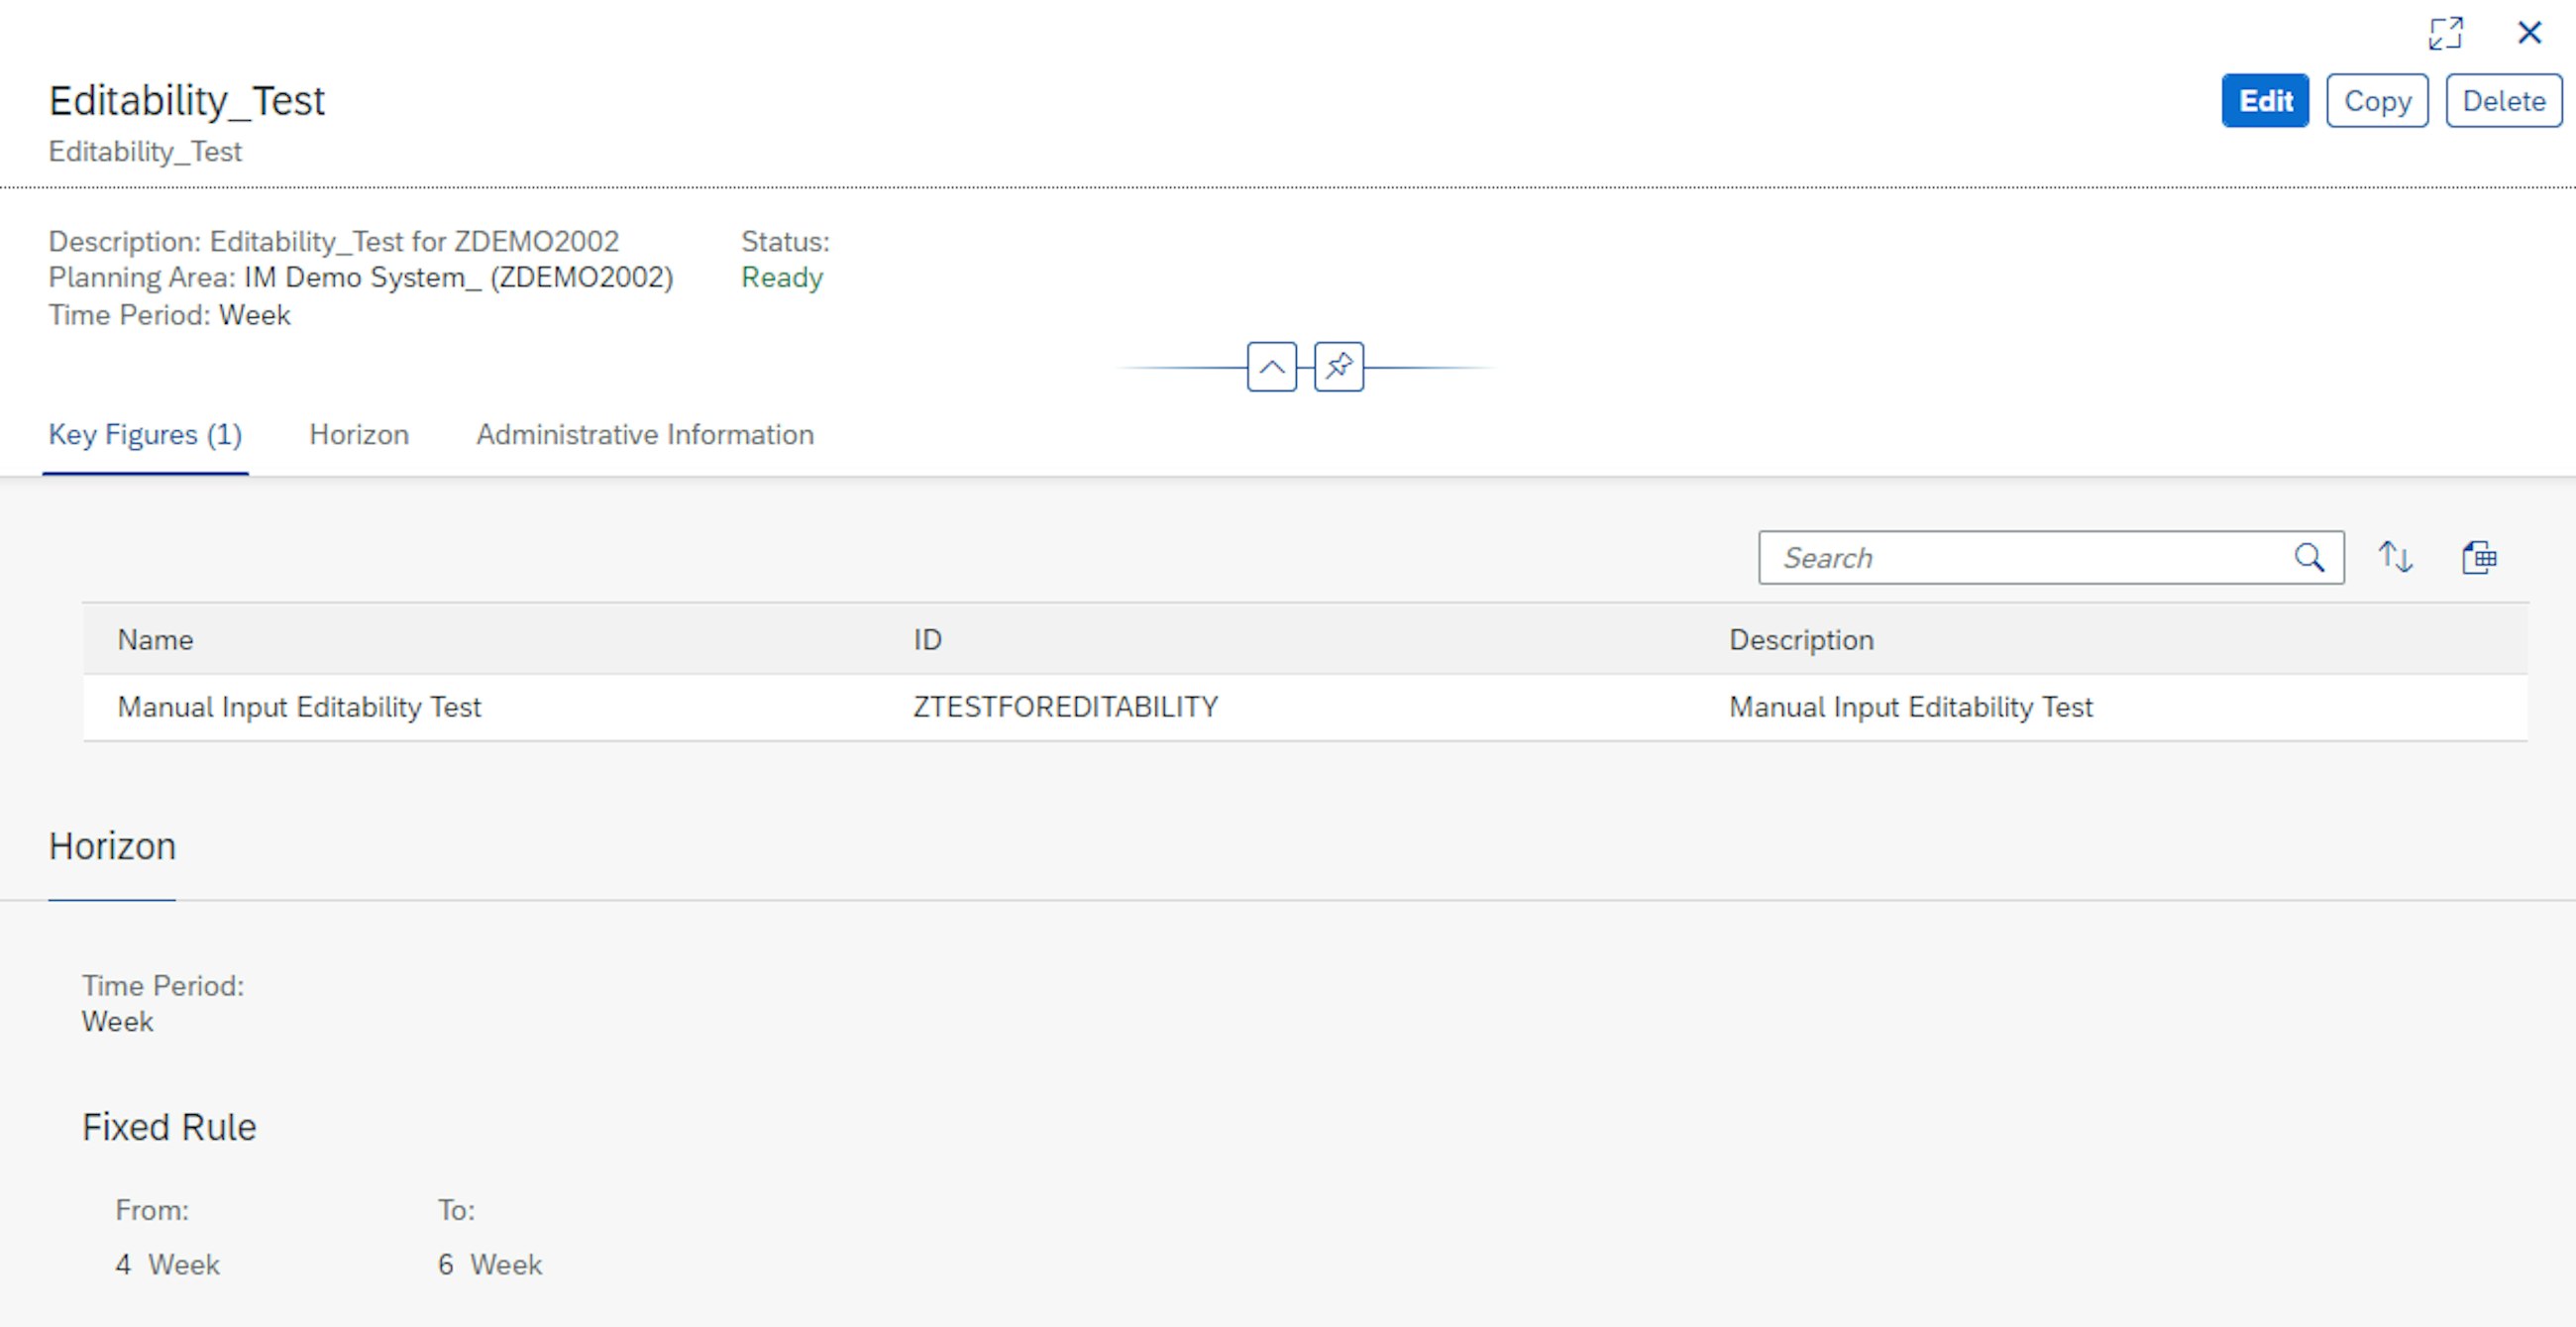
A new app called Manage Editability Horizons for Key Figures has been released which serves the purpose of defining the editability horizon for a specific set of key figures. This was previously known as a frozen horizon in SAP APO. To put it simply, the idea is that an administrator can determine a subset of key figures for which editability is only allowed within a specific period determined by the setup in the new app.
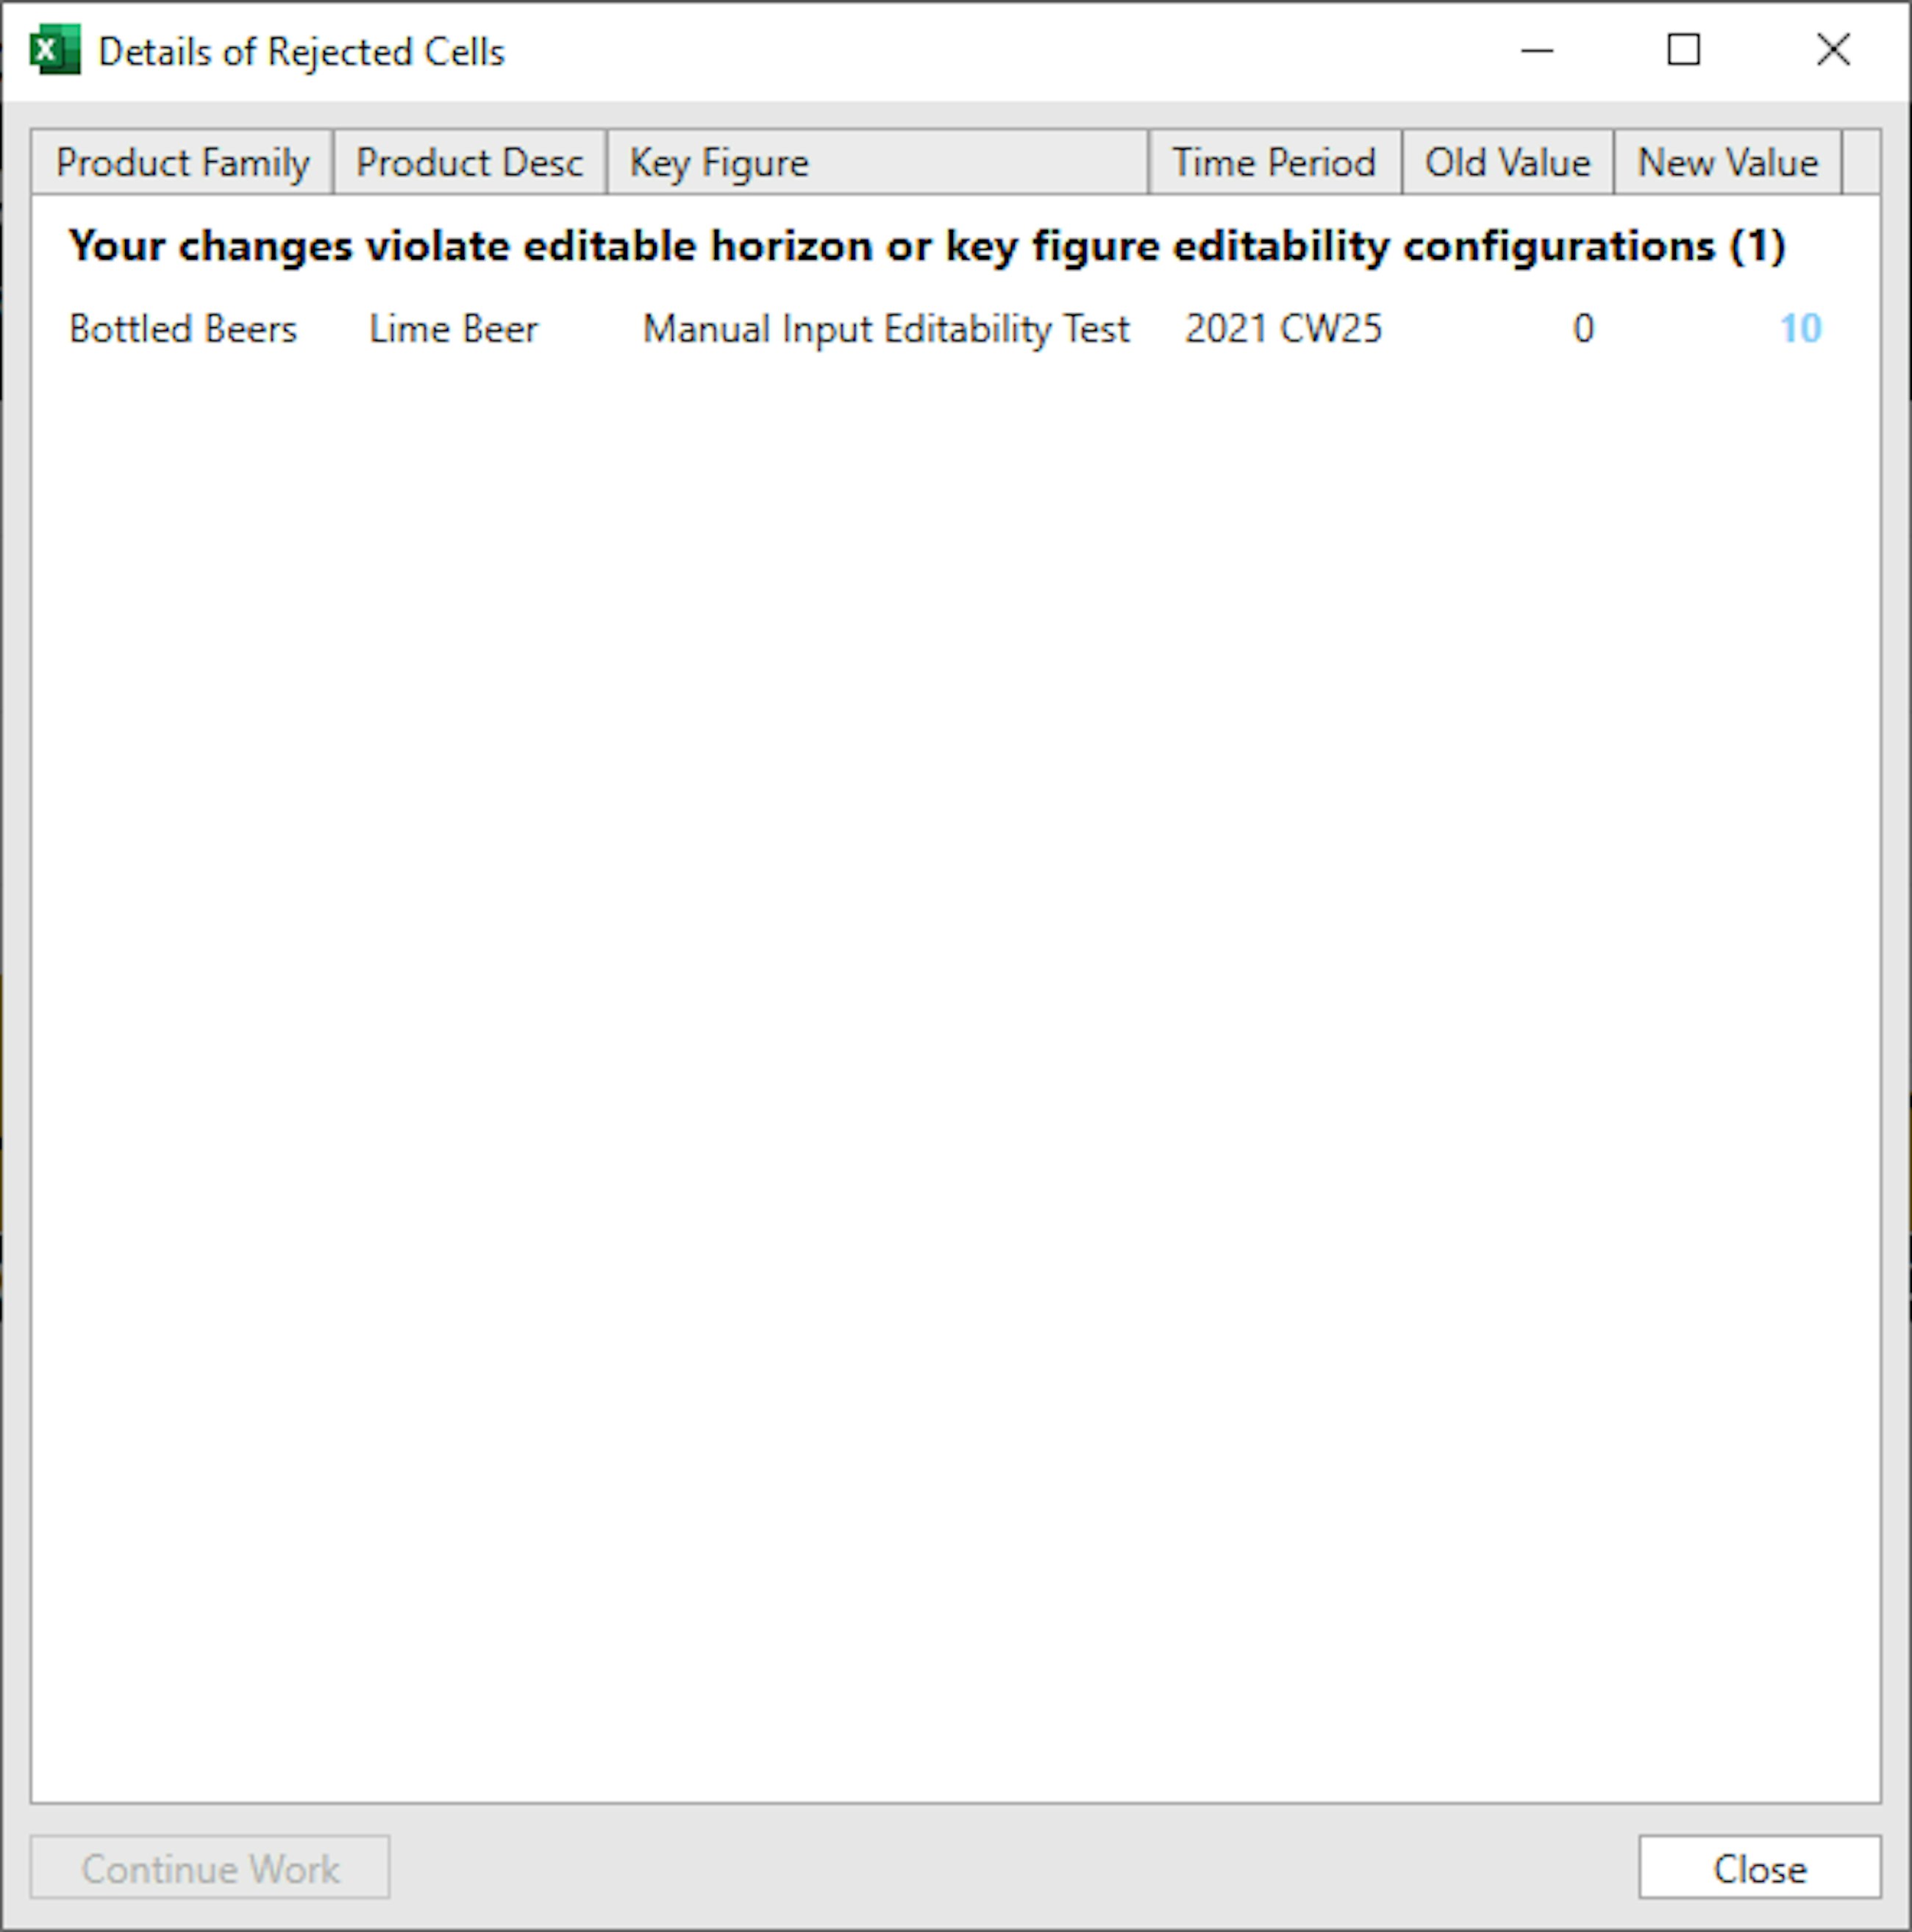
Caption: The editability of key figures is maintained in the new app Editability Horizons for Key Figures.
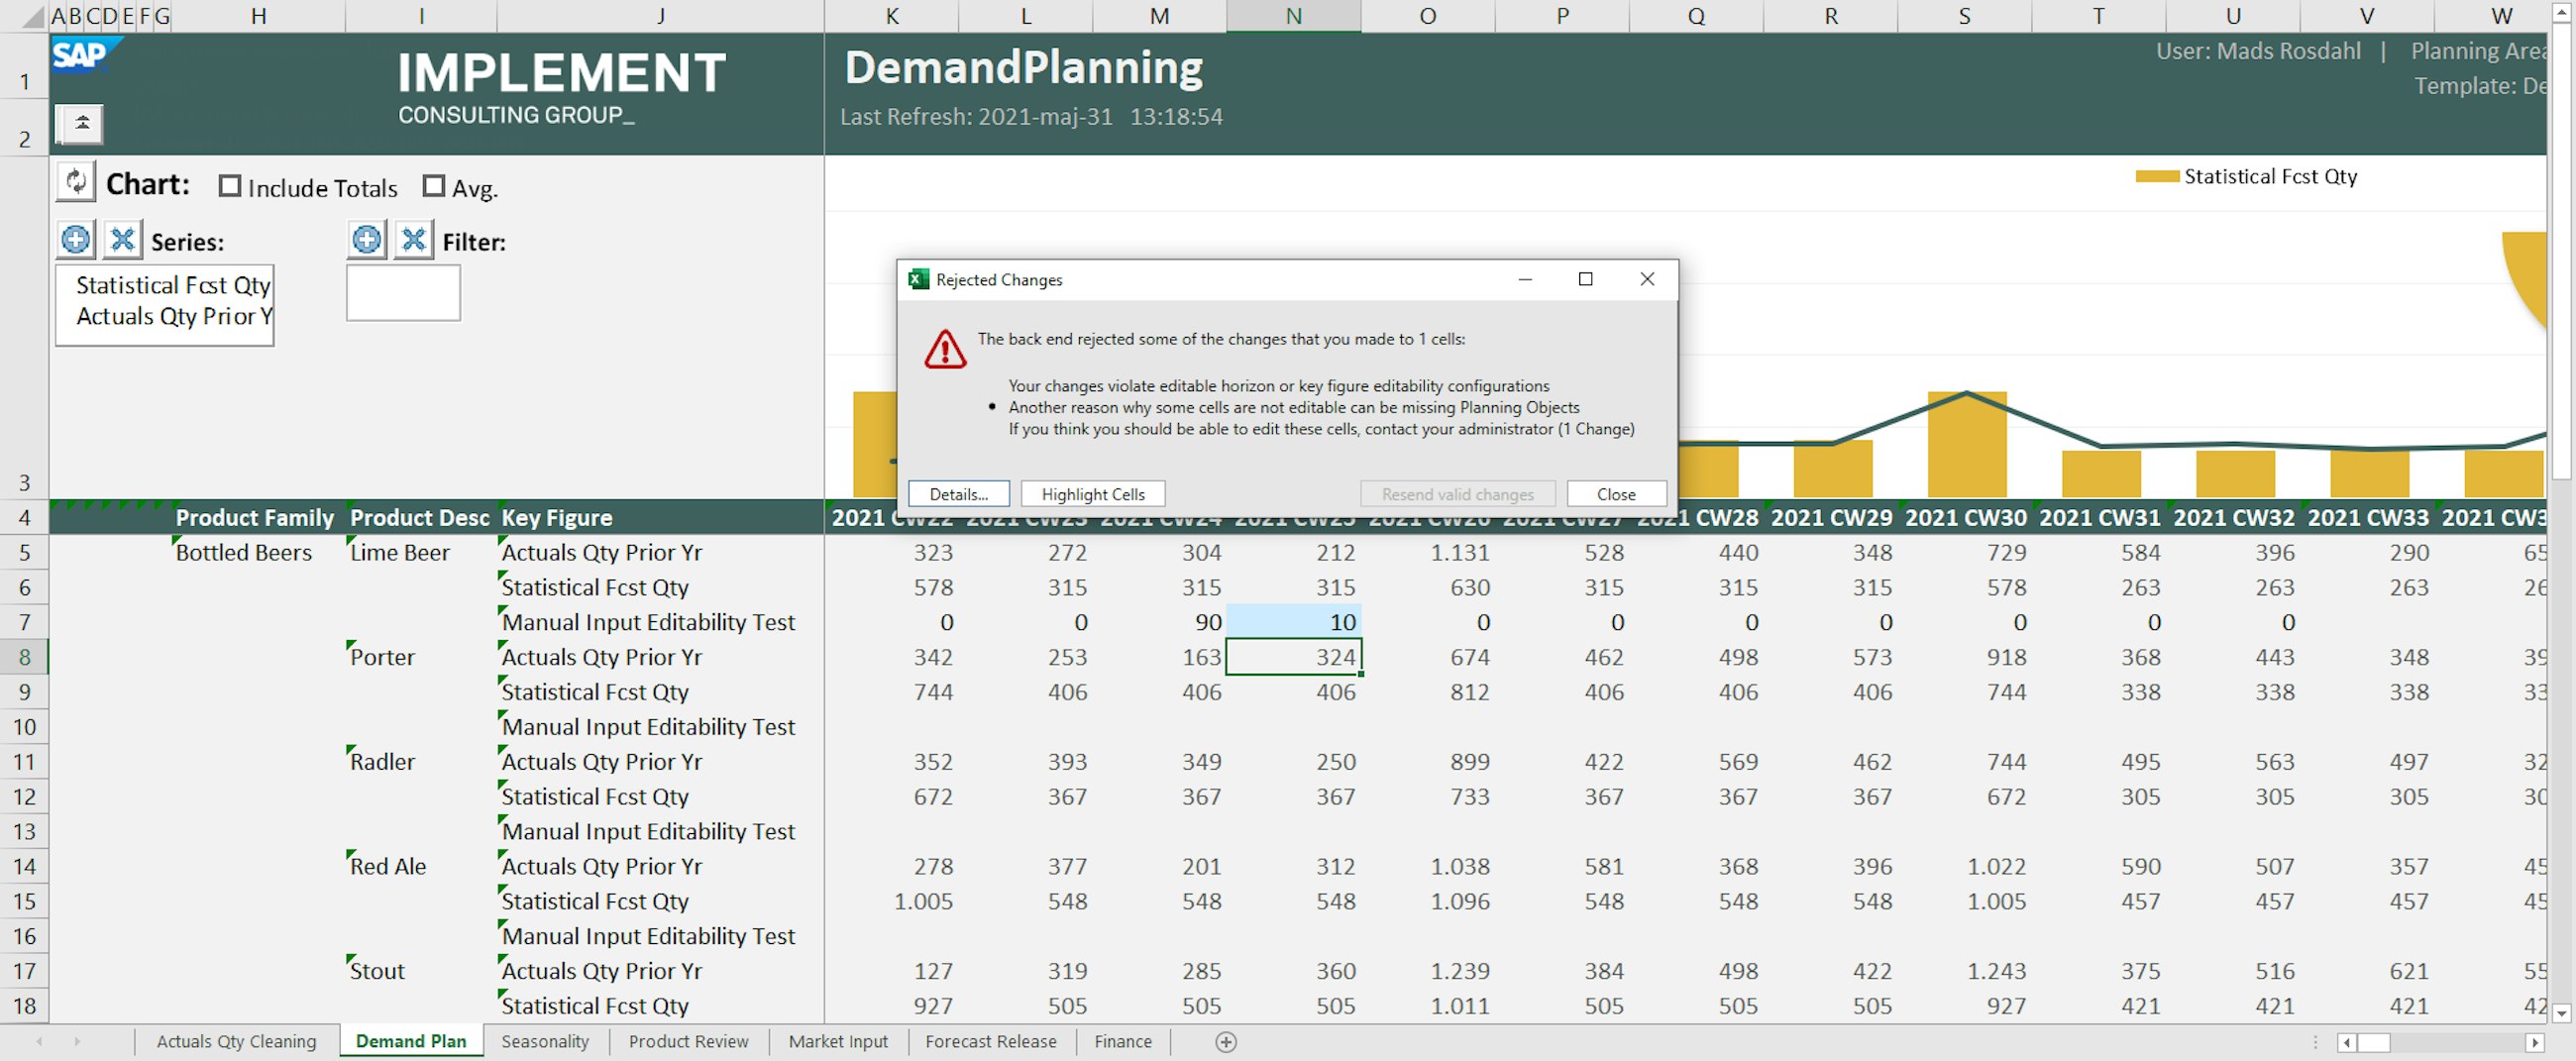
A warning signal is shown when editability is not allowed.
The specific key figures and their horizons are determined in the app. One thing to note is that this is only relevant to manual changes, as planning operators do not adhere to this editability horizon.
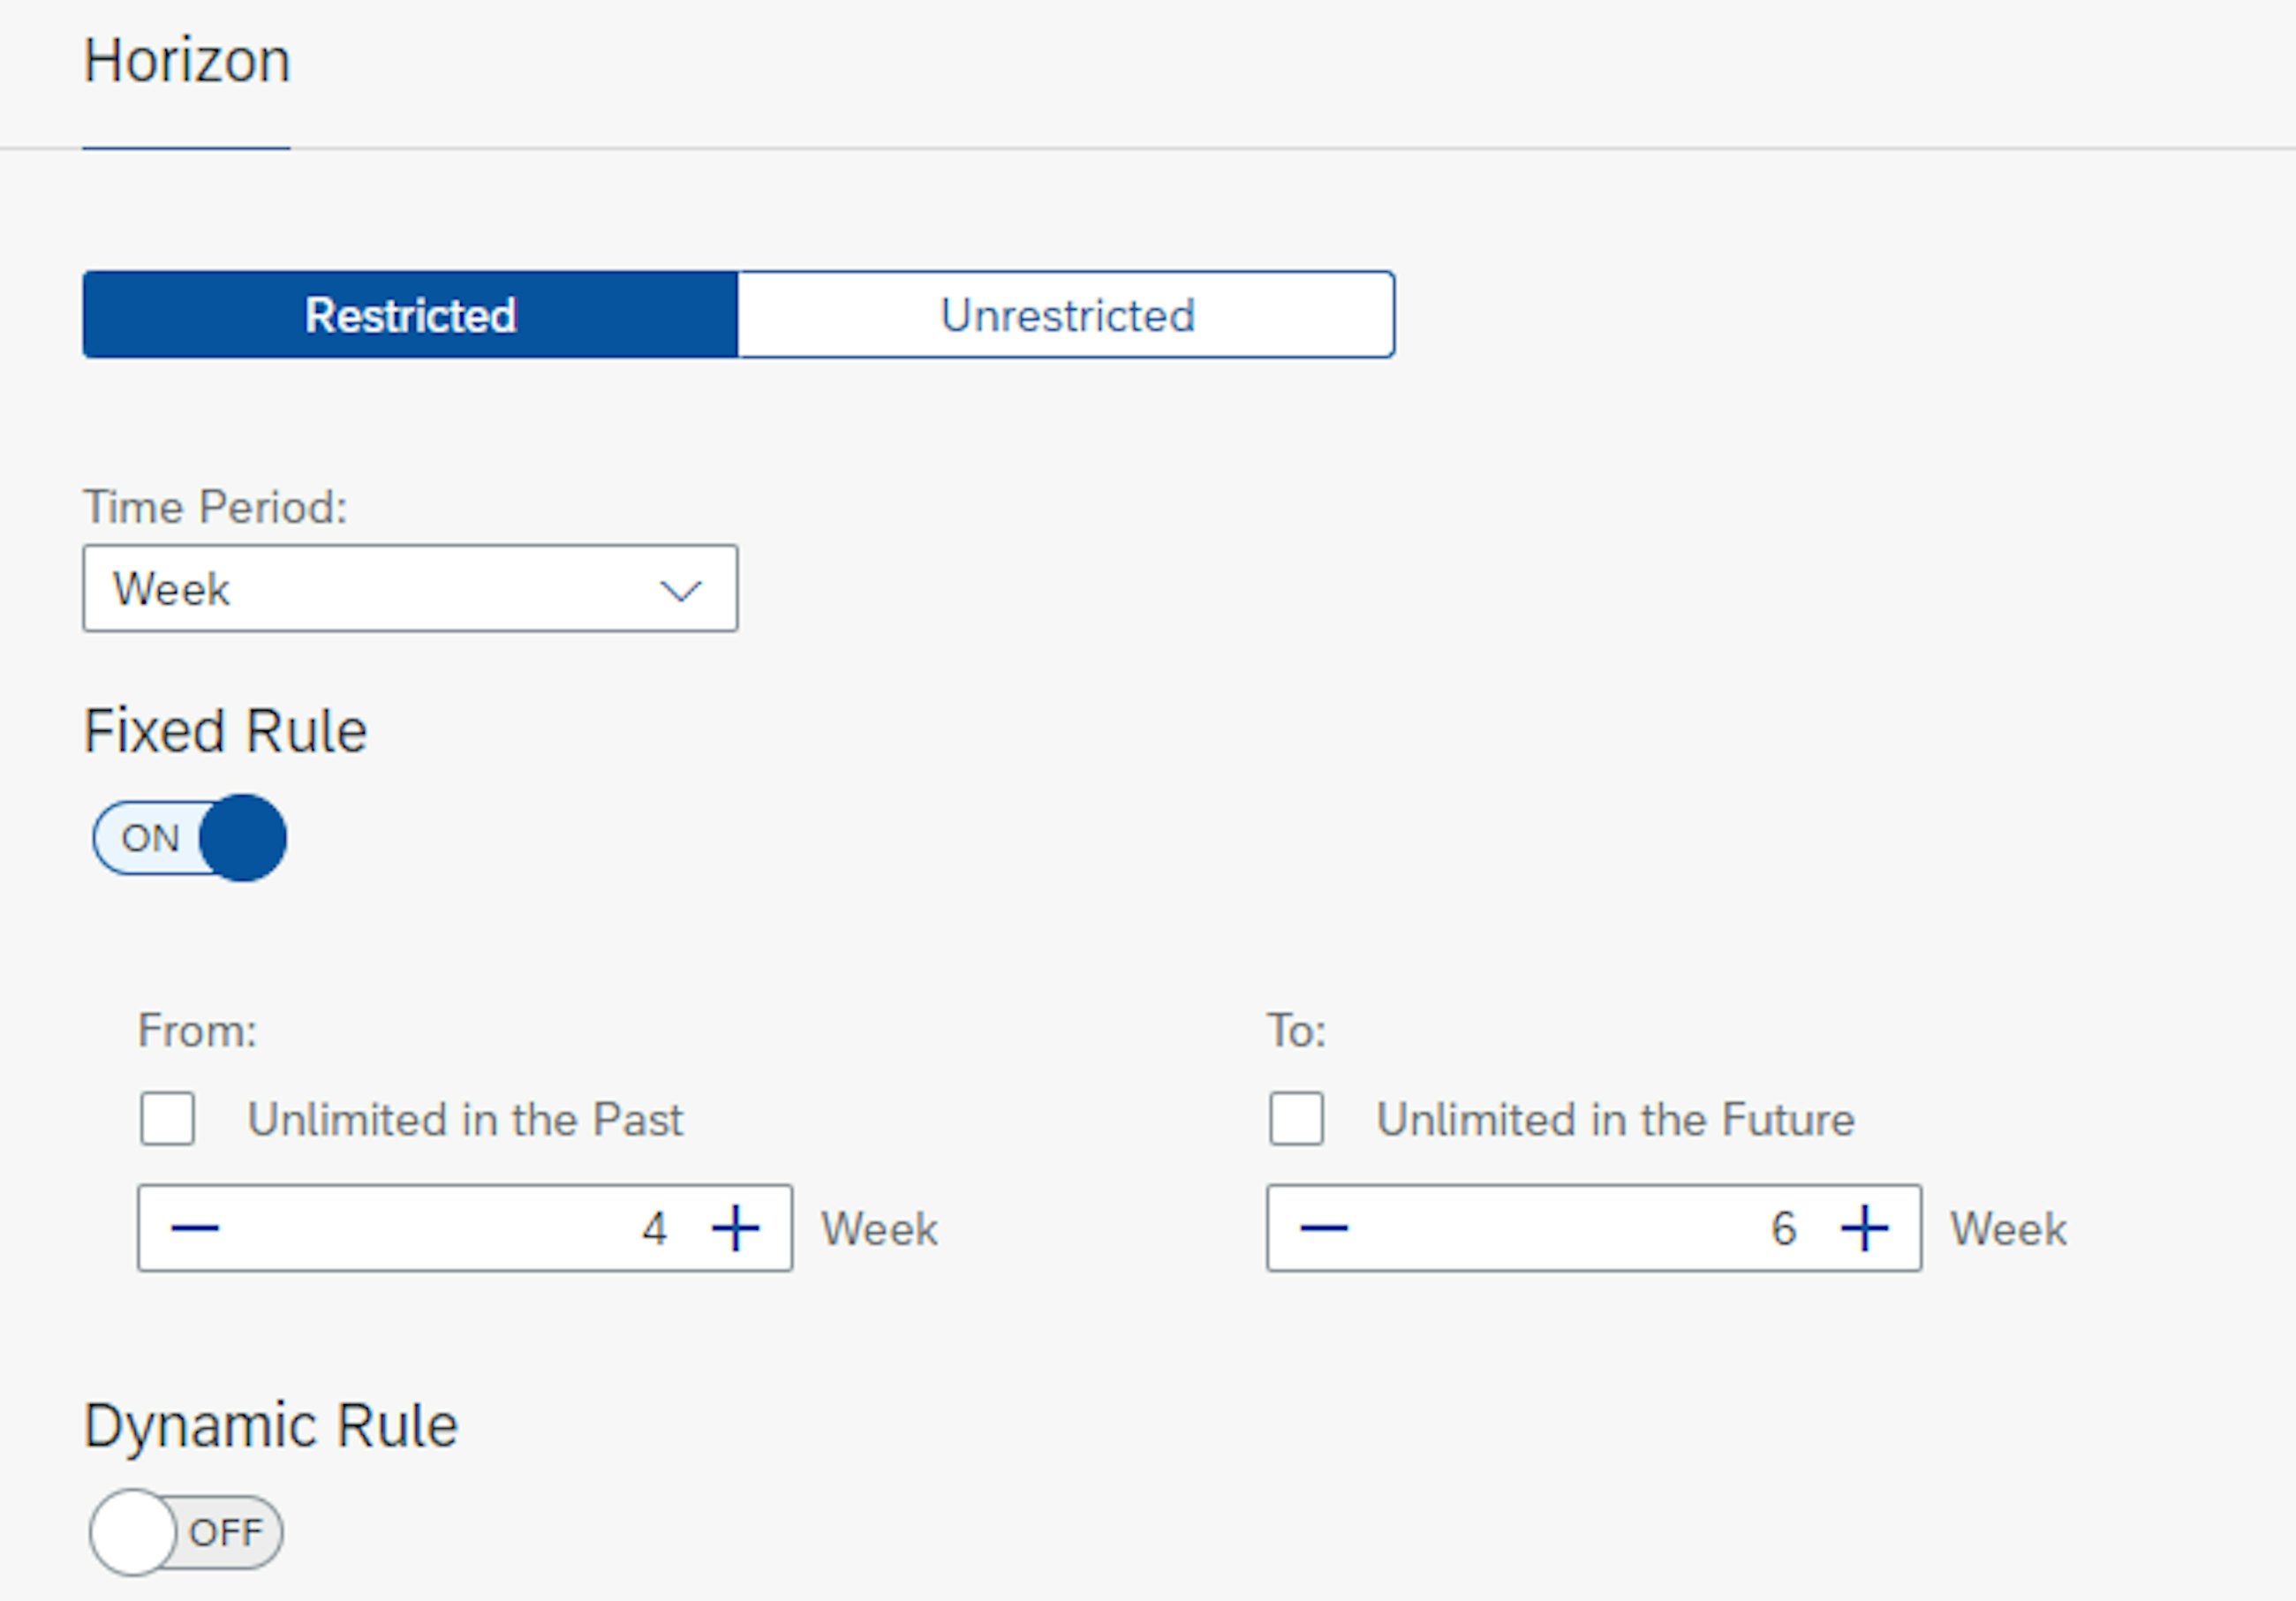
An interesting feature is that you can set the editability horizon for key figures to either fixed or dynamic.
A fixed time horizon determines the from and to periods for which manual changes are allowed. Here, the from period can be e.g. 4 weeks in the past to 6 weeks into the future or unlimited; bear in mind that this is a rolling period.
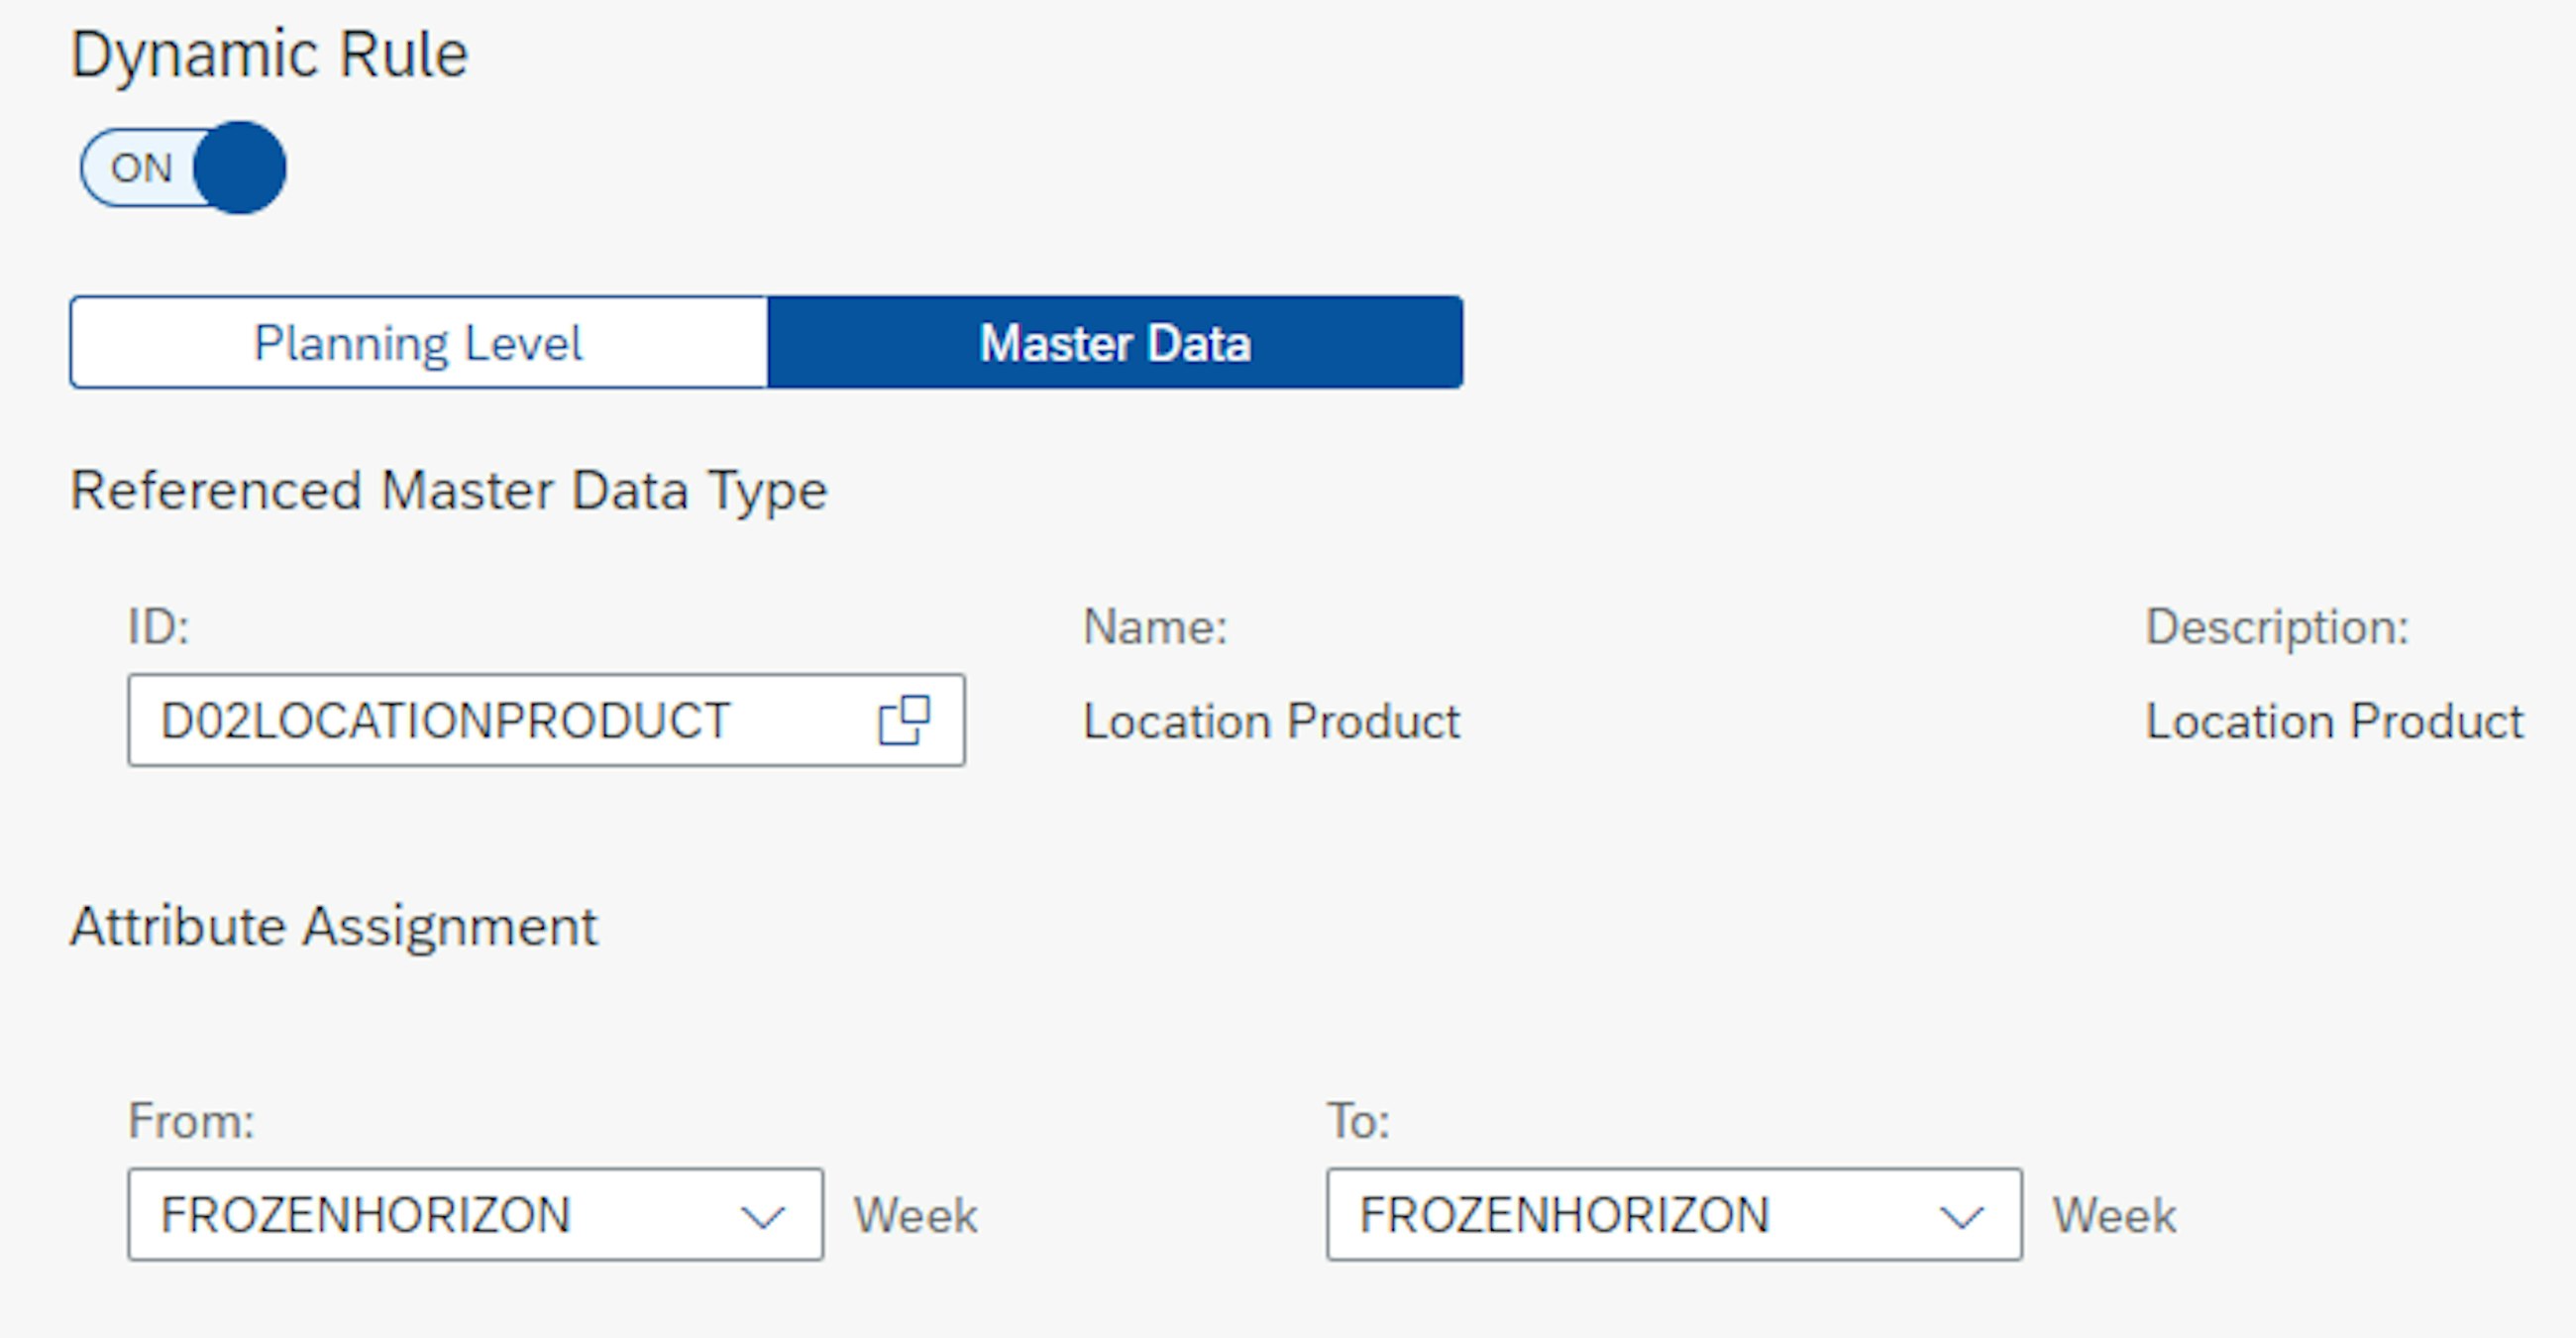
Fixed and dynamic from and to period selection.
A dynamic rule is determined based on either a planning level or a master data type. For both planning level and master data setup, an attribute with an integer value can be used to determine the from and to period.
When you have defined the editability horizon for a subset of key figures, you have to add the new editability profile to the relevant business roles where a new business catalogue, Manage Editability Horizons for Key Figures, must be added to a business role and the new profile must be added.
Along with this new feature, SAP has upgraded their formatting options, making it possible to easily do formatting that indicates the editability horizons for key figures. This new feature has a default formatting of editable cells, making it easy for the end user to identify them, as opposed to the old rules where this could only be achieved by having multiple rules to illustrate the editability of the key figures.
New enabled default feature in the formatting sheet.
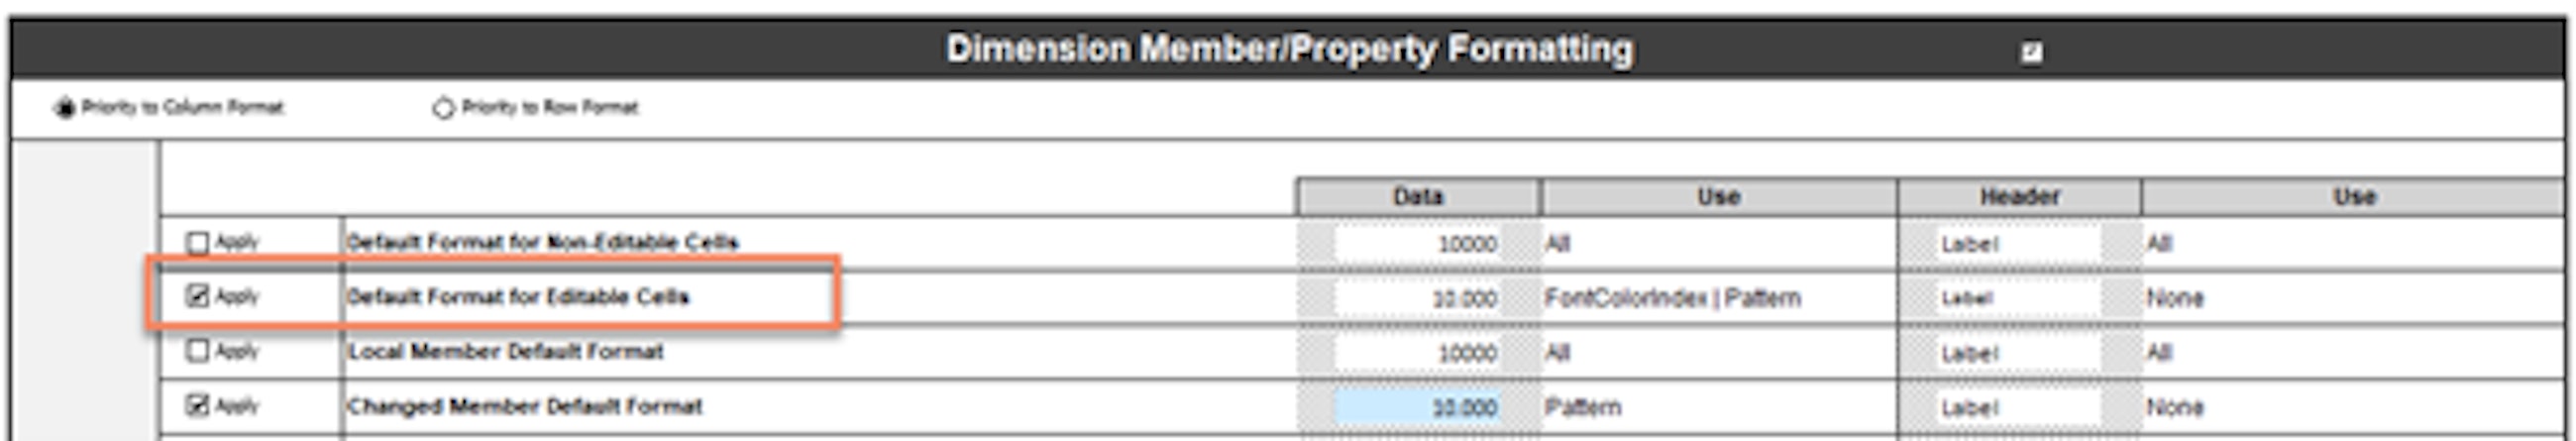
A new formatting function has been added in Member/Property Formatting in the IBPformattingsheet where a user can now click on the check mark for the Default Format for Editability Cells and decide on the format of the cells that are editable. This makes it easy for Excel users to identify the editability of a specific key figure and provides an easy overview of key figures that are editable and the ones that are not.
4. Introducing machine learning for master data checks
In the new upgrade, SAP introduces a new and potentially beloved feature called ML Master Data Consistency Check. This new feature adds a machine learning and semantic approach to the consistency checks of existing master data. Master data experts out there with a lot of master data but only one pair of eyes will love this feature, as it is supposed to reduce the amount of manual work that currently goes into correcting and identifying master data inaccuracies.
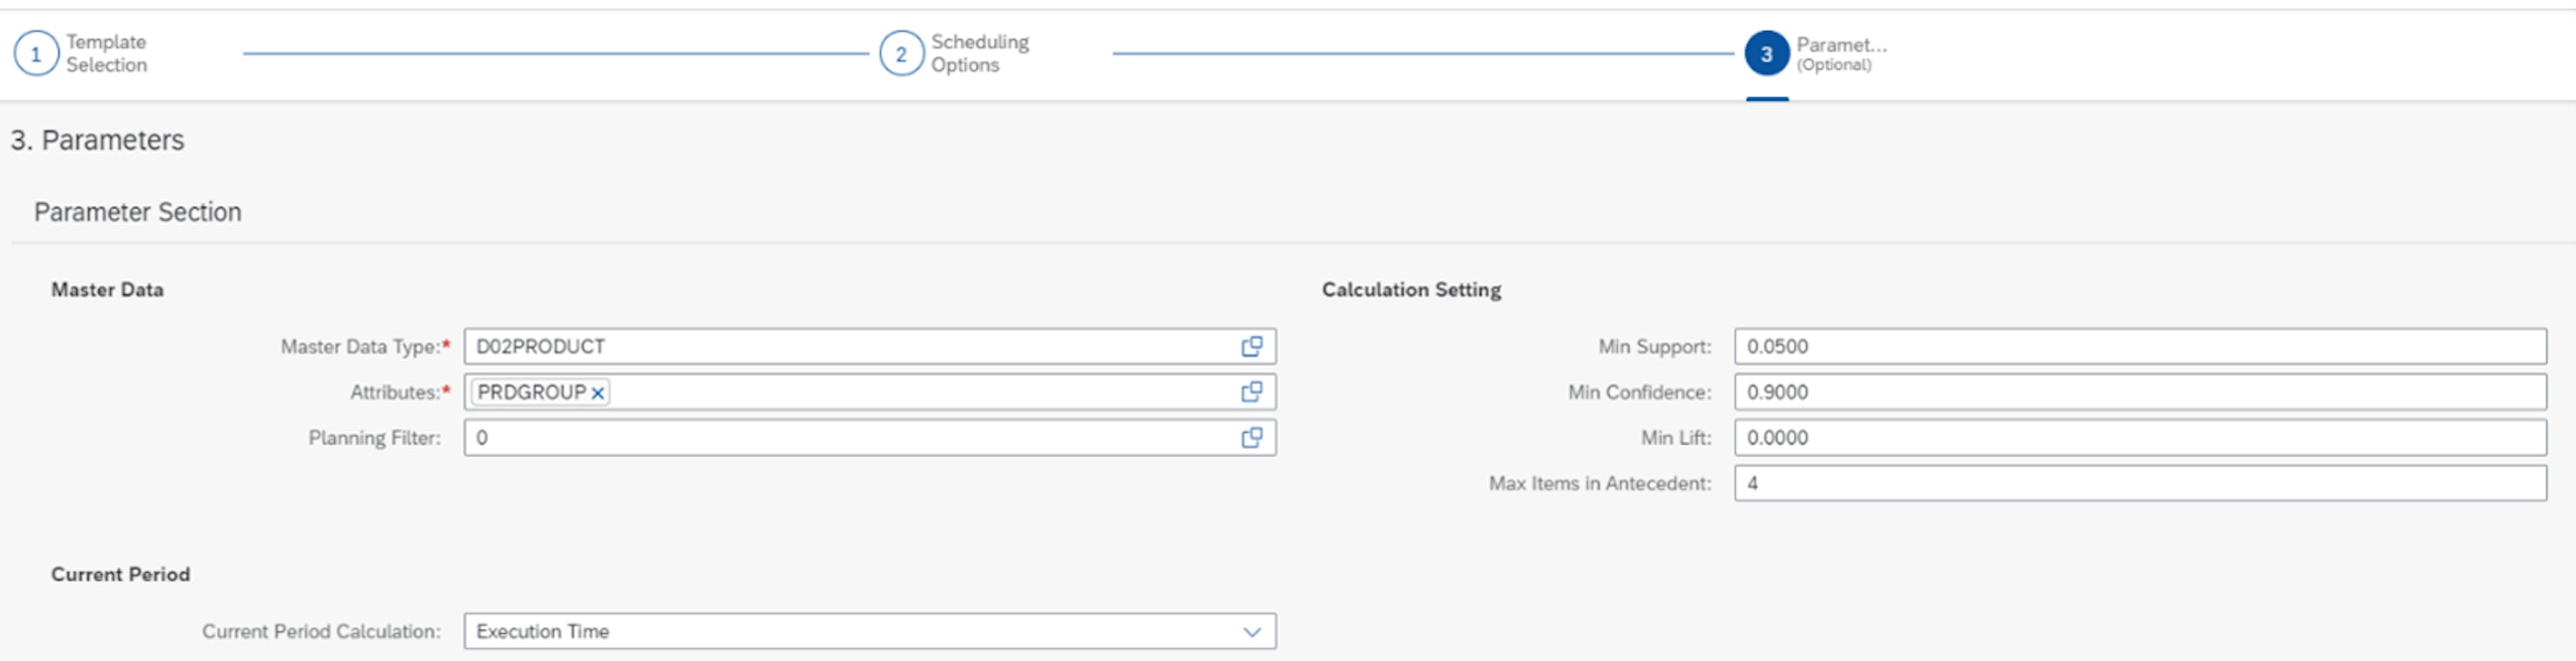
The new feature is basically an application job, run from the template ML Master Data Consistency, which per default is set up by SAP. This application job can be run for a certain master data type, and it compares specific attributes based on one (or more) main attributes. As seen in the picture showing parameter selection, you select the master data type and attribute that you want the ML job to be run on. During the application job run, the algorithm searches for semantic patterns and proposes rules or suggestions for changes to the master data based on the existing master data.
Parameter selection and calculation settings.
Based on the different runs, the ML algorithm will learn the patterns of the master data; and during future runs, the algorithm will propose changes to current master data, which is beneficial when adding new master data. The algorithm will then propose rules based on different parameters and inform about the confidence that the algorithm has in the proposed recommendations. You can “train” the algorithm as often as you like; and the more you “train” it, the more it will pick up and generate recommendations for master data consistency.
Example of output from the algorithm application job.
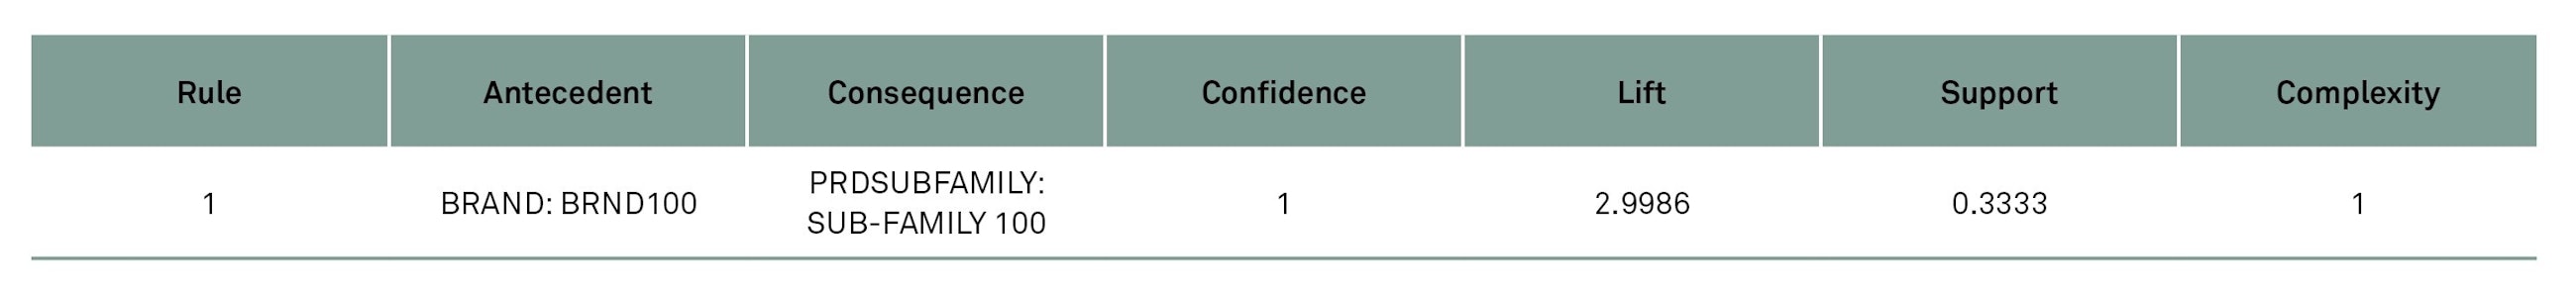
For the results of the run, the algorithm will propose some rules that it will adhere to in the future. The antecedent is the root identified, and the consequent is the recommendation where our example states that when BRAND = BRND100, then our PRDSUBFAMILY = SUB-FAMILY 100. A confidence of 1 means that this occurs for 100% of our data set.
The lift refers to probability, meaning that if SUB-FAMILY 100 is observed randomly in the data set, the probability of finding it together with BRND100 is 2.99 times higher than any other combination.
A support factor means that in 33% of the data in our data set, the BRND100 is found together with SUB-FAMILY 100.
One thing that we would like you to bear in mind is that the slacker your calculation settings, the more results the algorithm will propose and vice versa: the stricter the settings, the fewer the results.
5. New and improved features to support NPI planning
With the latest SAP IBP upgrade, demand planners finally got a solution for something that we are sure was causing them quite a headache: planning combinations for new products were not automatically generated in IBP, and thus a user had to do this manually for the statistical forecast to be generated.
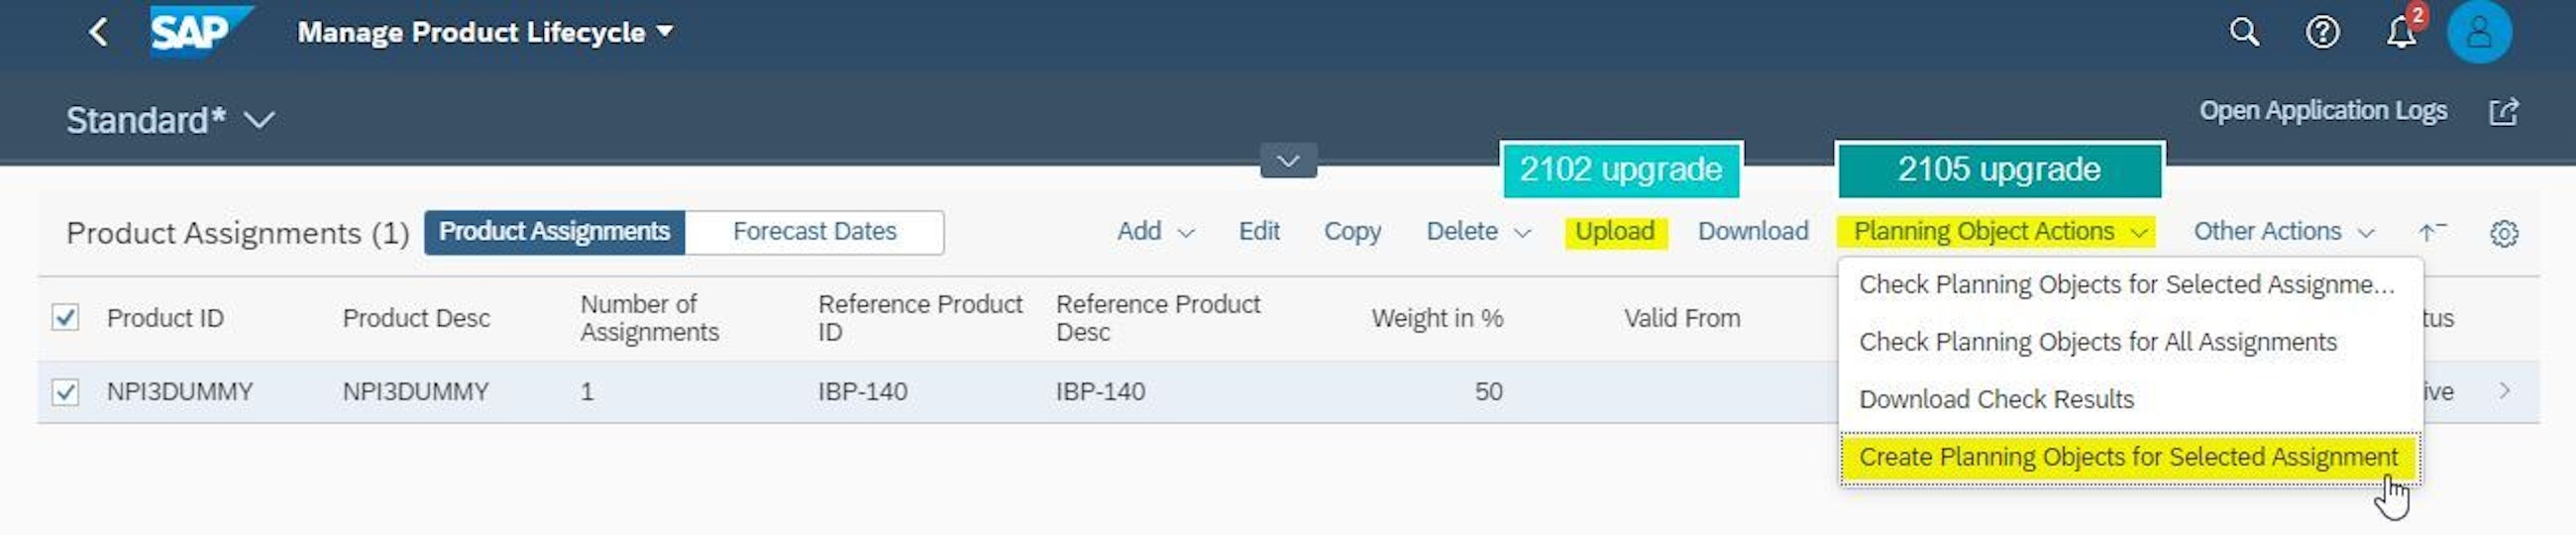
As written in our previous article, SAP introduced a new functionality in February that allows creating planning combinations automatically for new products simply based on the planning objects of the reference product. Up until now, this required uploading a .csv file.
With the latest upgrade, you can now create the missing planning objects in another way: using a planning object action. The benefit of using this option is that you can define additional criteria on top of the defined reference product and that you can run a simulation to see which planning objects would be created based on your selection. Once you are satisfied with the results of the simulation, you can create planning objects for all selected key figures.
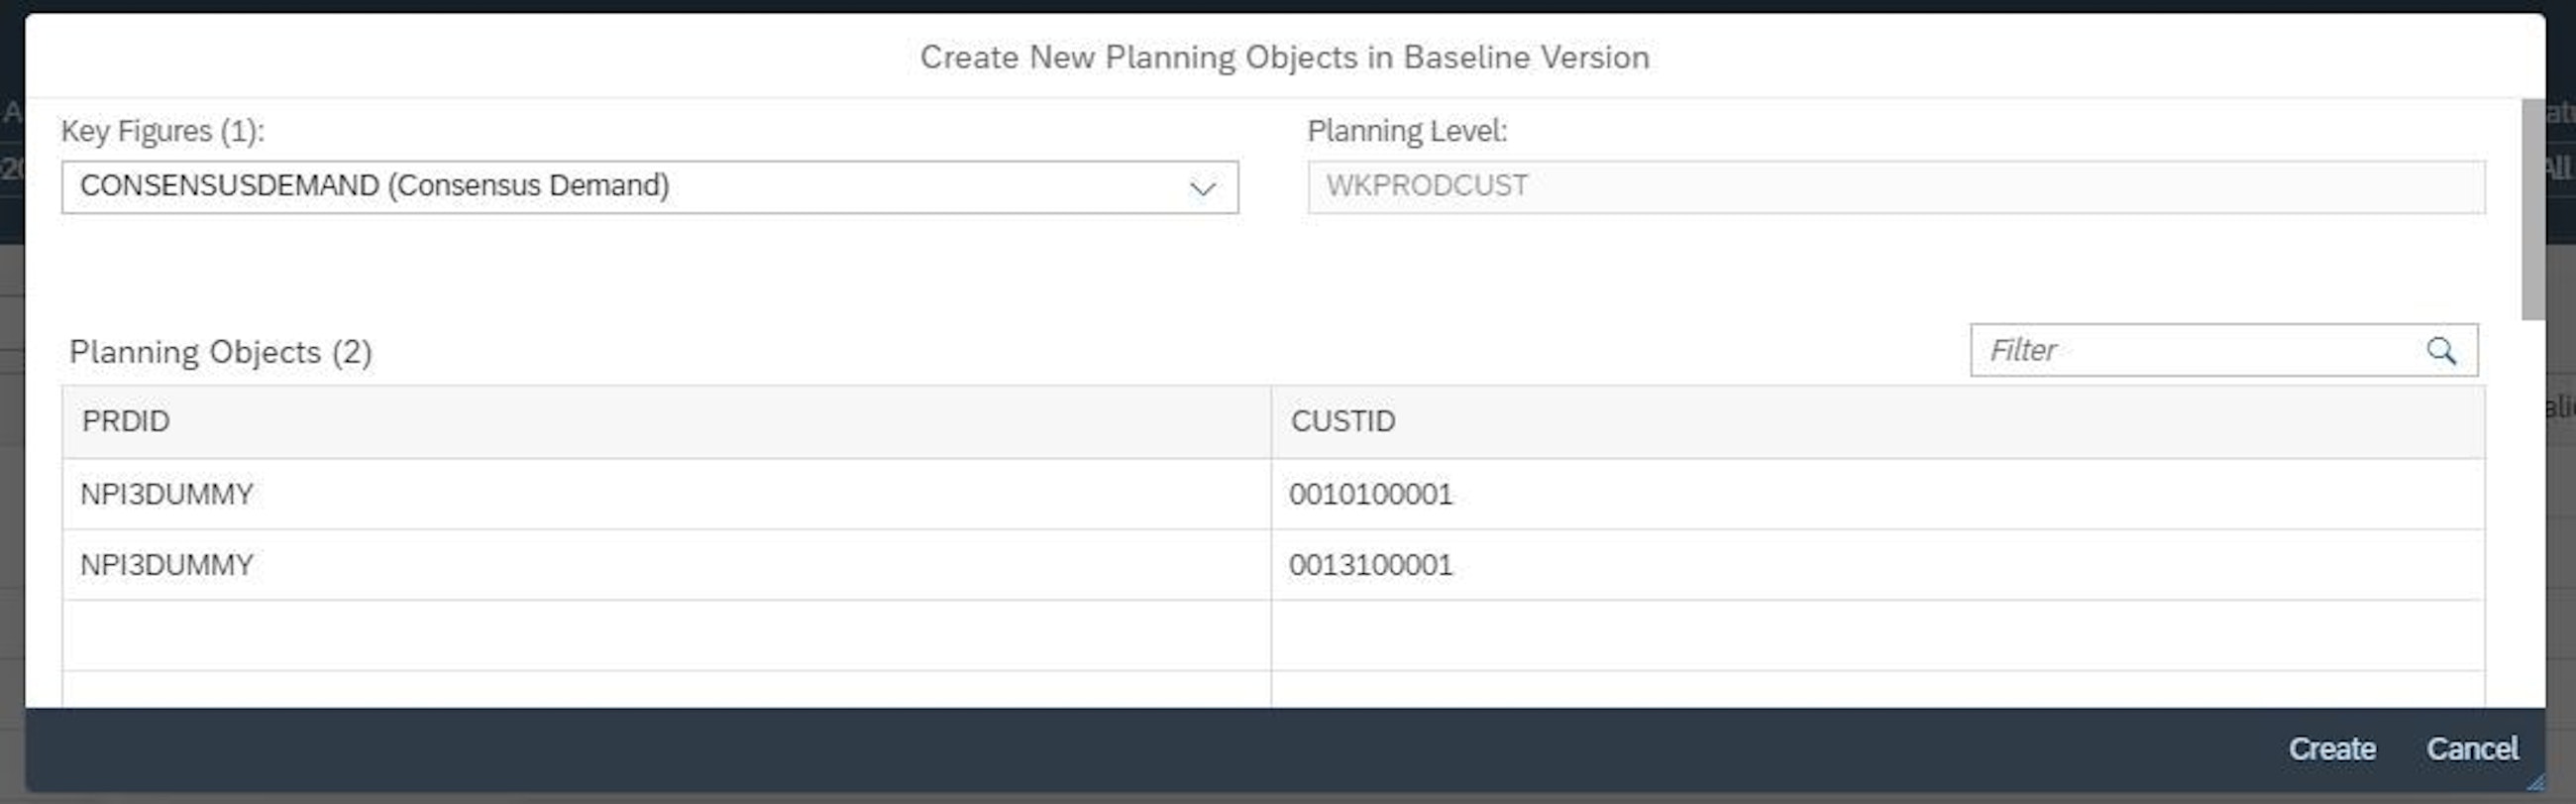
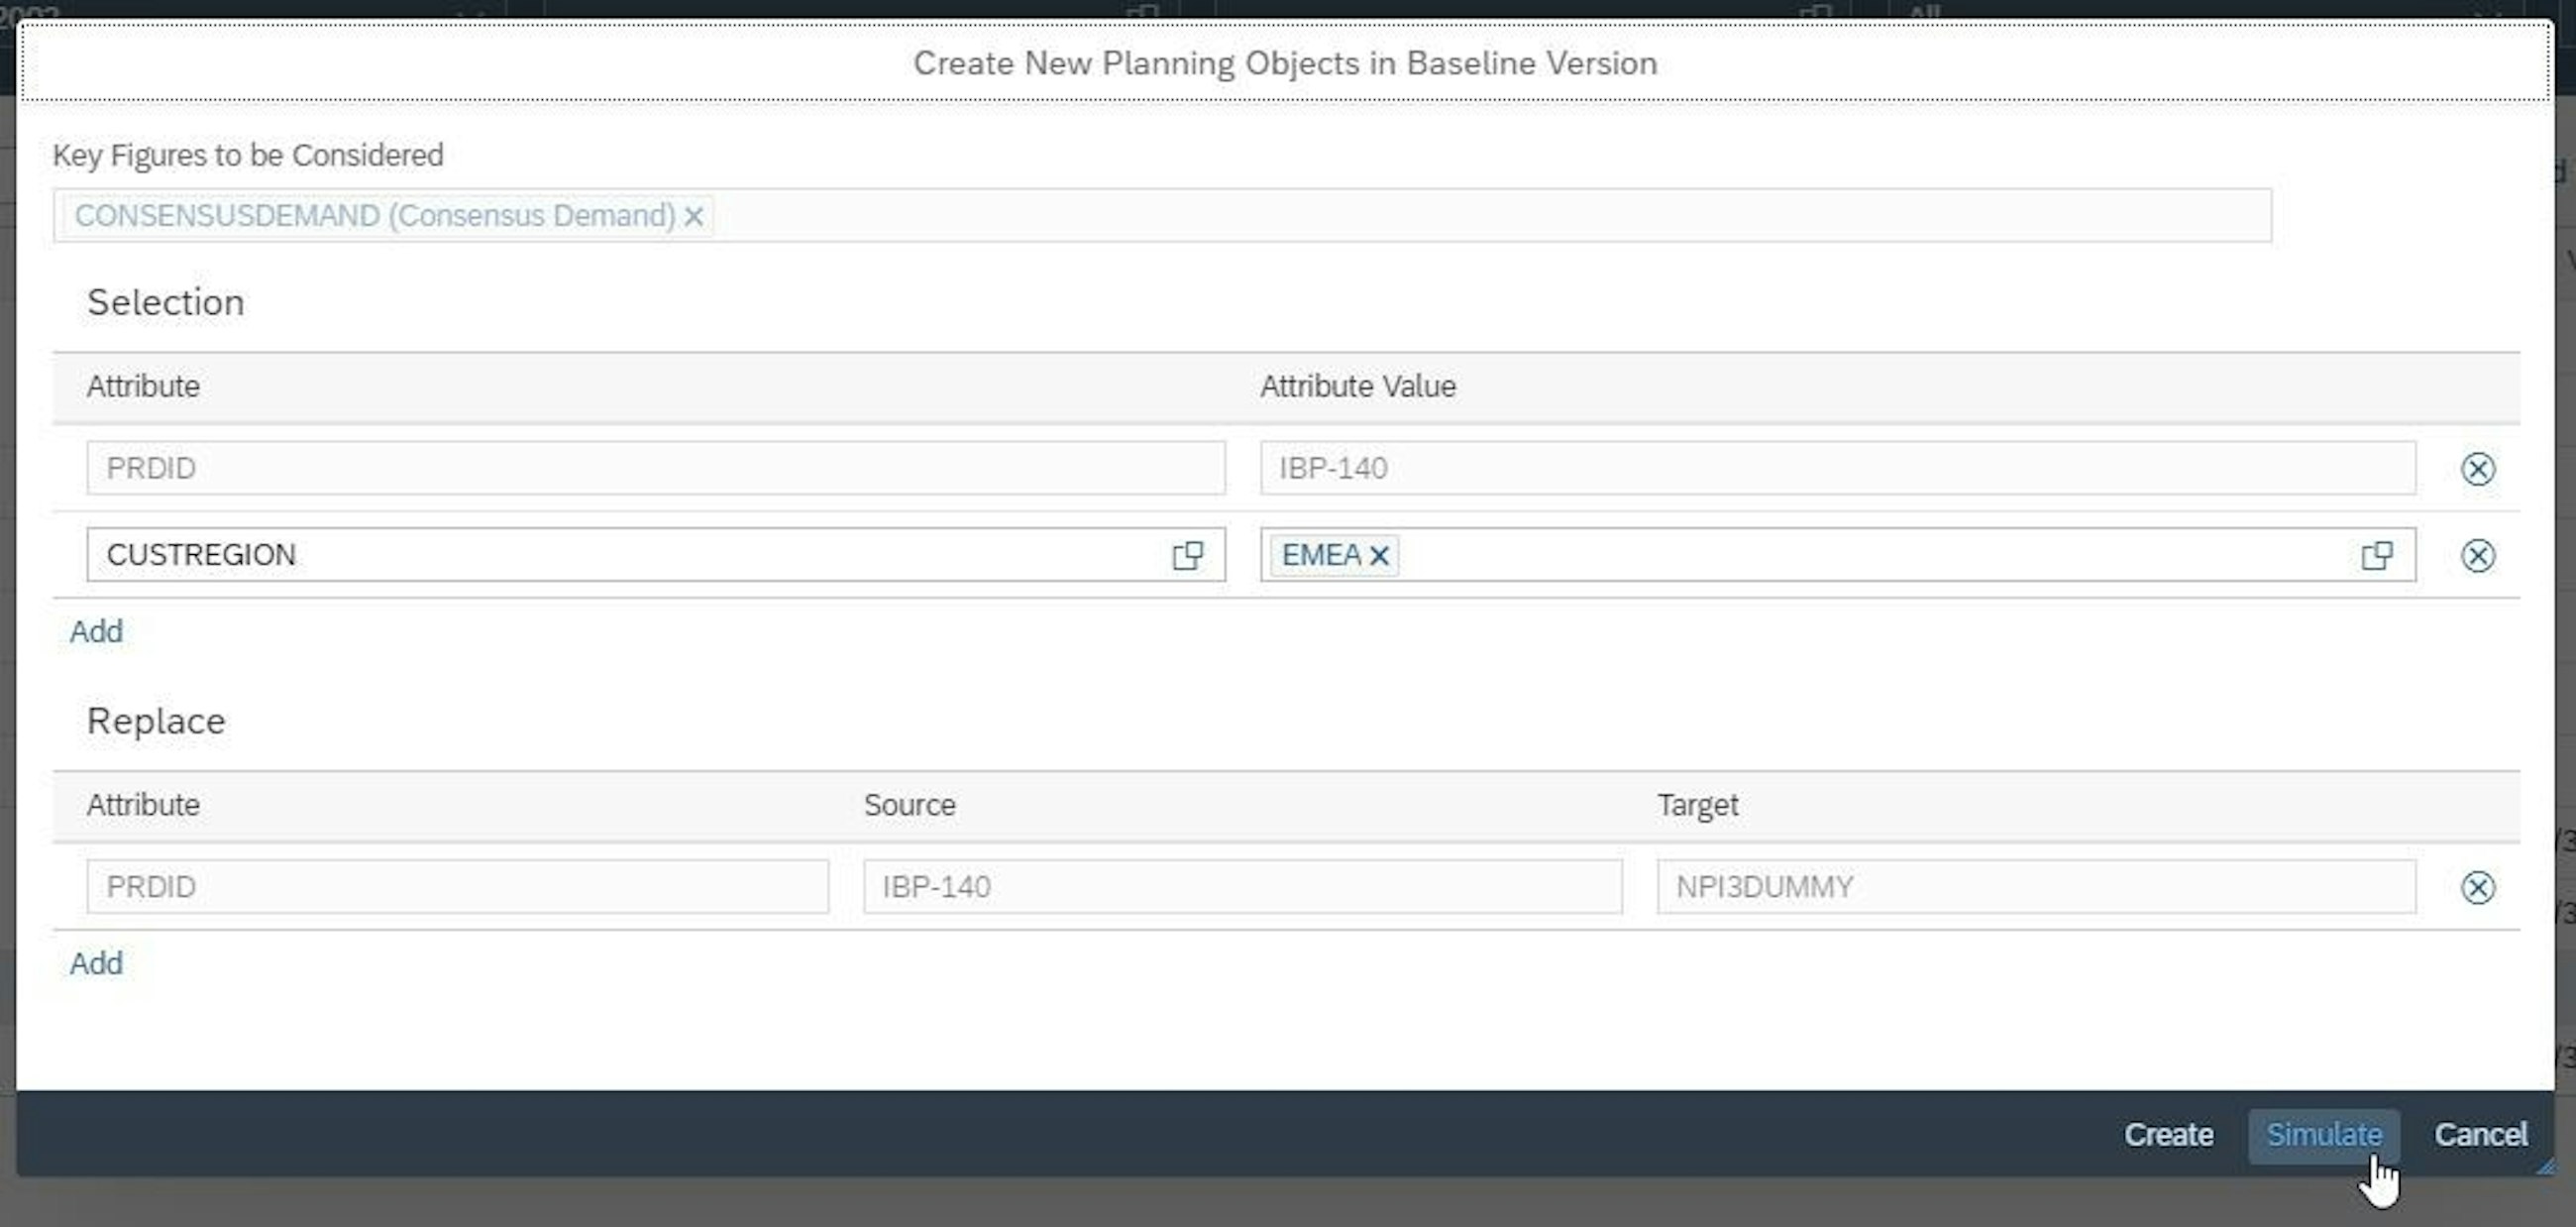
Object creation settings and result of simulation
Another advantage of using this option is that you can run a check before launching the planning object creation, and if the system cannot create planning objects for a key figure, you will get a message explaining the reason. This is useful, especially when a number of limitations still apply. Even though there is some way to go, we believe that things are moving in the right direction, and we are excited to see how this functionality will be further improved in the near future.
Another improvement in the area of product lifecycle management is the introduction of a new forecasting feature: manual forecasting.
The manual forecasting approach is useful if reference products are not available for the new products being launched or in cases where the company’s business processes require planners to create a manual forecast, e.g. based on planning experience, internal ways of working, supporting systems etc. Using the new manual forecasting functionality, planners can create a forecast for the new products that is 100% based on manual input.
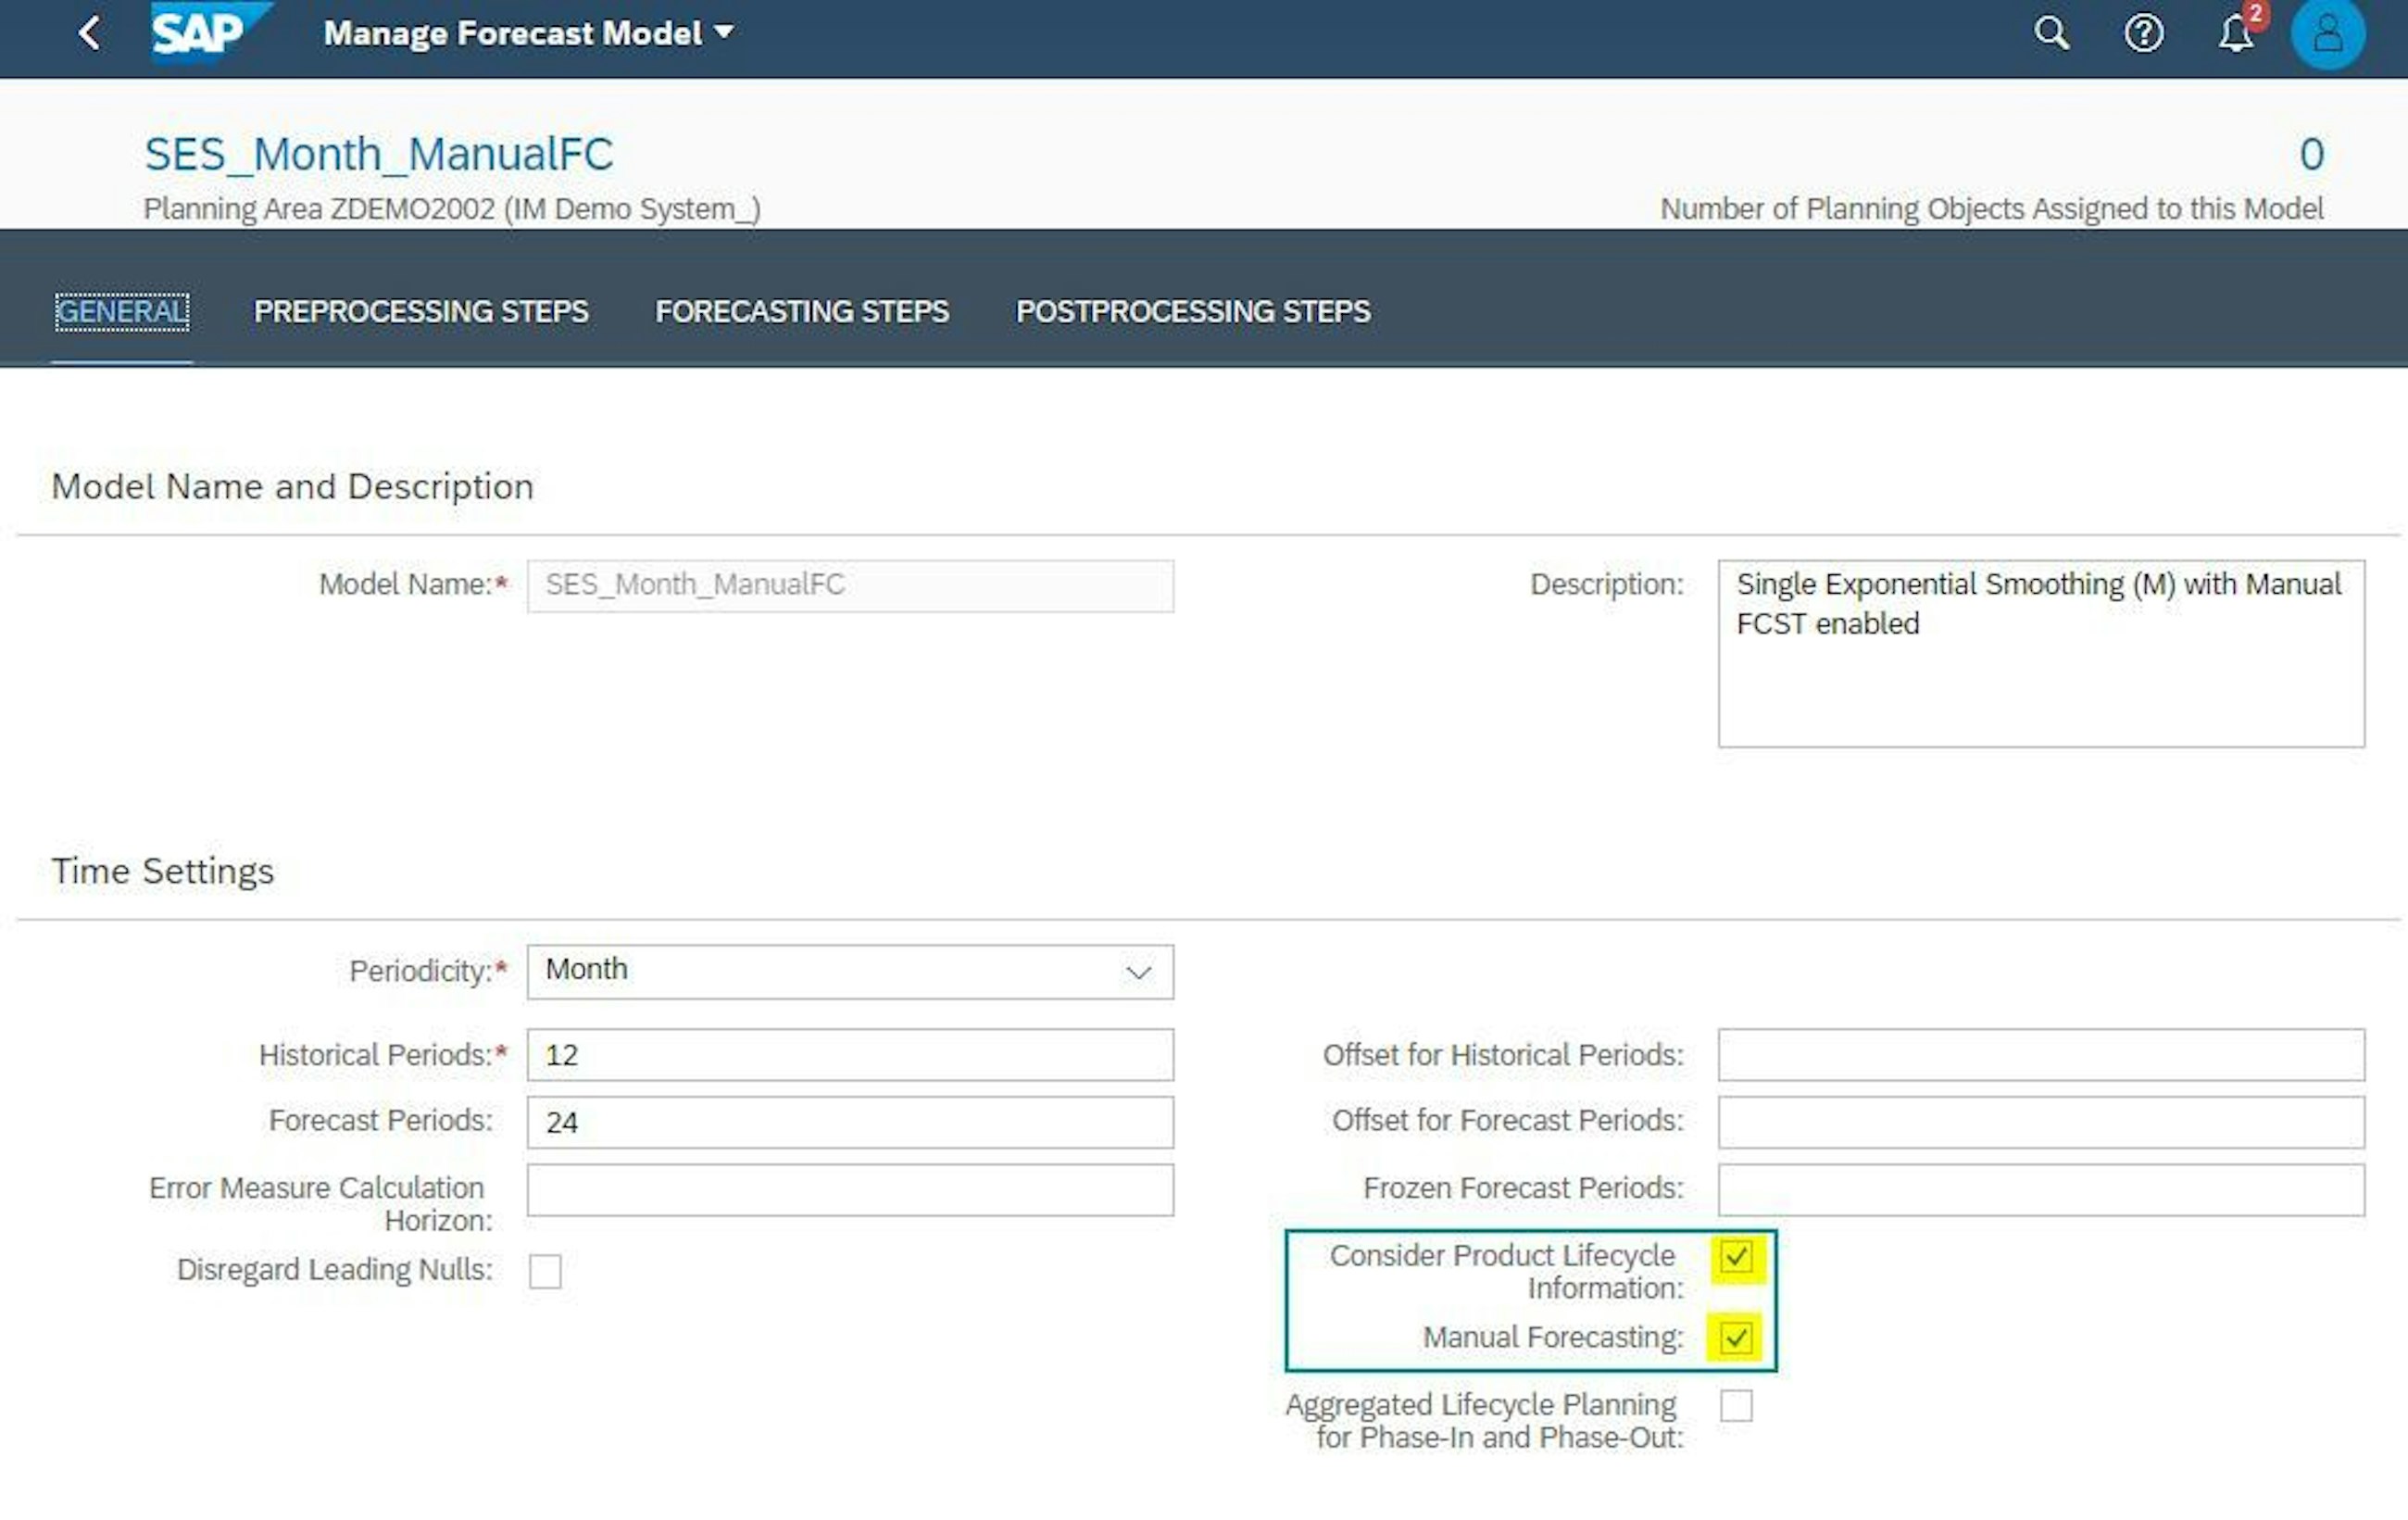
To enable manual forecasting, you first need to enable it in your forecast model via the Manage Forecast Model app where the prerequisite is to also activate the Product Lifecycle settings.
Product Lifecycle Information needs to be enabled to select Manual Forecasting.
You then find all the settings for manual forecasting in the Forecast Dates tab of the Manage Product Lifecycle app. All you need to do is to choose a unit of measure and periodicity and enter the forecast start, phase-in start and phase-in end date. You can then enter the quantity of products you expect to sell in the defined forecasting period.
Example of manual forecasting settings.
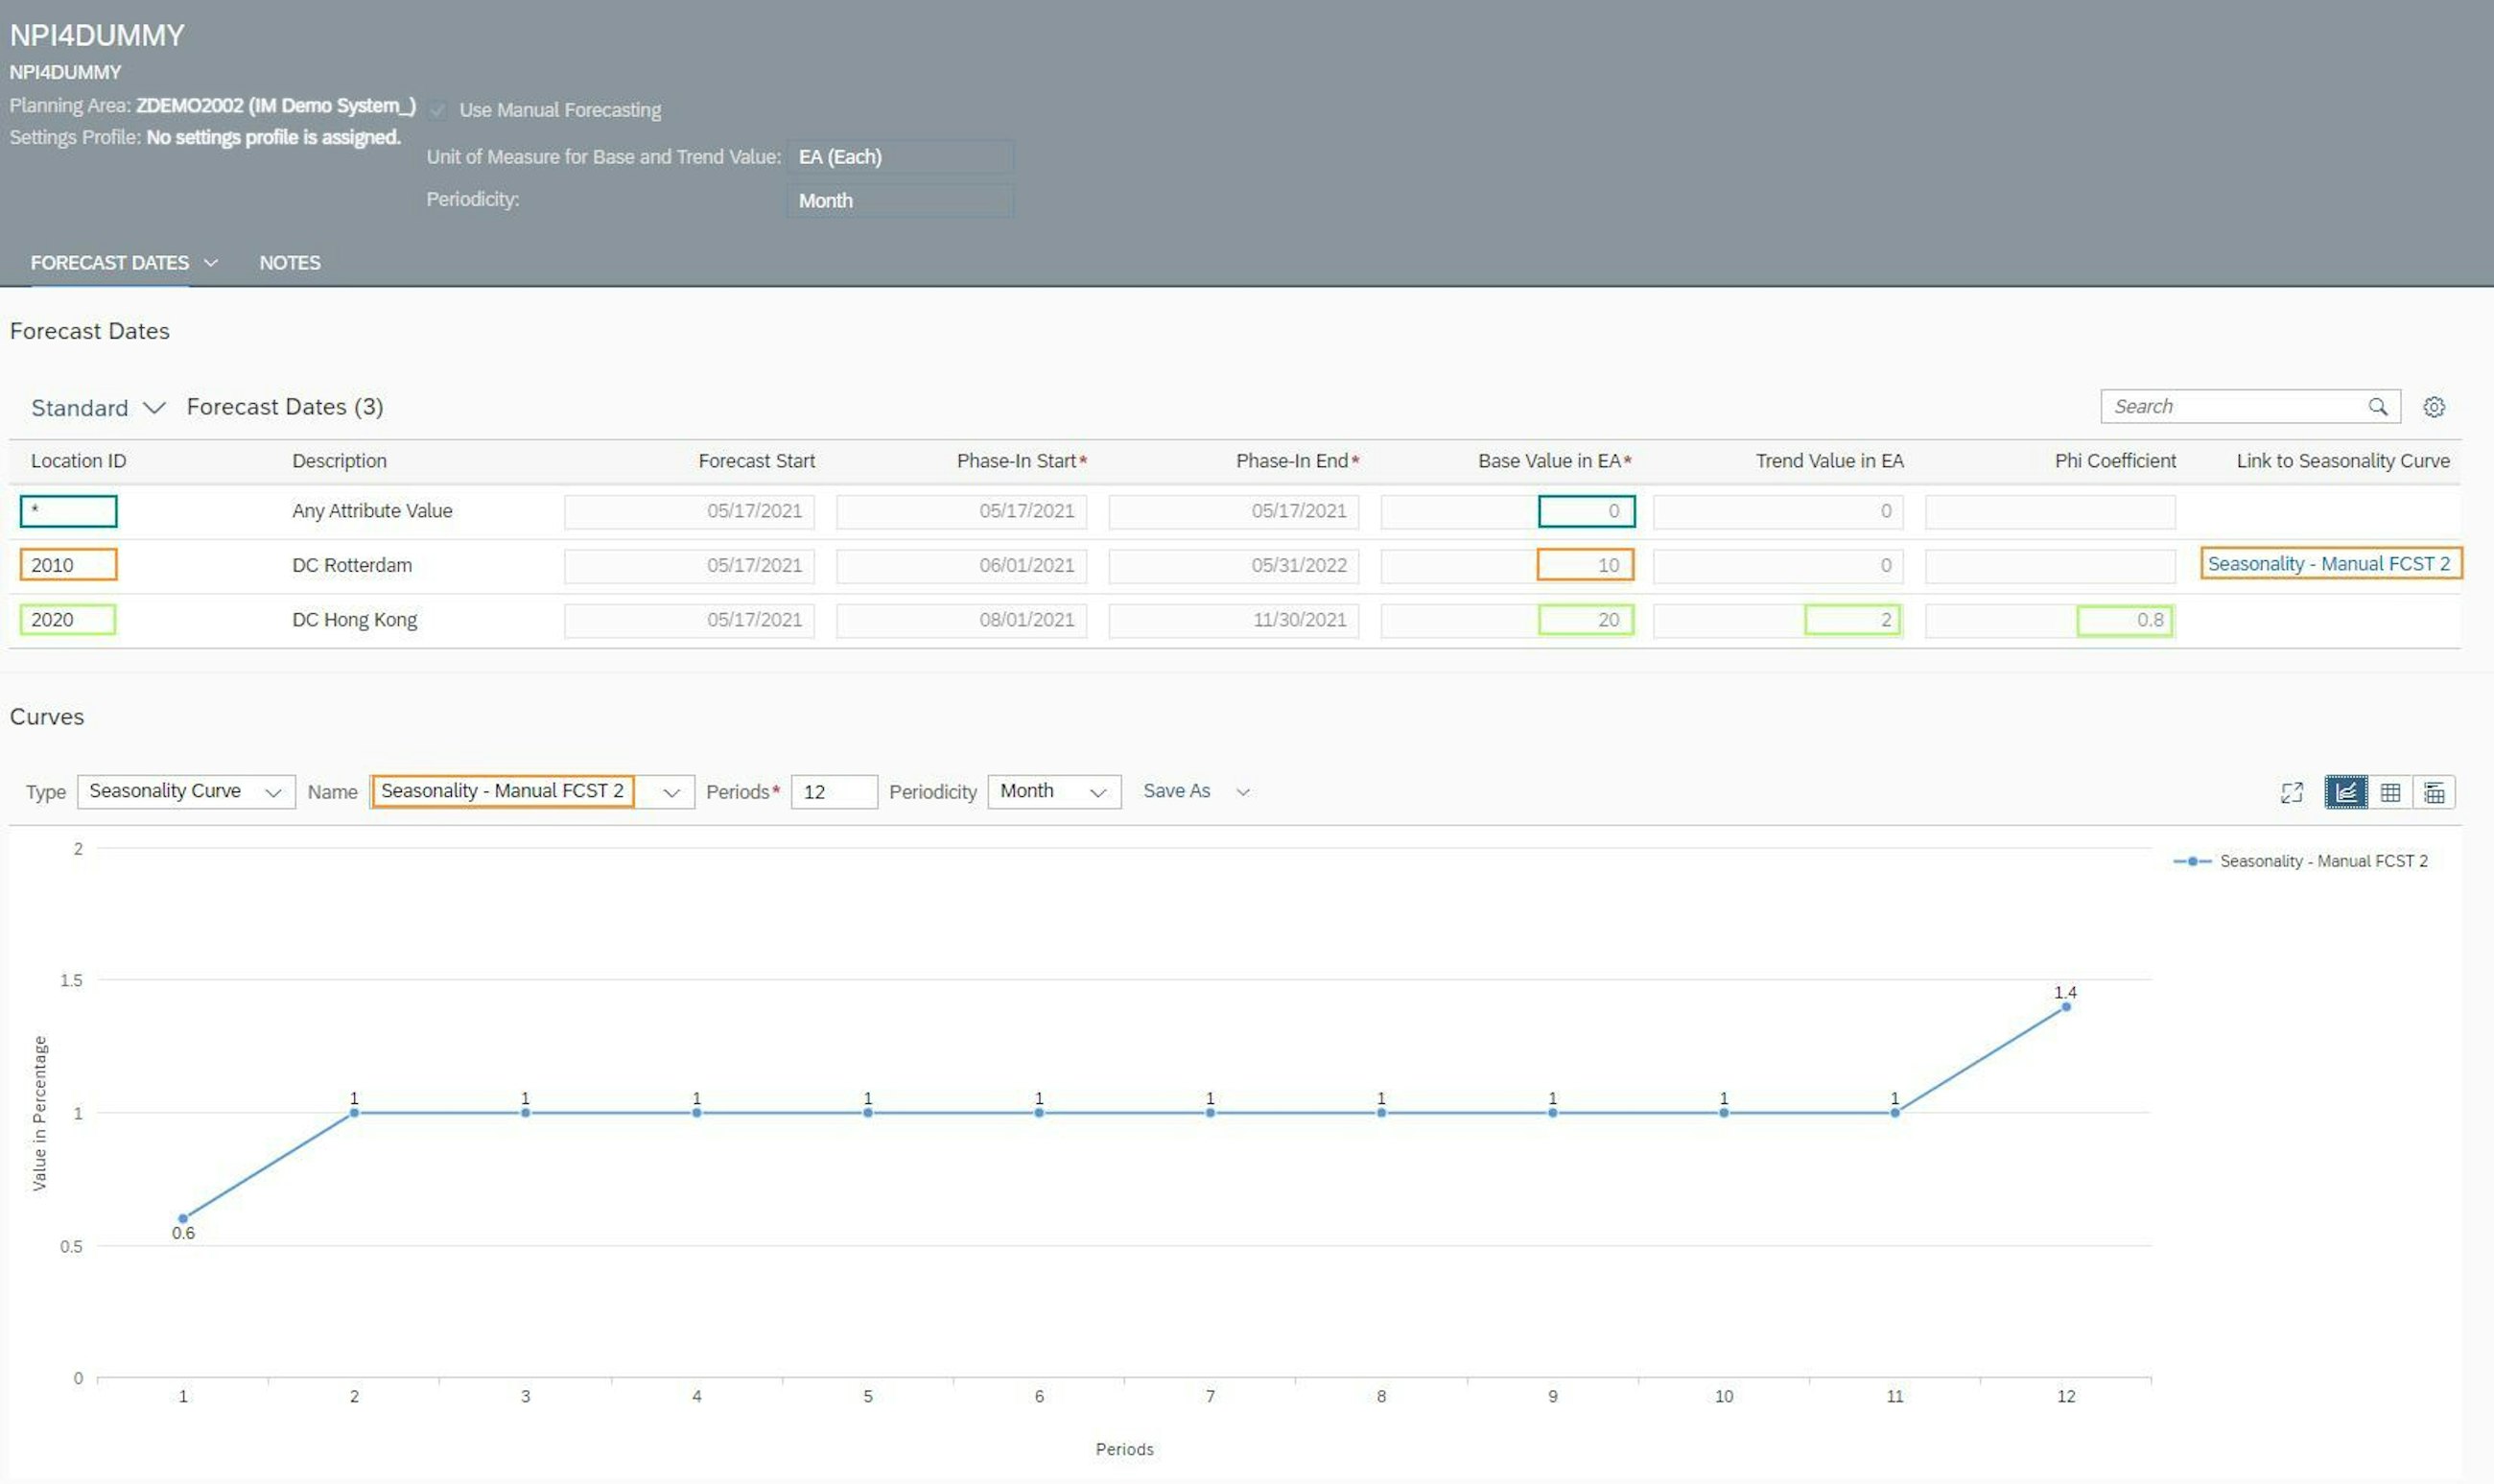
This base value should be greater than 0, except in cases where you want a statistical forecast to be created instead, e.g. if you are launching a product on a new market while it is already selling in other markets. As you can see in the image above, the products are being launched in two locations, and the remaining locations are identified with an asterisk – here the demand will be forecasted according to the statistical forecast model. Besides the base value you can optionally maintain for each launch dimension, trend and seasonality parameters to account for a potential increase in sales and/or seasonal variation.
The forecast is calculated for each location based on the manual forecasting settings and considering the phase-in dates.
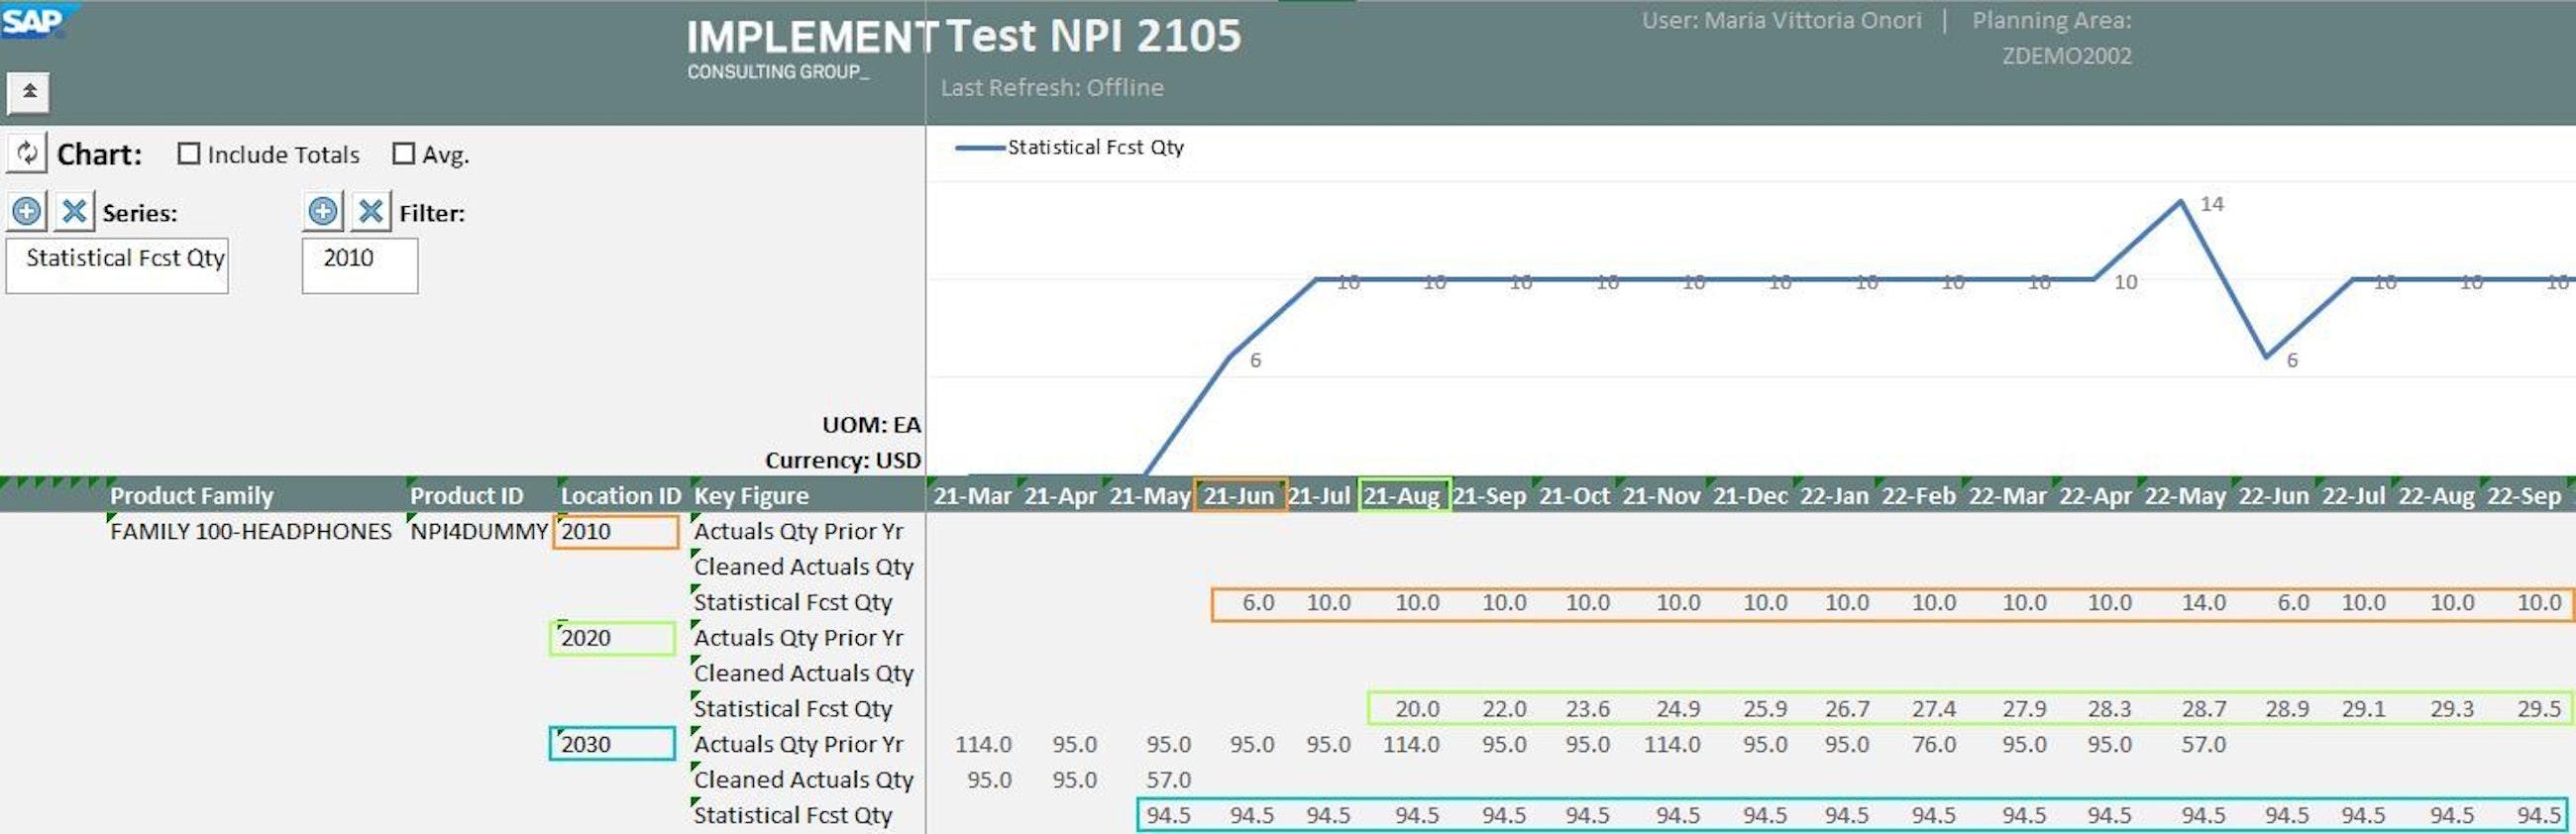
Be aware that limitations apply, e.g. demand sensing is not available in combination with manual forecasting, and forecasts can only be carried out for existing planning objects, which need to be created manually.
Read our previous blog posts 11

Article
Read more

New features of SAP IBP 2011
Five selected features of the 2011 upgrade of SAP IBP.Article
Read more

New features of SAP IBP 2008
Five selected features of the 2008 upgrade of SAP IBP.Article
Read more

New features of SAP IBP 2005
Five selected features of the 2005 upgrade of SAP IBP.Article
Read more

New features of SAP IBP 2002
Five selected features of the 2002 upgrade of SAP IBP.Article
Read more

New features of SAP IBP 1911
Five selected features of the 1911 upgrade of SAP IBP.Article
Read more