Article
Five selected features of the 2102 upgrade of SAP IBP


Article
Read more
17 February 2021
Five selected features of the 2102 upgrade of SAP IBP
When the demand for a given product follows a predictable cyclic variation, we refer to this phenomenon as seasonality. Some concrete examples of seasonality occur when the demand for ice cream is higher during hot months, when orders peak during the Christmas season, or when sales decline during the summer holidays due to production shutdown.
These variations are predictable, and thus every demand planner knows that it is important to consider seasonality when forecasting future sales. There are different methods and approaches; but basically, they all come down to applying the seasonal pattern observed in the past to the future.
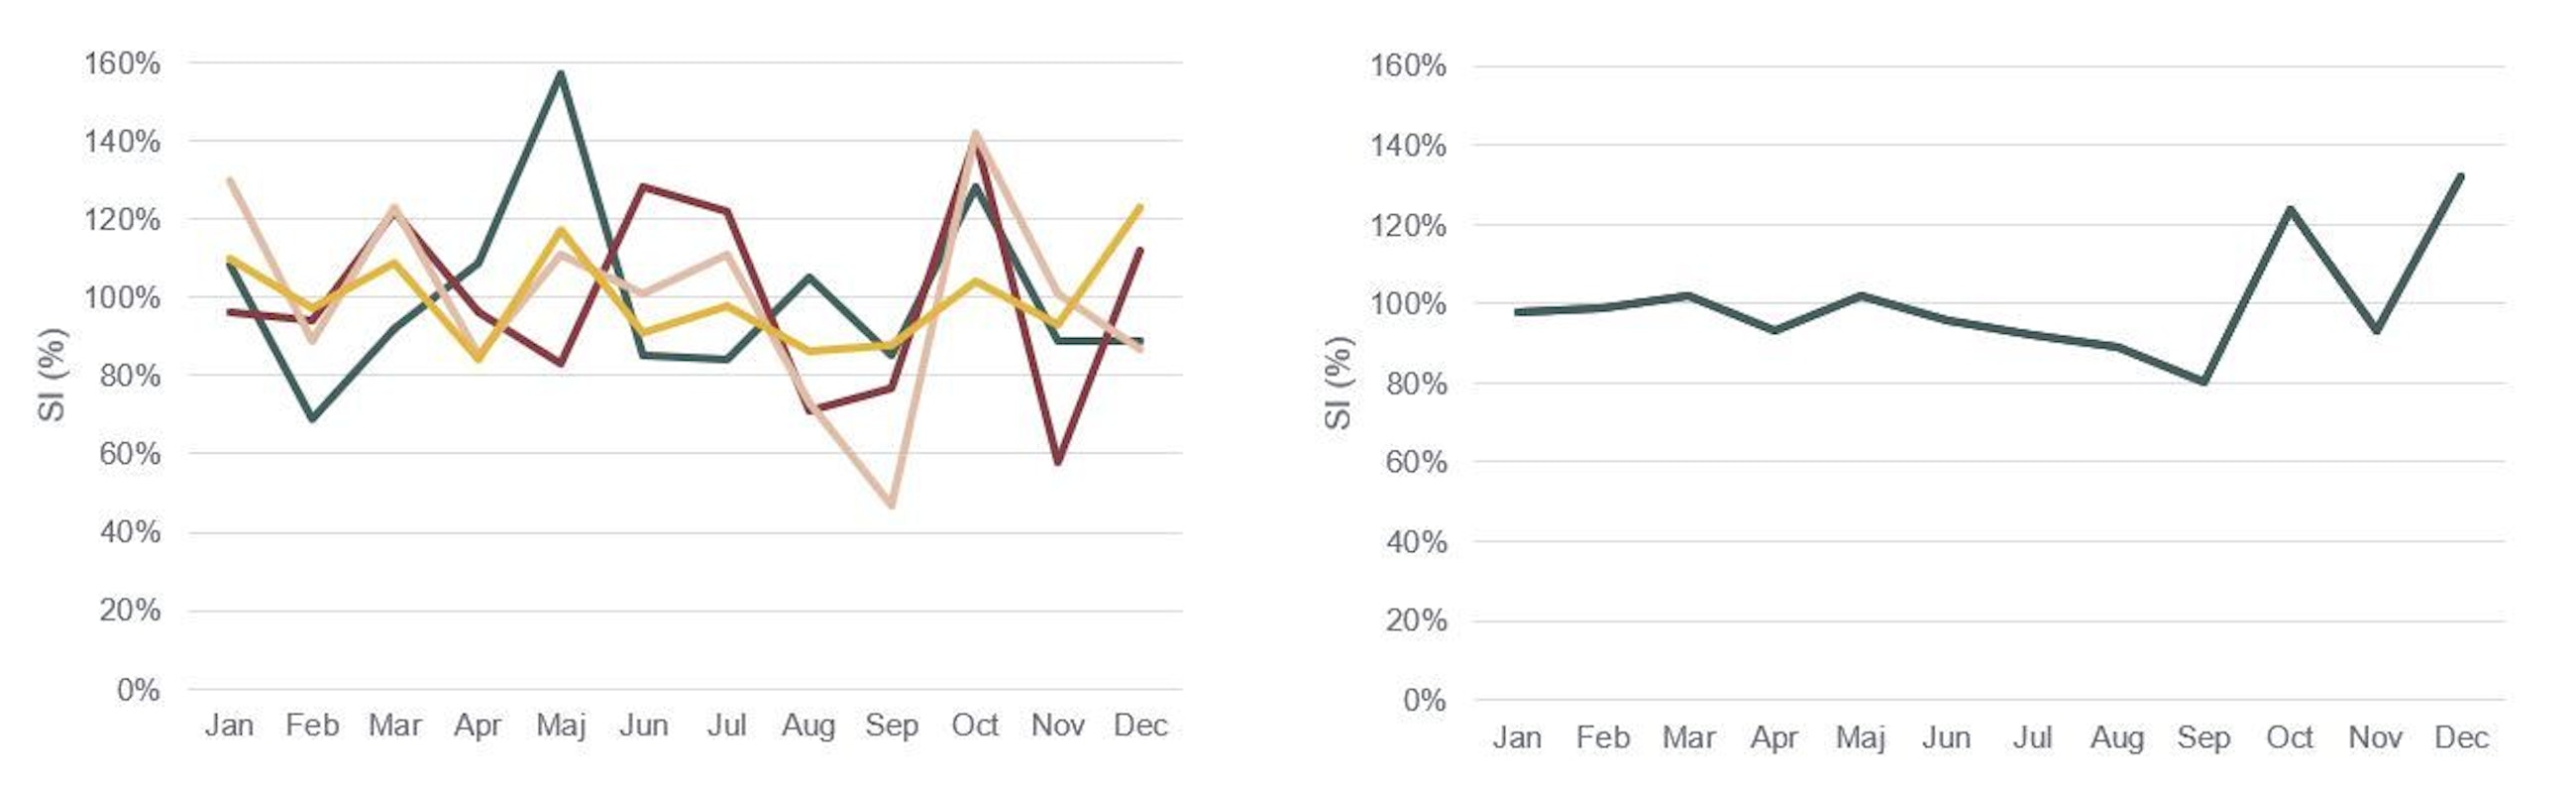
Up until now, seasonal patterns could only be identified in SAP IBP at the same level as they were applied, i.e. the level at which the forecast was saved, typically very detailed. Using this method has some drawbacks. It cannot be used for products that have only recently started selling as we need at least 12 months of history (or even better, 24-36 months)1 to calculate a seasonal profile; and it can also be very difficult, at a detailed level, to distinguish between seasonality and ordinary variance. Given the shortcomings of this approach, we often advise companies to work with Group Seasonality instead.
Working with Group Seasonality, you identify seasonal profiles at an aggregated level and then apply them to the lowest level, e.g. by multiplying the constant forecast created on Product ID/Customer ID level with the Seasonality index identified at a higher level. The benefits of this approach are that it can be used for all products (even products with no or few months of sales history), it is easy to understand, and it usually provides a better representation of true seasonality as sales are aggregated across a bigger range of products.
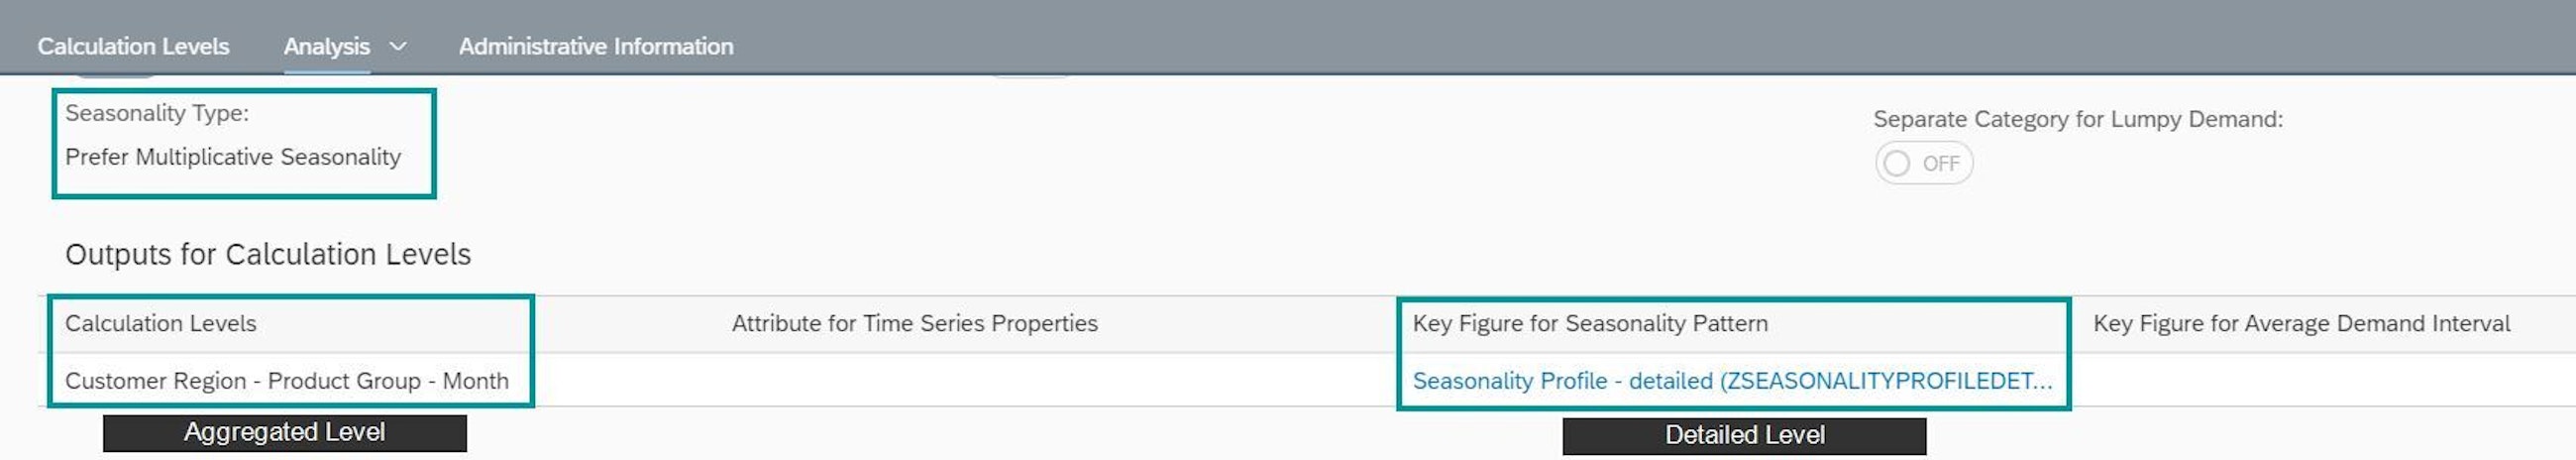
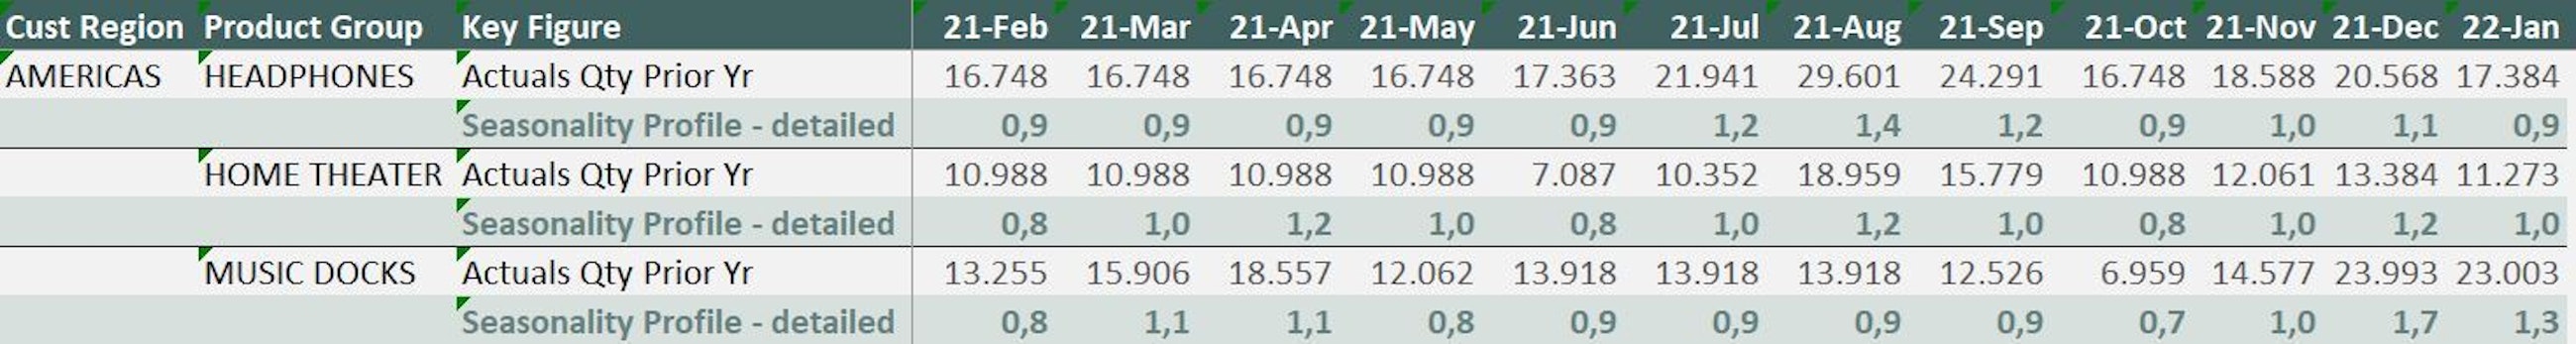
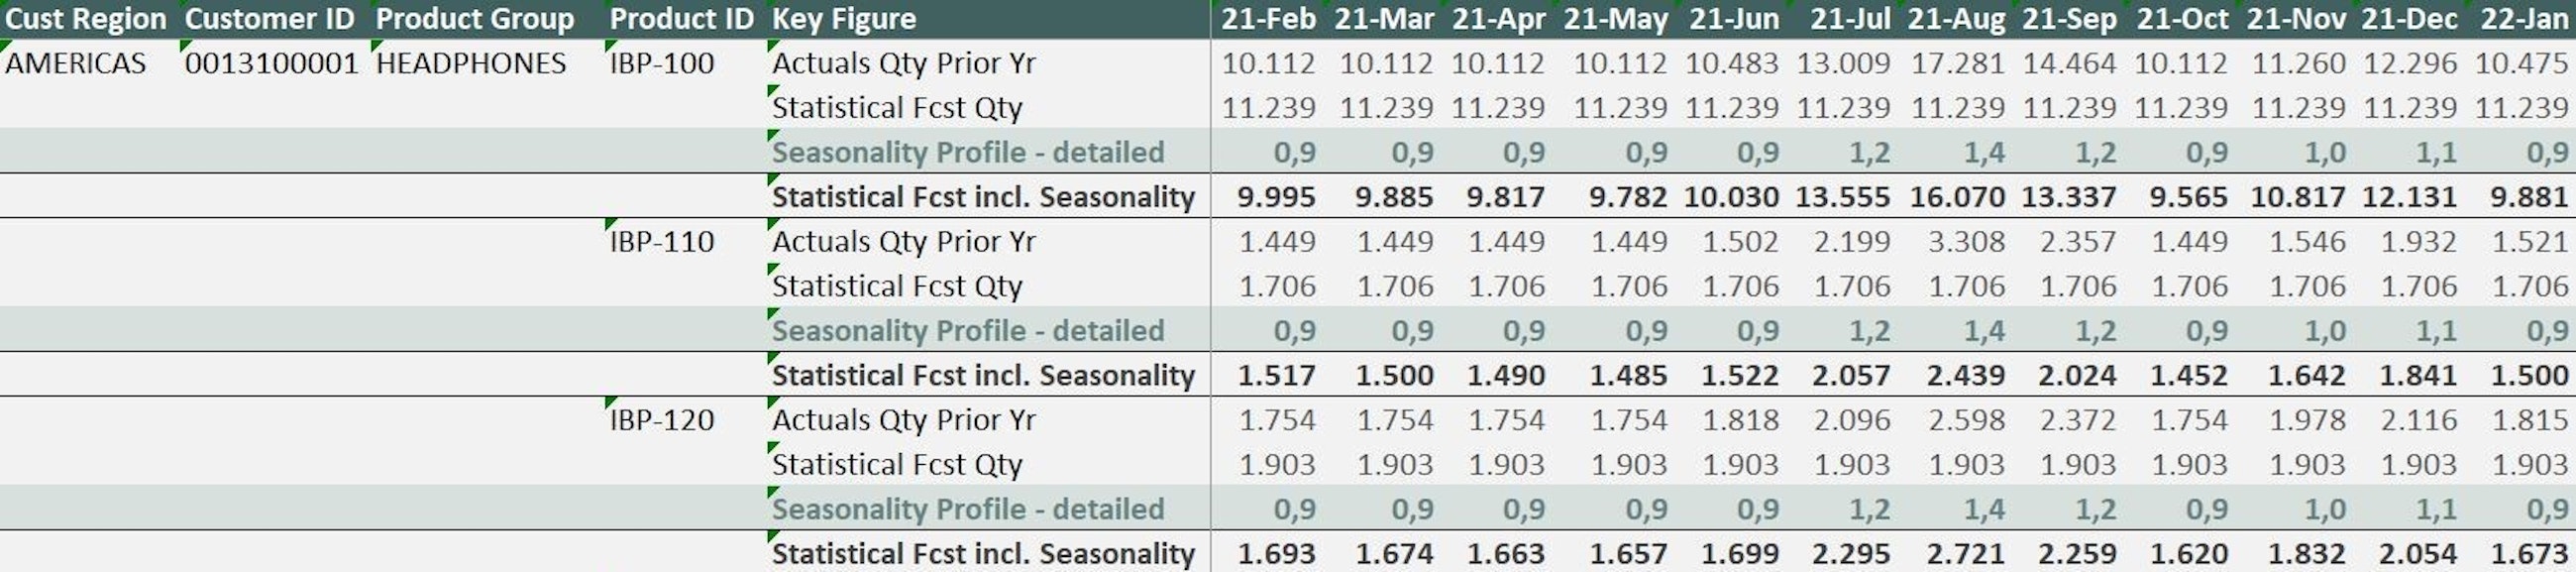
Over the last few years, we have built custom-made solutions for our clients to use this approach, and now we are excited to see that with the 2102 upgrade, Group Seasonality is now fully supported by SAP IBP via the already existing app Manage Forecast Automation Profiles2. So, how does it work? Basically, we can set the calculation level of forecast automation at an aggregated level such as Product Group/Region. The seasonal pattern is identified at this level and then copied down to e.g. Product ID/Location ID level. It is then possible to use the aggregated seasonal pattern as an independent variable in MLR, Gradient Boosting or (S)ARIMAX or just as a factor to multiply the constant forecast calculated via Single Exponential Smoothing.
In our opinion, this is a great enhancement to IBP’s time series analysis capabilities, and we are sure that a lot of companies could benefit from such an out-of-the-box solution. At the same time, it is important to highlight the fact that IBP does not provide any support in identifying what level to calculate seasonality on. You need to evaluate this by analysing historical data and incorporating market knowledge.
If you want to know more about IBP capabilities in the area of forecast automation, have a look at our previous article:
1 The number of months is indicative and may vary depending on the industry.
2 The Manage Forecast Automation Profiles app is only available with the SAP IBP for Demand licence.
If you use (or have tried to use) the Product Lifecycle Management functionalities in SAP IBP, it is almost certain that you have experienced the following issue: planning combinations for new products are not automatically generated, and therefore, as a user, you have to do this manually.
If we introduce a substituting product in, let us say, a region based on a similar (reference) product, in many cases we would expect the customers buying the reference product to also buy the new one. Up until this release, there was no straightforward way to make this happen; and as a user, you had to actively create planning combinations to be able to make a forecast on the new product for the relevant customers. This was a manual and rather time-consuming exercise, and companies that due to the nature of their business have frequent product introductions definitely deserved a better solution for dealing with NPIs. Luckily, the 2102 upgrade provides a solid answer.
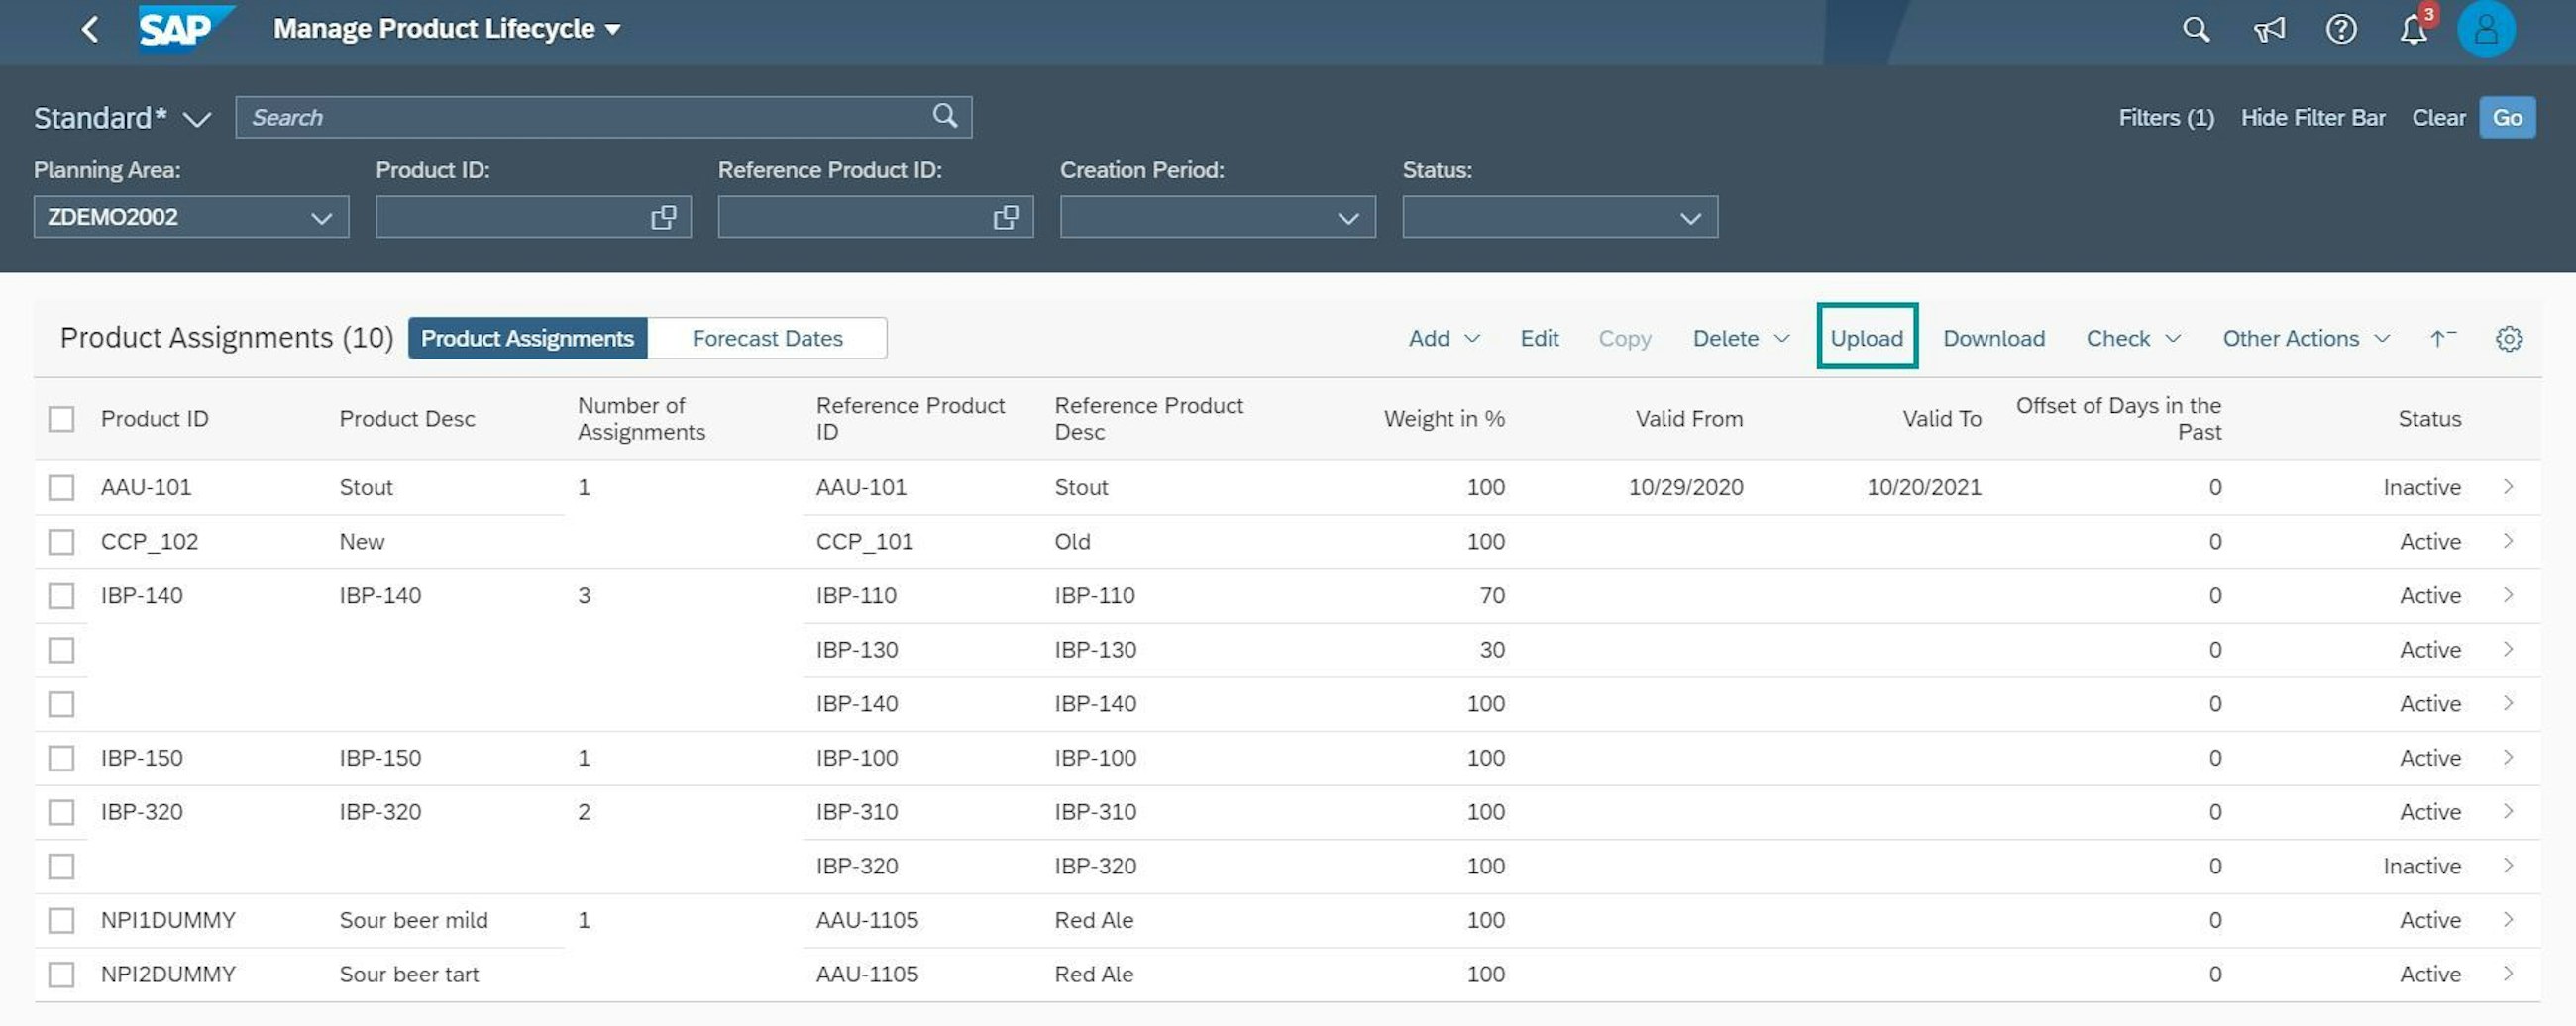
In the Manage Product Lifecycle app, you can now create the missing planning objects of a new product by simply copying the planning objects of the reference product. This is done via the upload feature for product assignments.
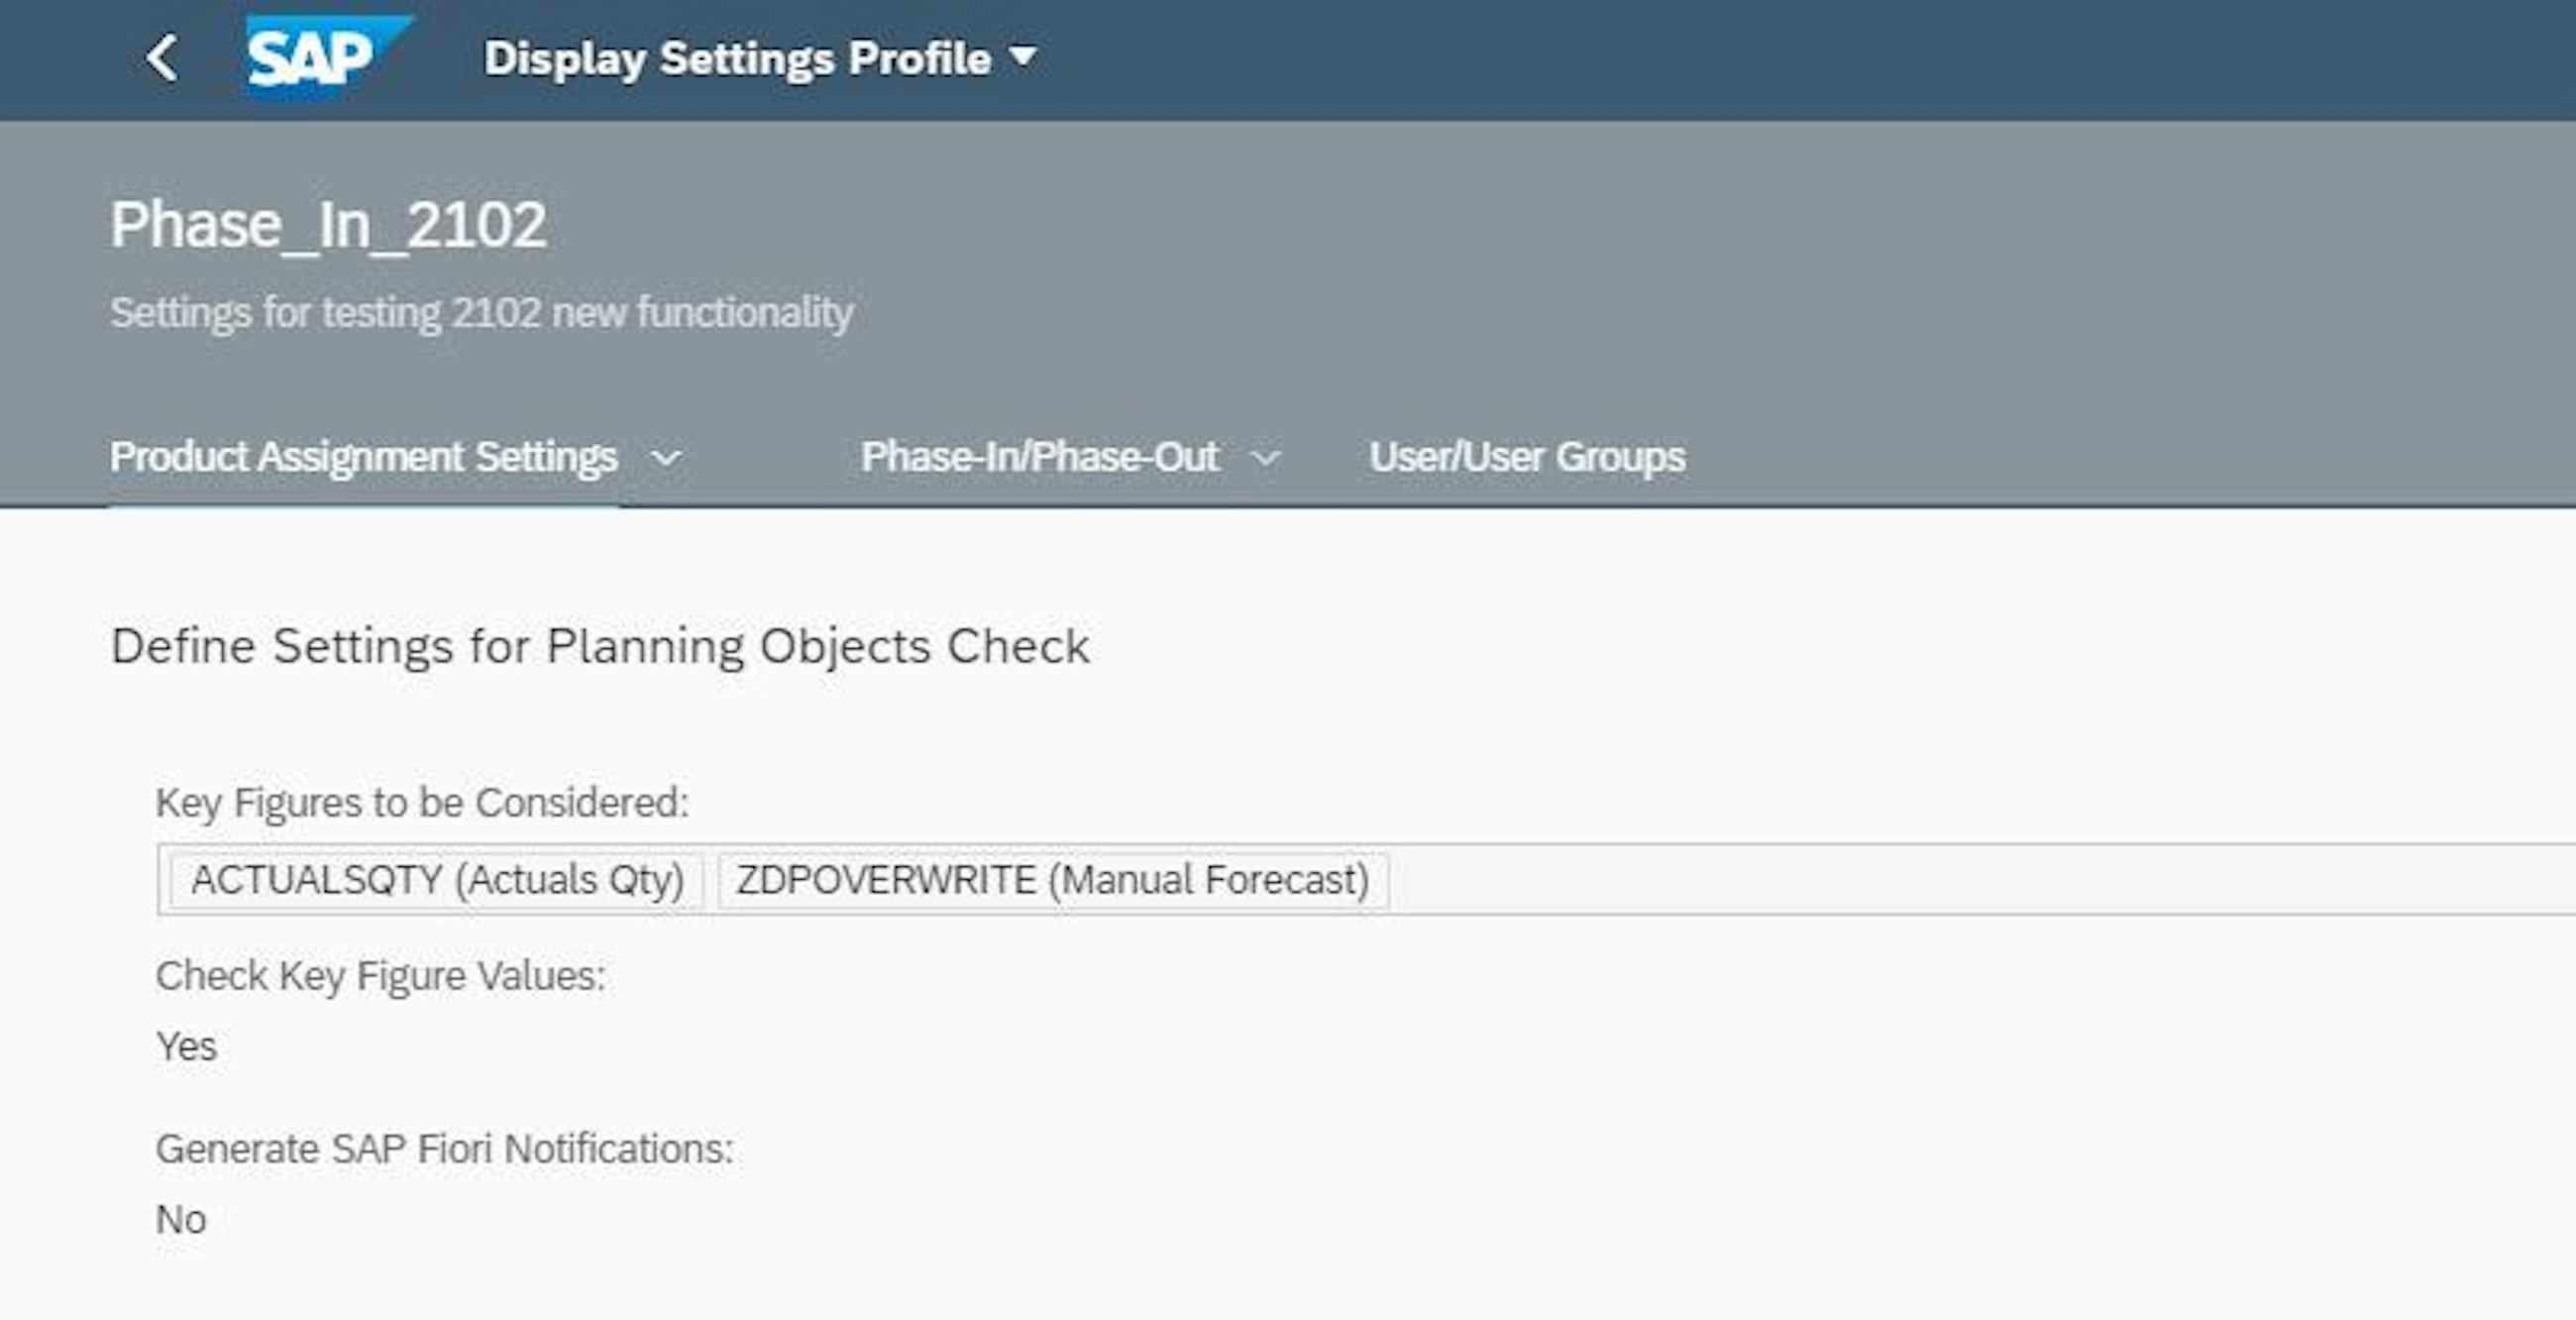
You create planning combinations based on a selection of key figures. By default, the key figures that an administrator preselects in the Settings for Product Lifecycle app are suggested (if defined), but users can add or delete key figures as needed. The system then creates planning objects for all planning levels of the selected key figures.
Some restrictions apply, so if you plan to start using this functionality, here is what you need to know:
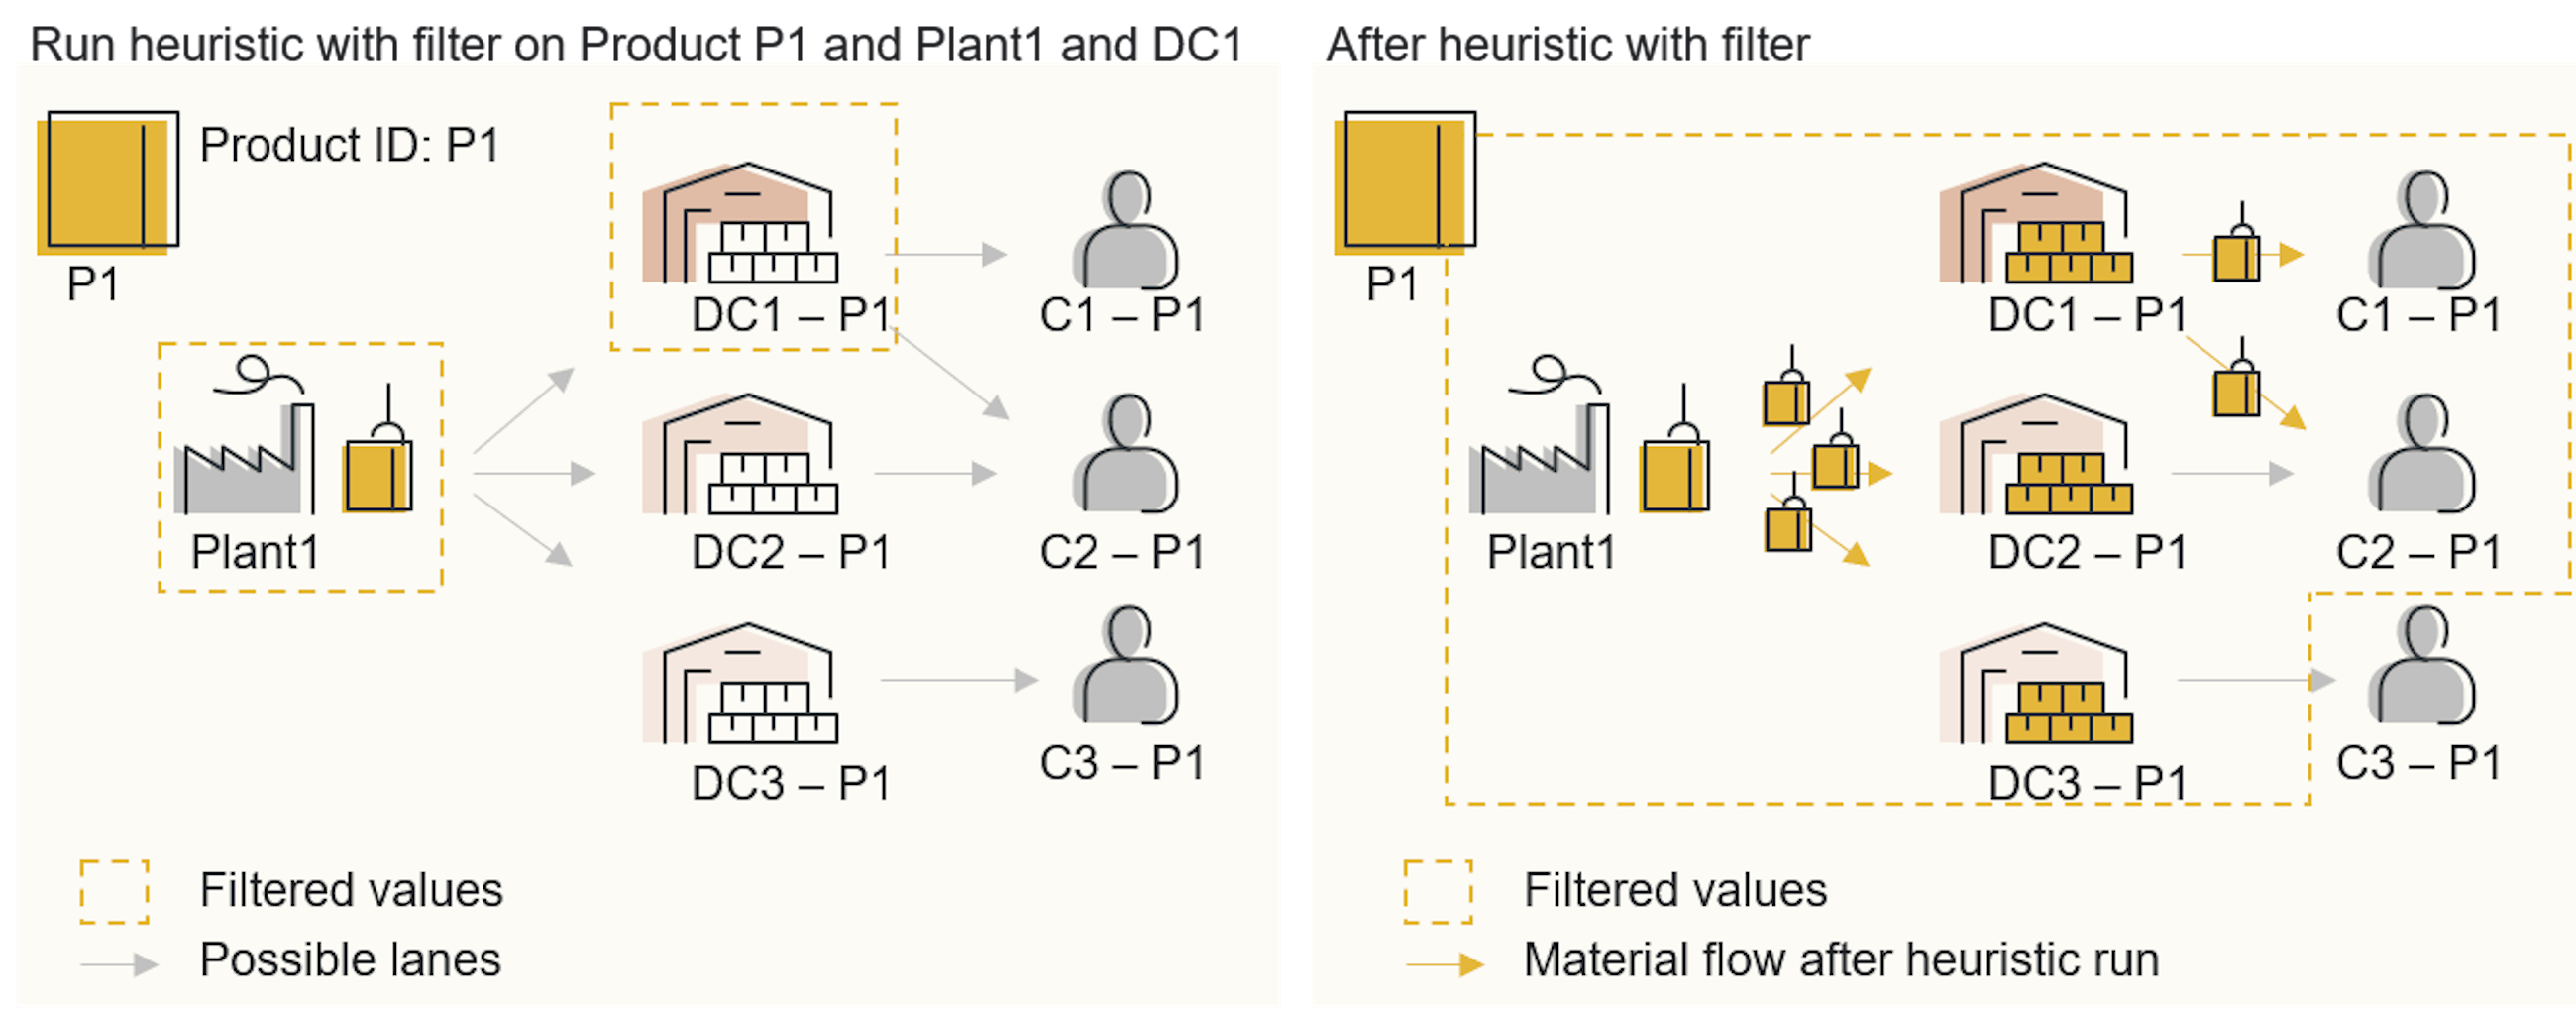
One of the cornerstones of S&OP and integrated business planning is the unconstrained supply plan created by propagating the demand throughout the supply network in order to identify capacity imbalances, shortages etc.
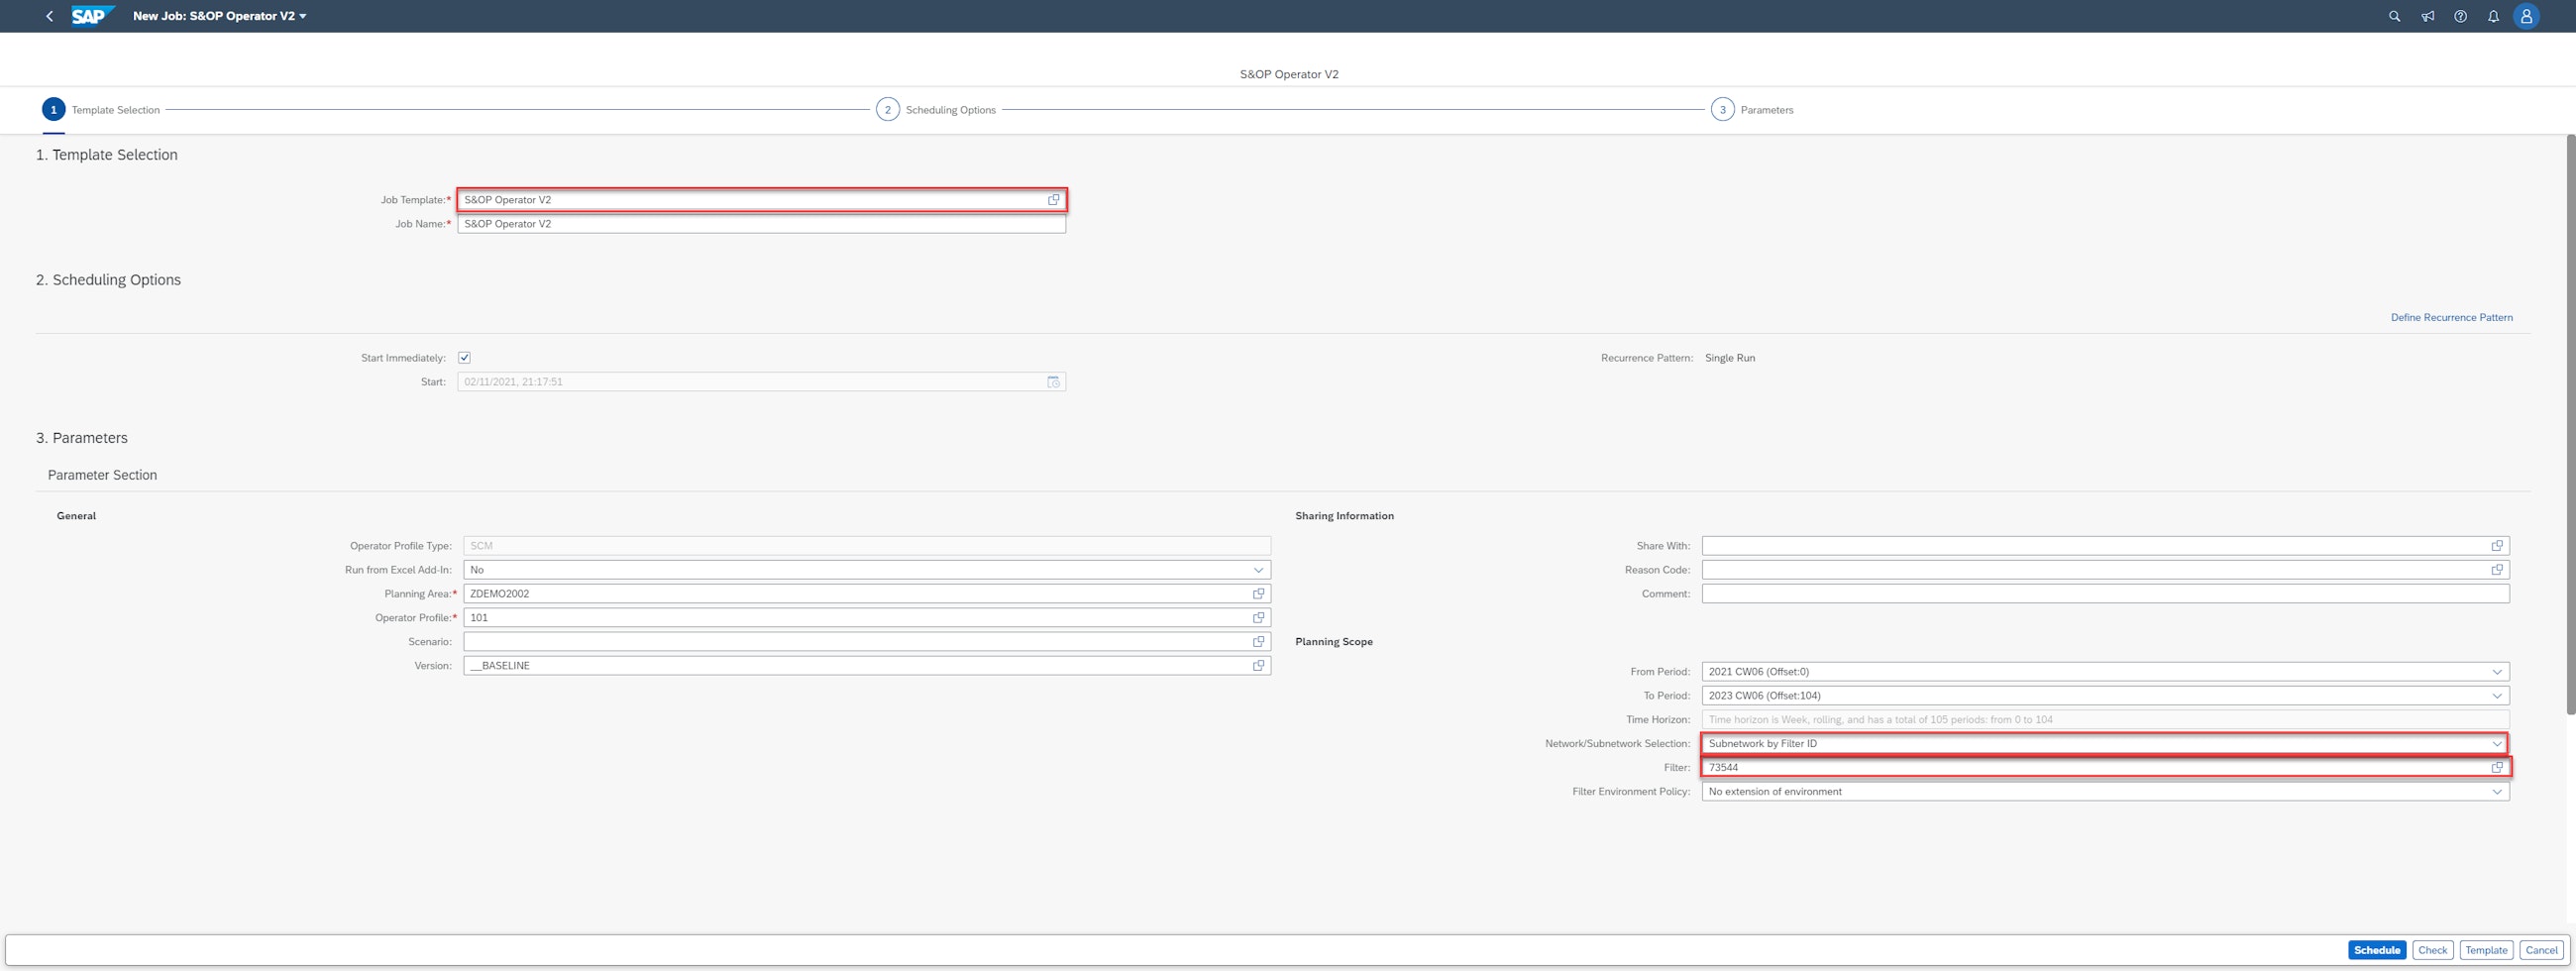
Up until this release, it has not been possible to limit the scope of the time series-based planning heuristic except running the heuristic for subnetworks; however, with the new upgrade of the heuristic, it is now possible to apply filters to it. Planners can now restrict a planning run to include location products within their area of responsibility or those affected by a change in input such as a sudden increase in demand.
For the new functionality to work, SAP has introduced two new application job templates:
Before this release, it was only possible to run it on Subnetwork ID; however, with the V2 operators, you can also filter IDs together with a filter environment policy. The five environment policies are:
A clear advantage of the new features is that it will typically result in optimised data selection and improved system performance when using the subnetwork selection by filter setting in the new application job templates. This of course depends on the planning filter defined by the users executing the model.
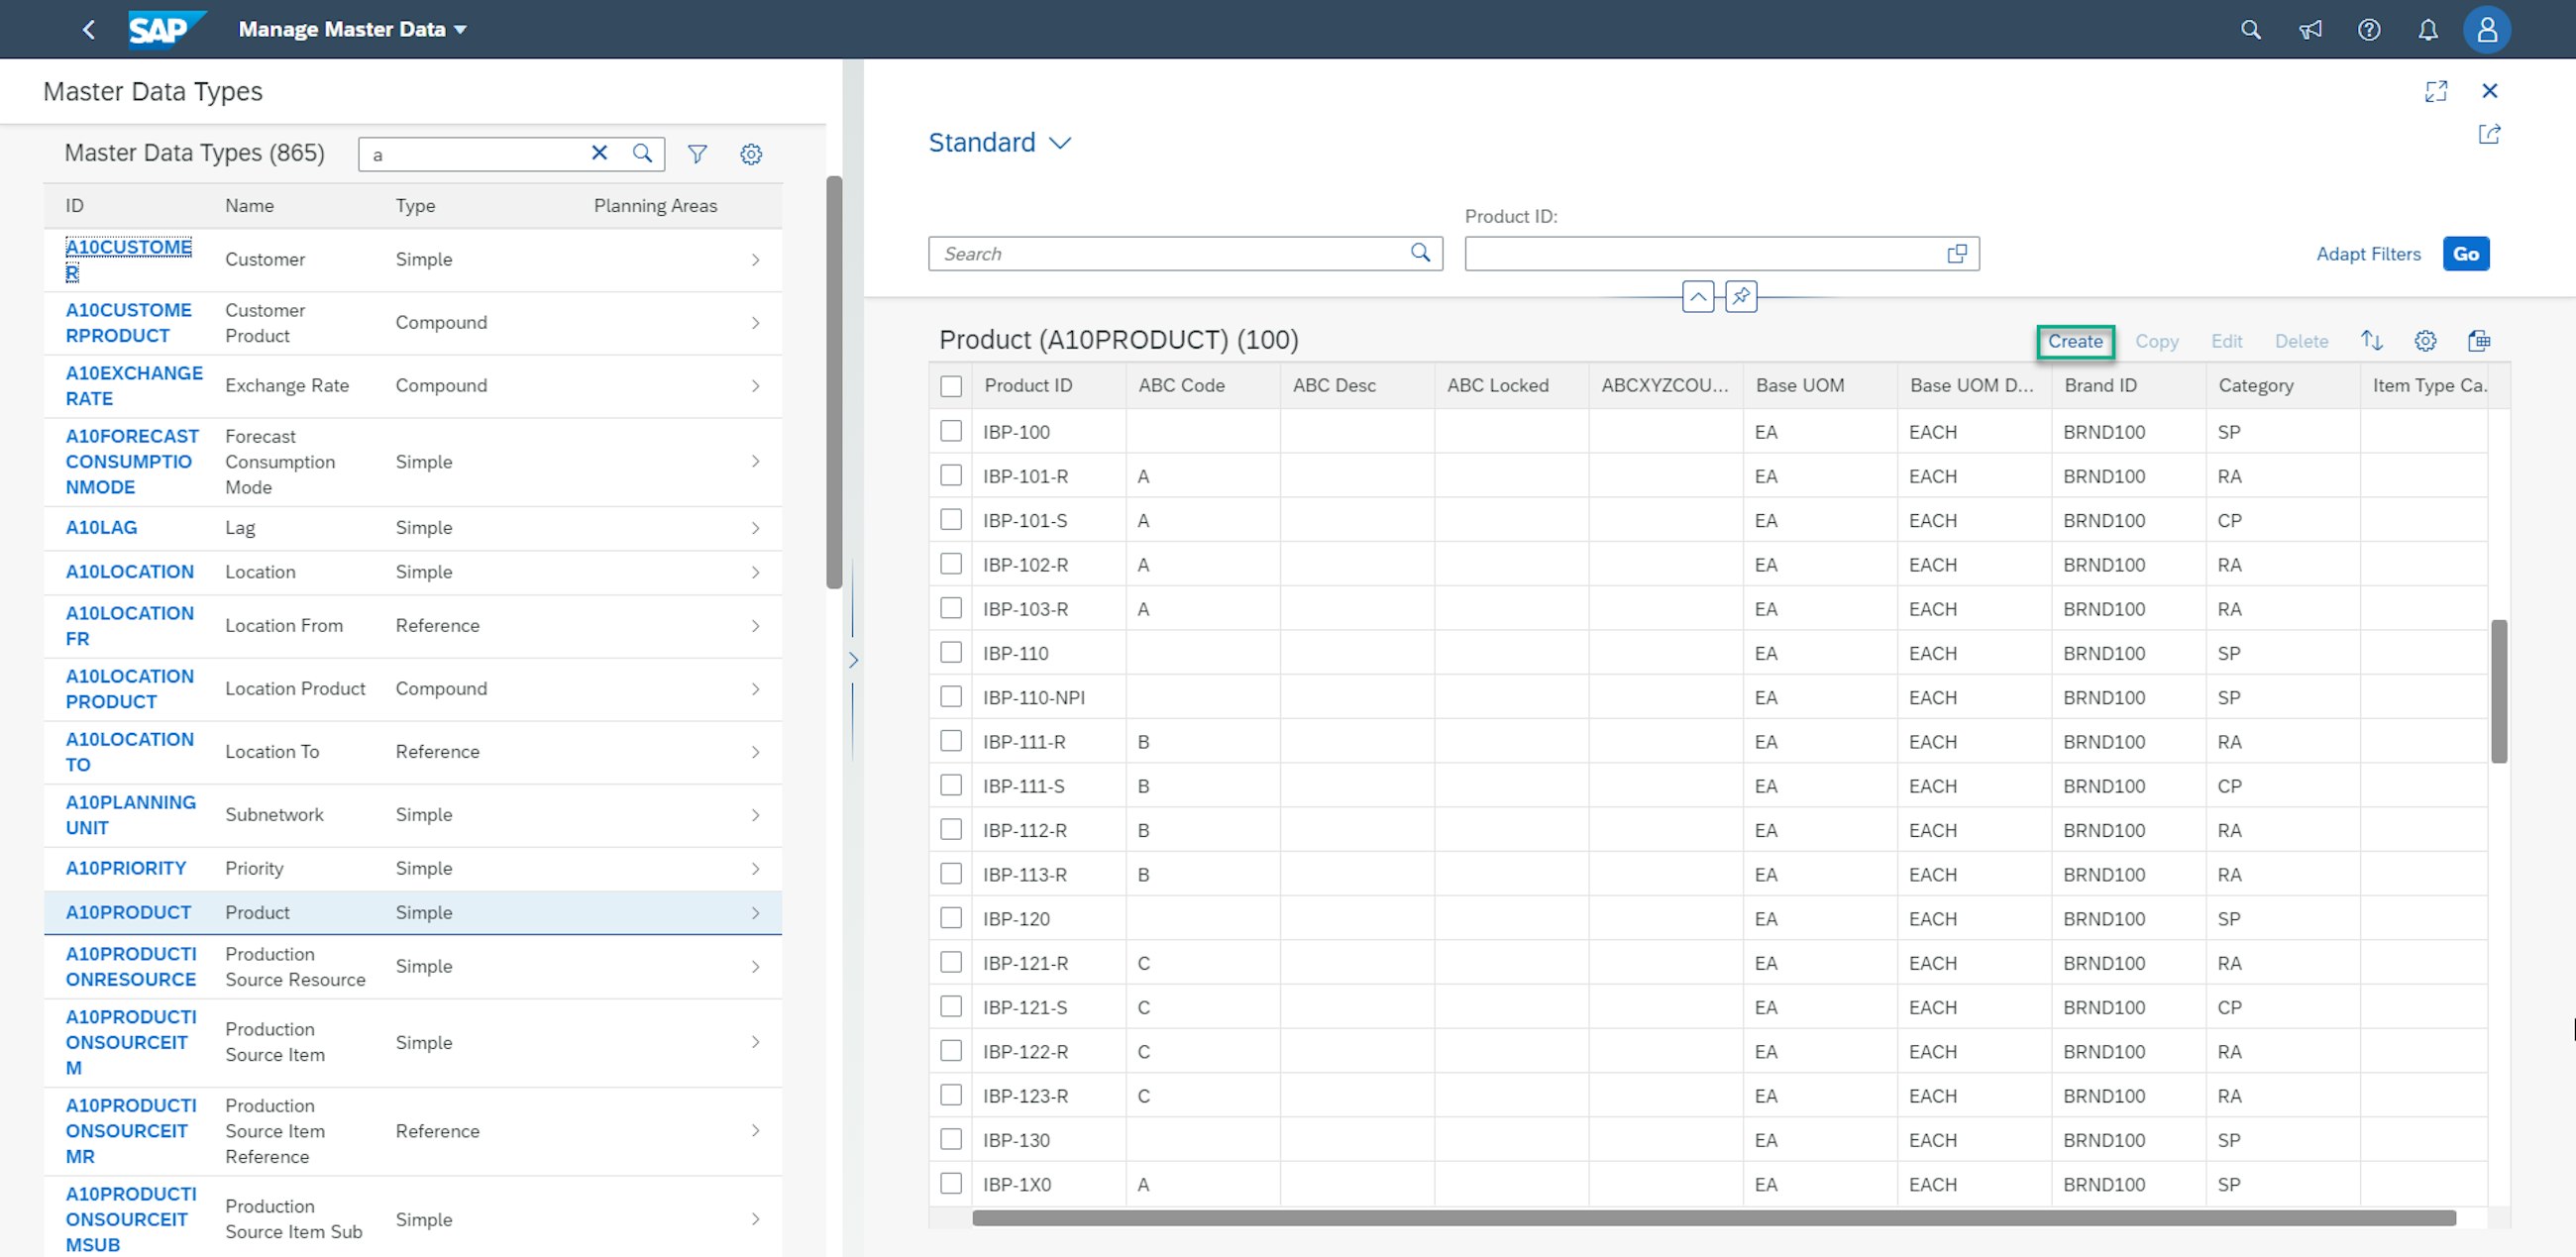
In the previous blogs, we have written about the improvements that SAP has made to web-based planning. And in the 2102 upgrade, there is another great improvement to working with SAP IBP in your browser, namely the introduction of the enhanced Manage Master Data Fiori app. With the new enhancements, it is now possible for users to view and maintain master data directly in the online apps.
For planners with master data maintenance roles in SAP IBP, this new app enables them to view, create, copy, edit or delete single entries of master data maintained for specific master data types. Mass maintenance is only supported for deleting master data. Up until now, the more “complex” master data types such as external, reference and virtual master data could only be visualised in the app, and hence not changed, deleted or edited in the new app.
The key features of the app include:
One necessary step for the application to work is to add the business catalogue to the business roles that should have access to the new app.
Web-based master data maintenance is similar to the creation of attributes in the Attributes Model Configuration app. You can search for master data in all the planning areas you have access to, and in the list report view, you can now edit or delete your master data. The new options are available at the top of the result list as action buttons.
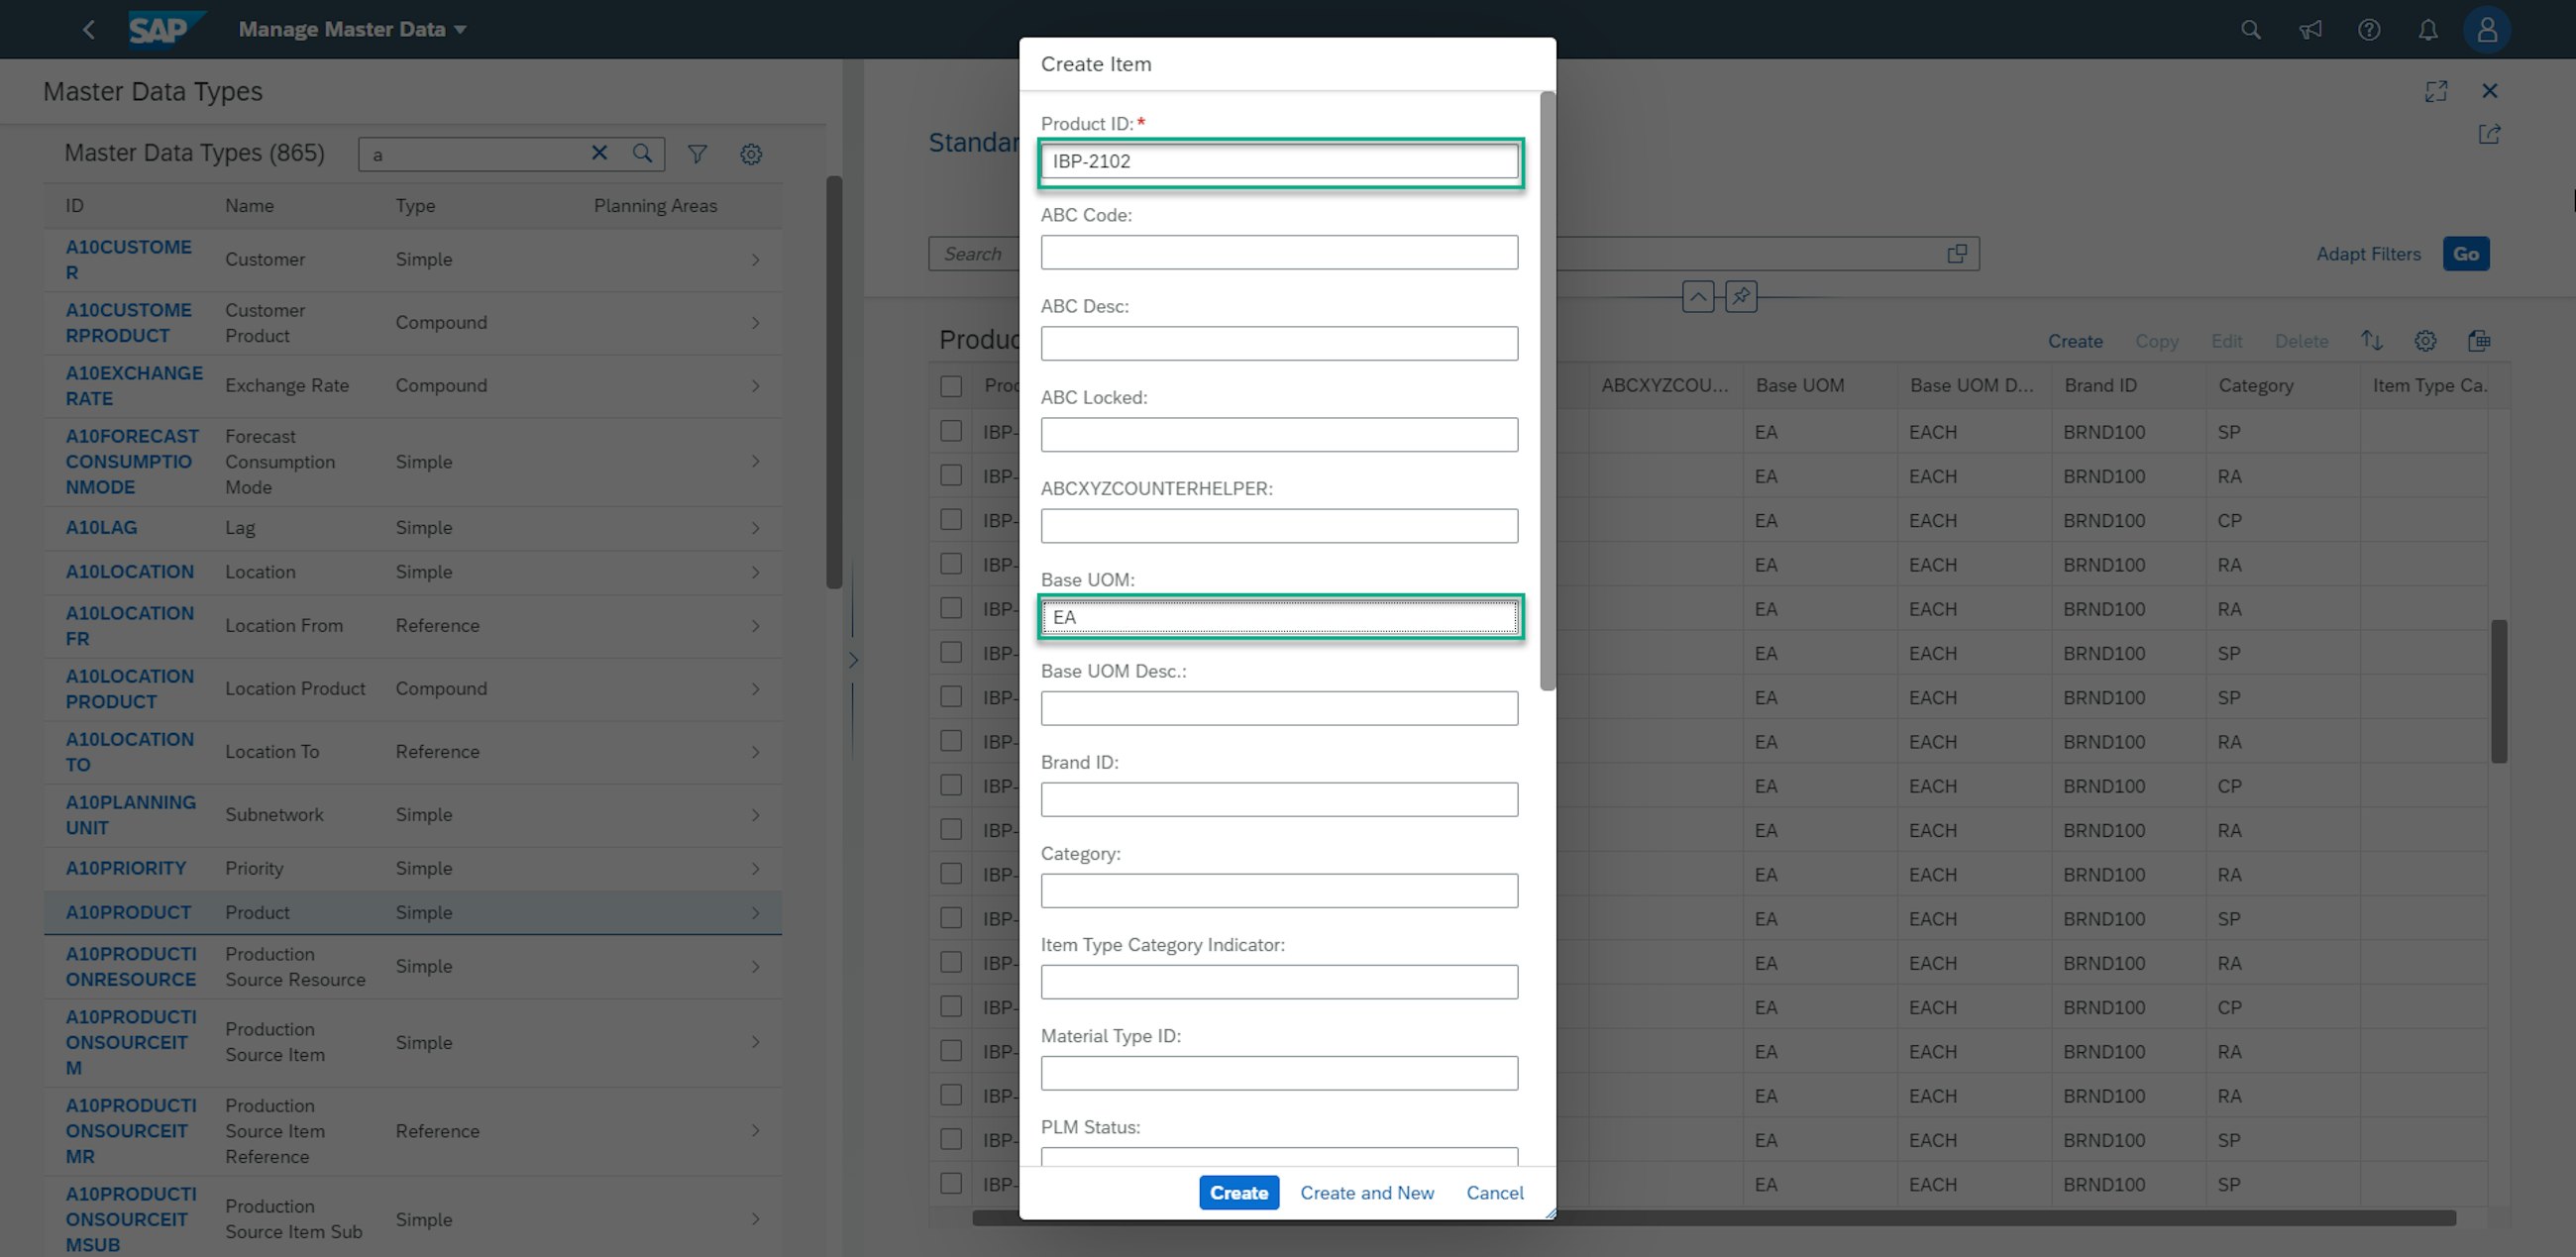
You can create or copy one entry at a time where you then need to define the key and mandatory attributes for new entries. Value help is available for attributes that are subject to validation checks, e.g. the keys of a compound master data type or attributes defined with attribute checks.
You can mark several entries and select the delete option to perform a mass delete action. The table gives users a quick and easy overview of master data entries to be deleted. Also, better ways of collaborating and sharing are added in this release. The sharing feature has been added to the list report view. It enables you to send a direct link to your customised list report view in an email or save it as a new tile on the SAP Fiori launchpad.
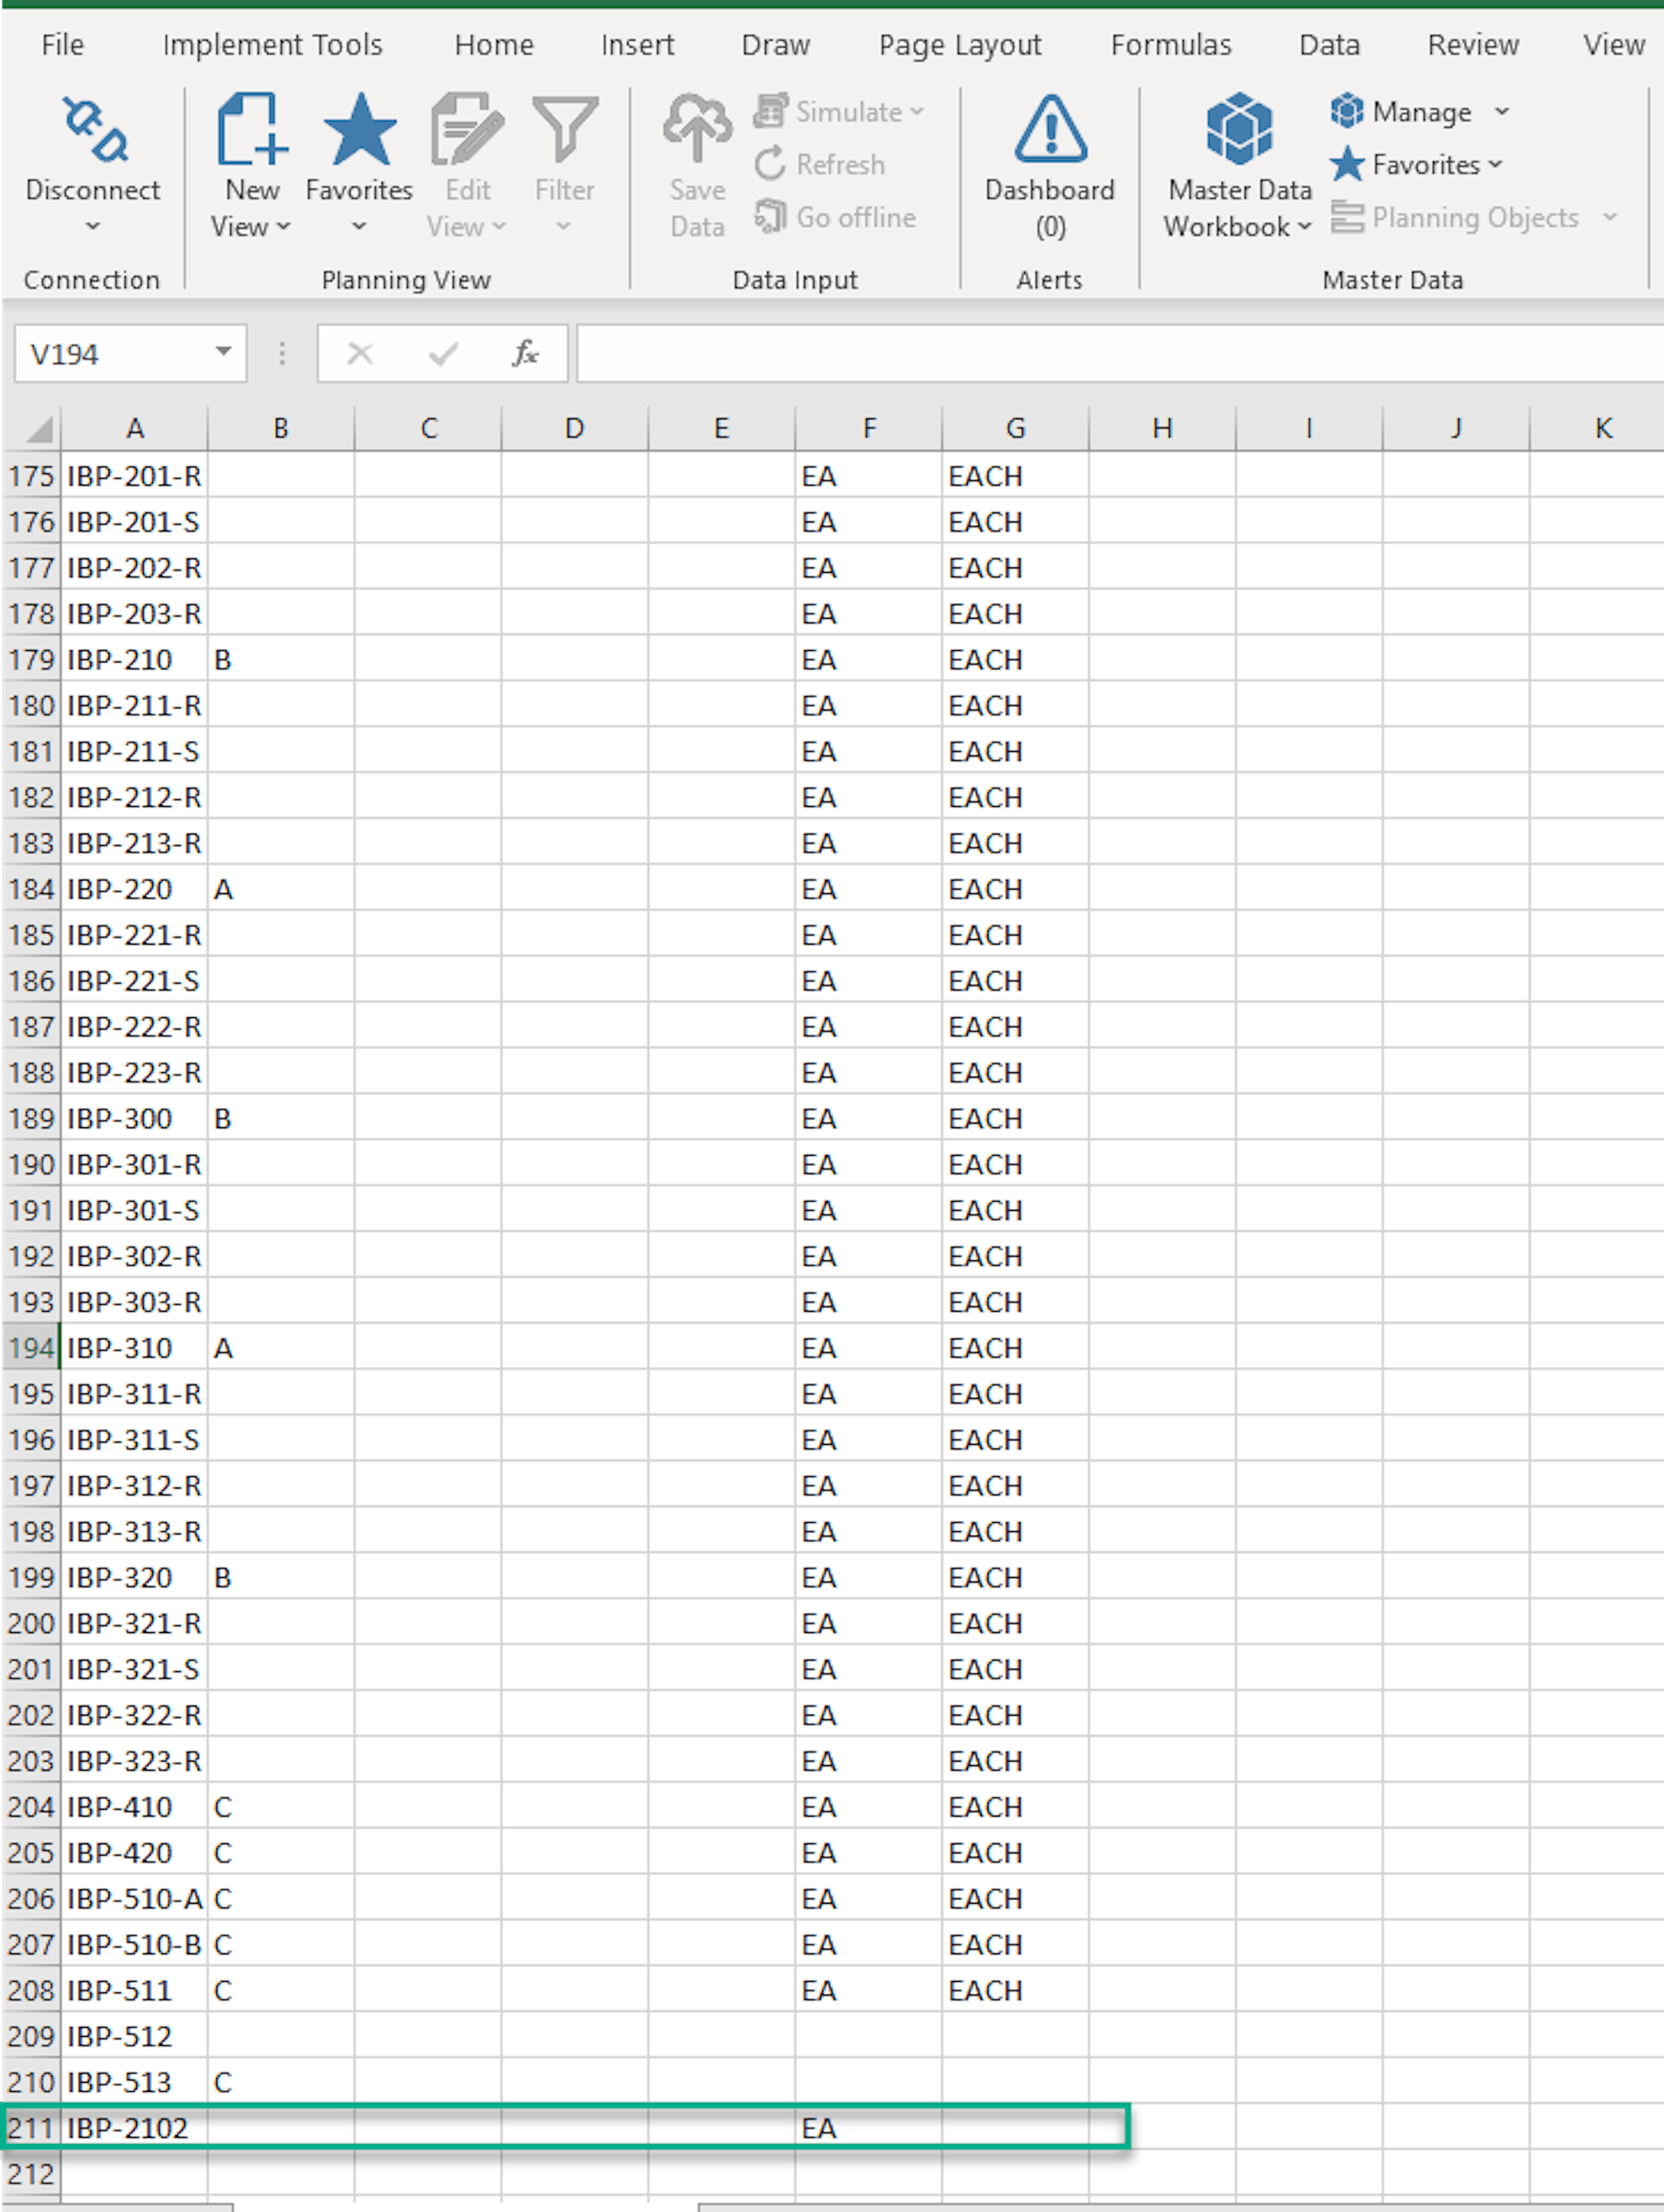
The Export to spreadsheet feature has been added to the master data result list. It exports all master data entries that fulfil your current filter criteria, provided that the number of entries does not exceed 100,000. With the Export to spreadsheet feature, you can easily compare the added master data from the app with the master data entries in SAP IBP Excel UI.
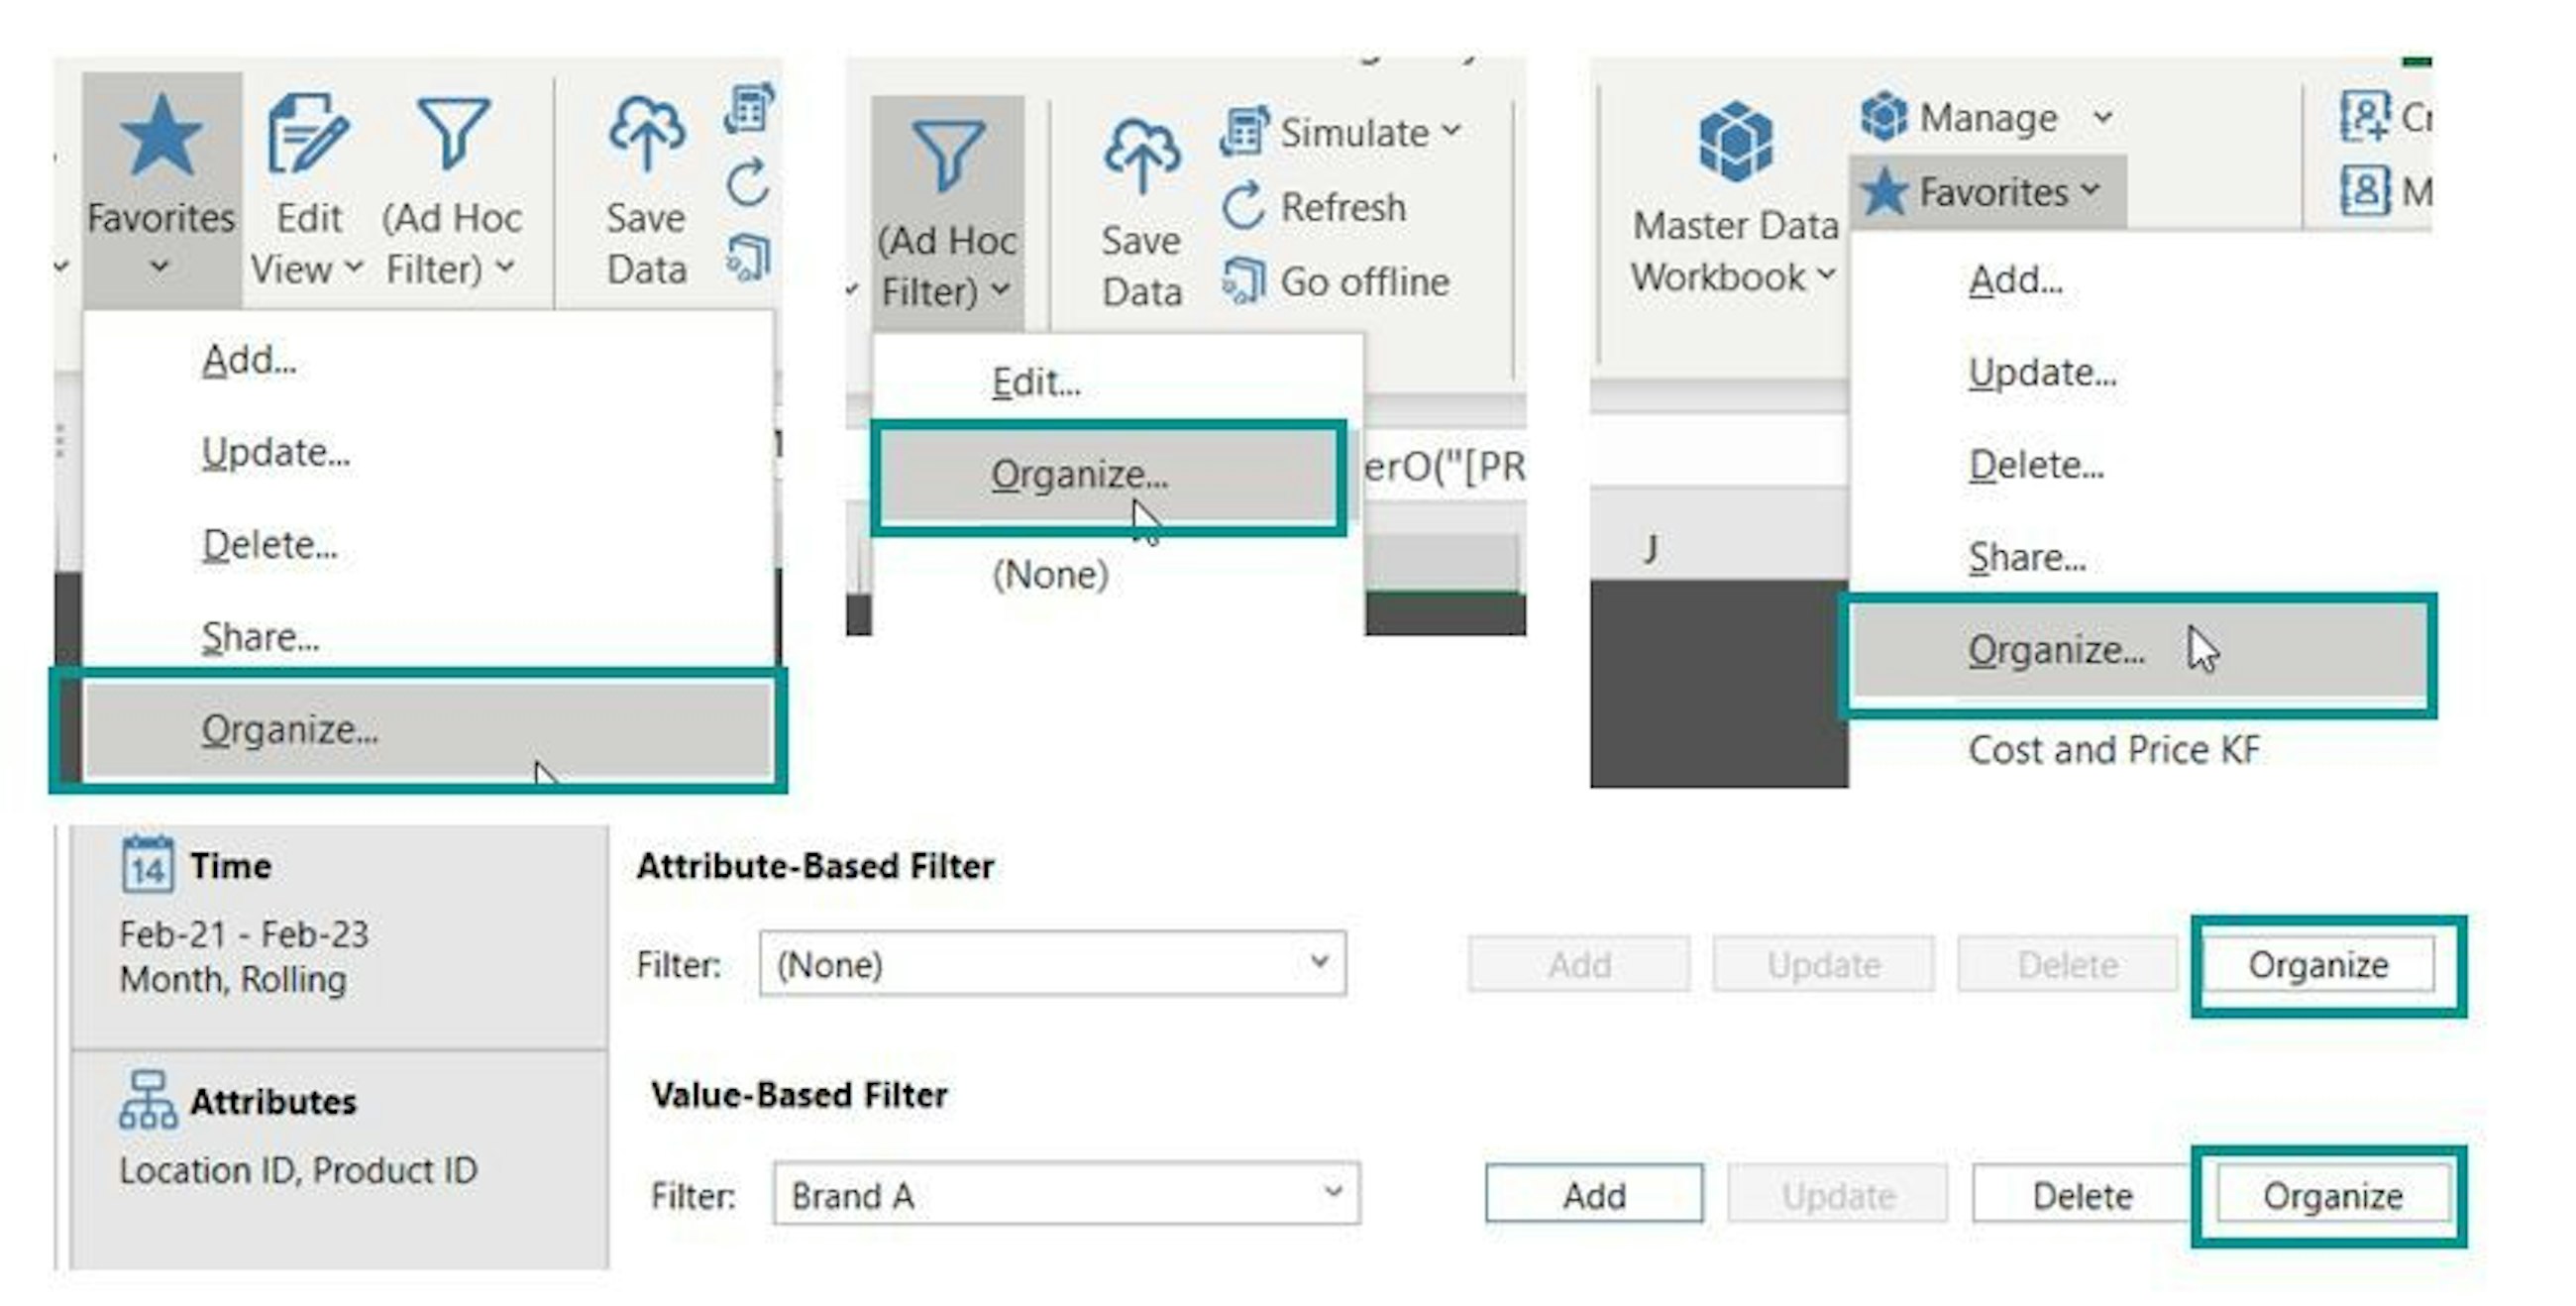
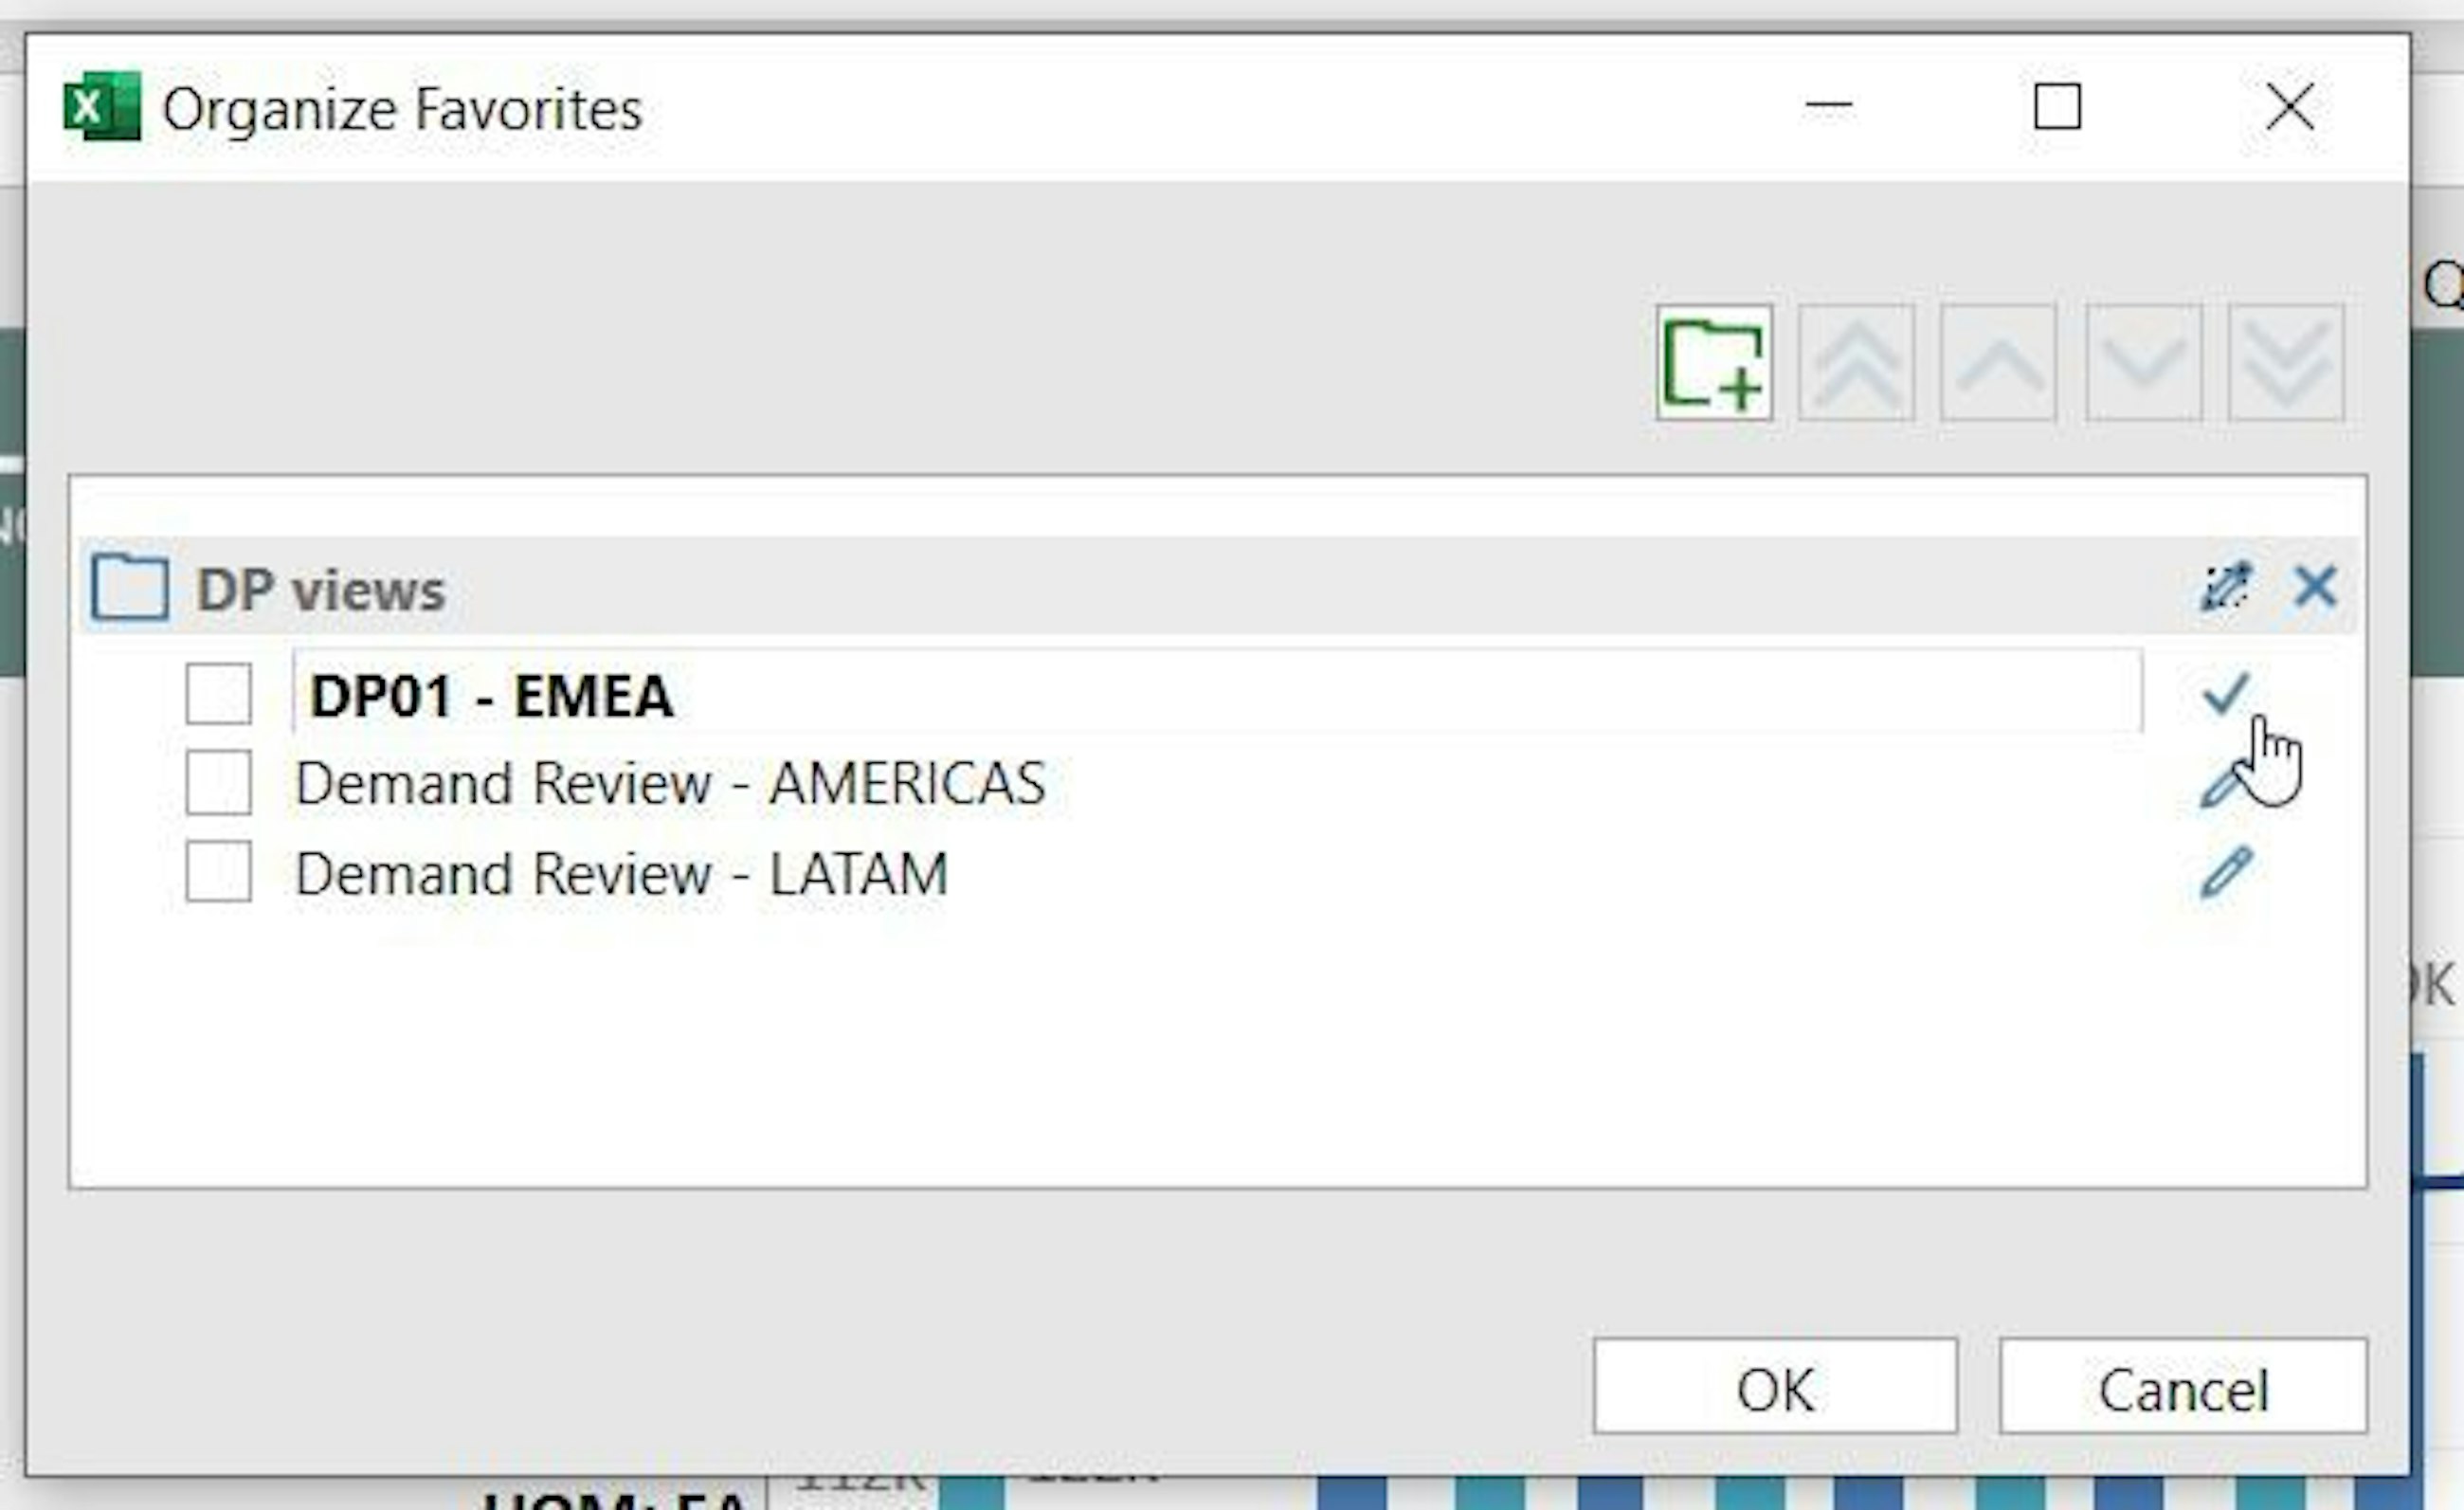
Usually, any user would take for granted that they can rename files and folders. However, this functionality was actually not available in the IBP Excel add-in until now. In fact, if users wanted to rename e.g. a Favorite Planning view, they would first need to save a new Favorite, then change its name and finally delete the old one. Needless to say, this was not the best solution.
With the most recent version of the IBP Excel add-in, you can now rename all of the following: Planning views templates, Favorites, Filters (both attribute- and filter-based), Master data workbook favorites and any folder. You can do this via the Organize buttons, which you access via the IBP Excel ribbon or via the Edit View screen when it comes to value-based attributes.
Up until this release, here is where you could create folders and rearrange existing elements by moving them in and out of folders. With the latest add-in, you will notice that a new pencil icon is visible. This allows users to rename the selected objects.
Would you like to try out this functionality? Then remember to install the new 2102.2.0 version of the SAP IBP add-in for Microsoft Excel. Please also note that the minimum allowed .NET version has been increased so it is necessary to upgrade the .NET version to 4.8 or higher in order to install the latest version of the Excel add-in.