Article
Five selected features of the 2011 upgrade of SAP IBP

Article
Read more
25 November 2020
IBP is definitely a very user-friendly solution with the all-familiar Microsoft Excel as the main front end. However, having an Excel-based interface does not necessarily mean that all Excel functionalities are automatically available. In fact, until now, we have been missing one “classic” Excel feature in IBP: the possibility to sort data in an easy way.
Being able to filter and sort data depending on desired criteria is probably one of the most used Excel functionalities. And even though filters have long been part of the IBP front-end features, up until now IBP users have had to “survive” without the possibility to sort their data in a straightforward way.
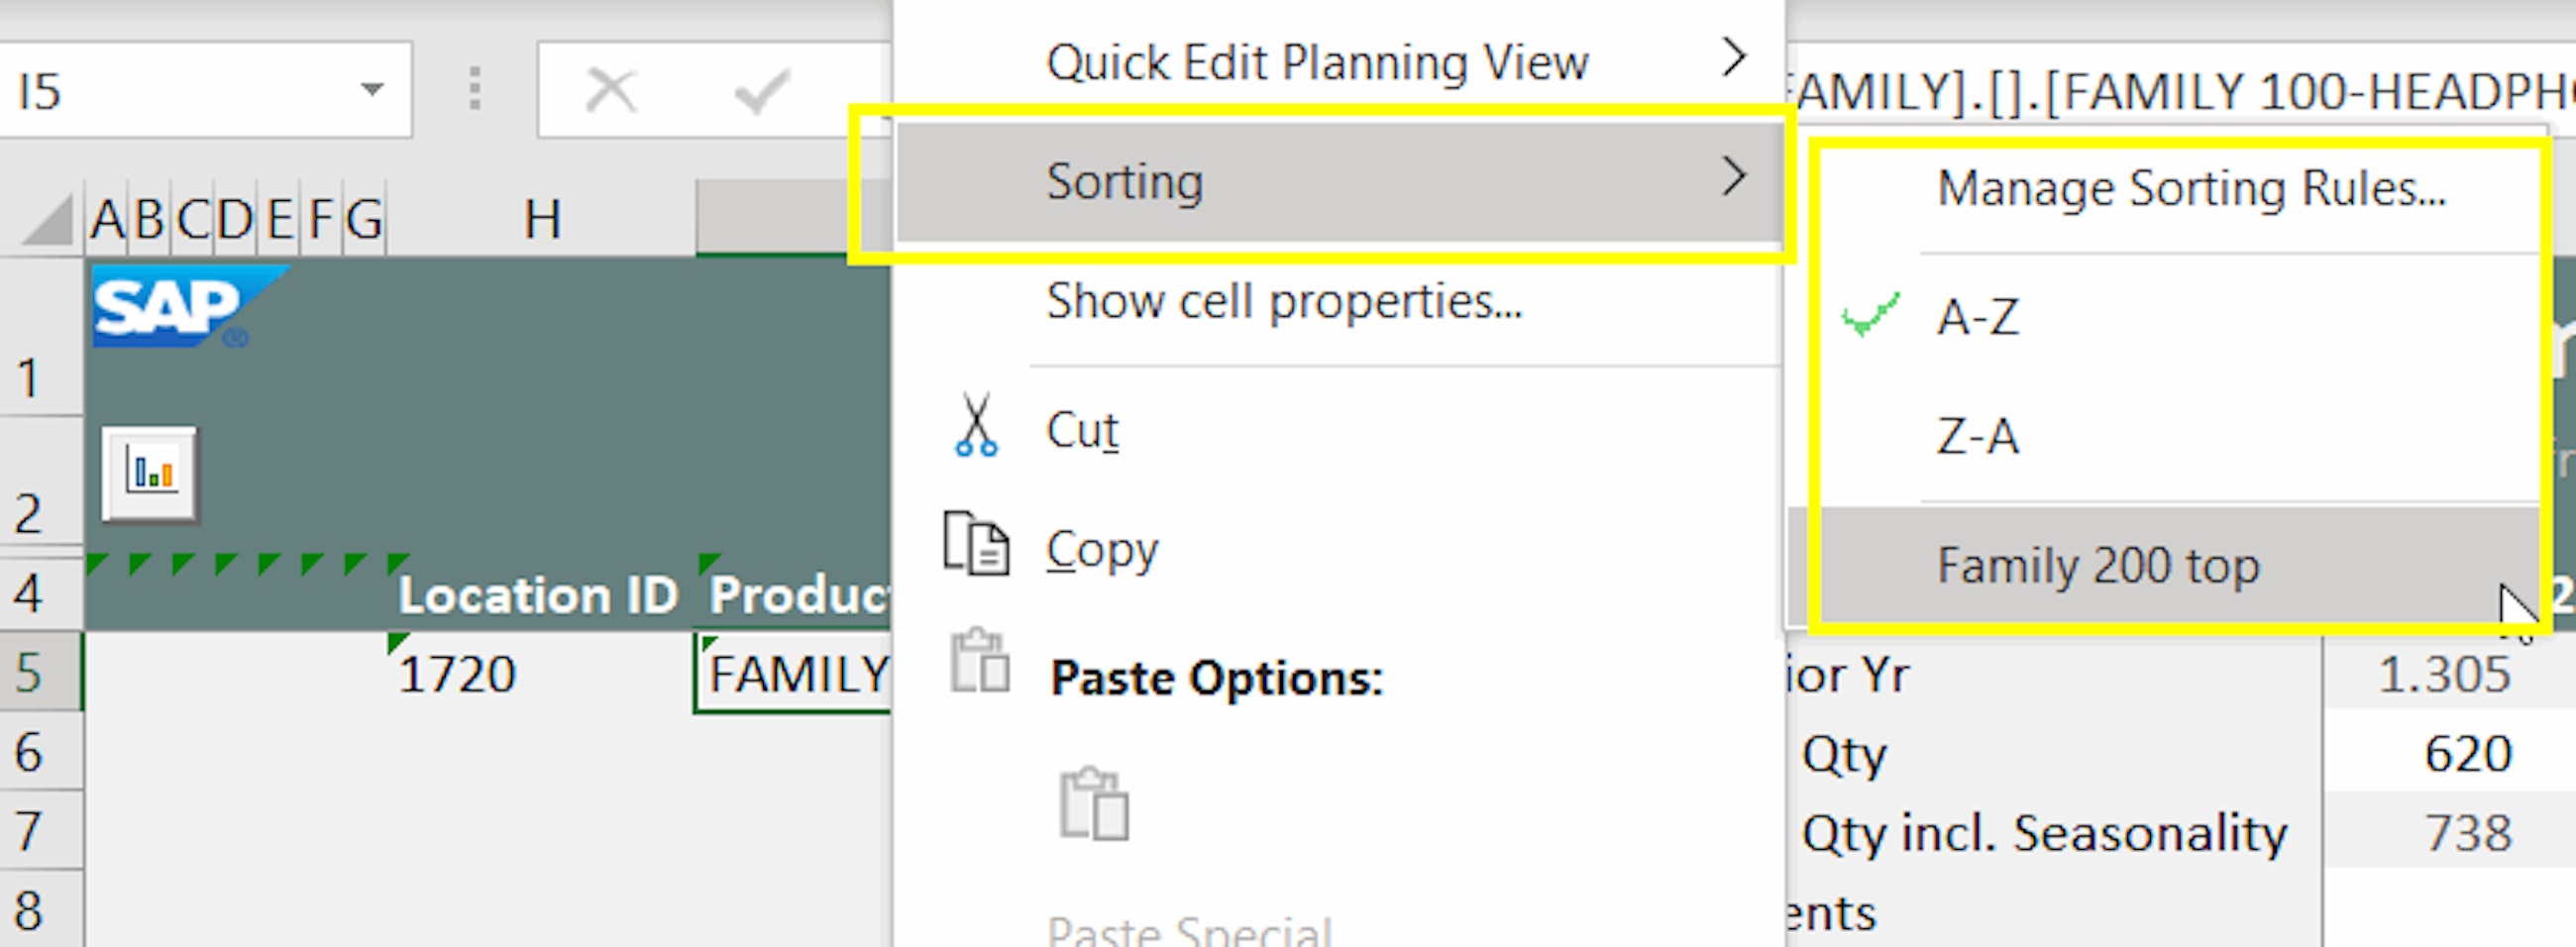
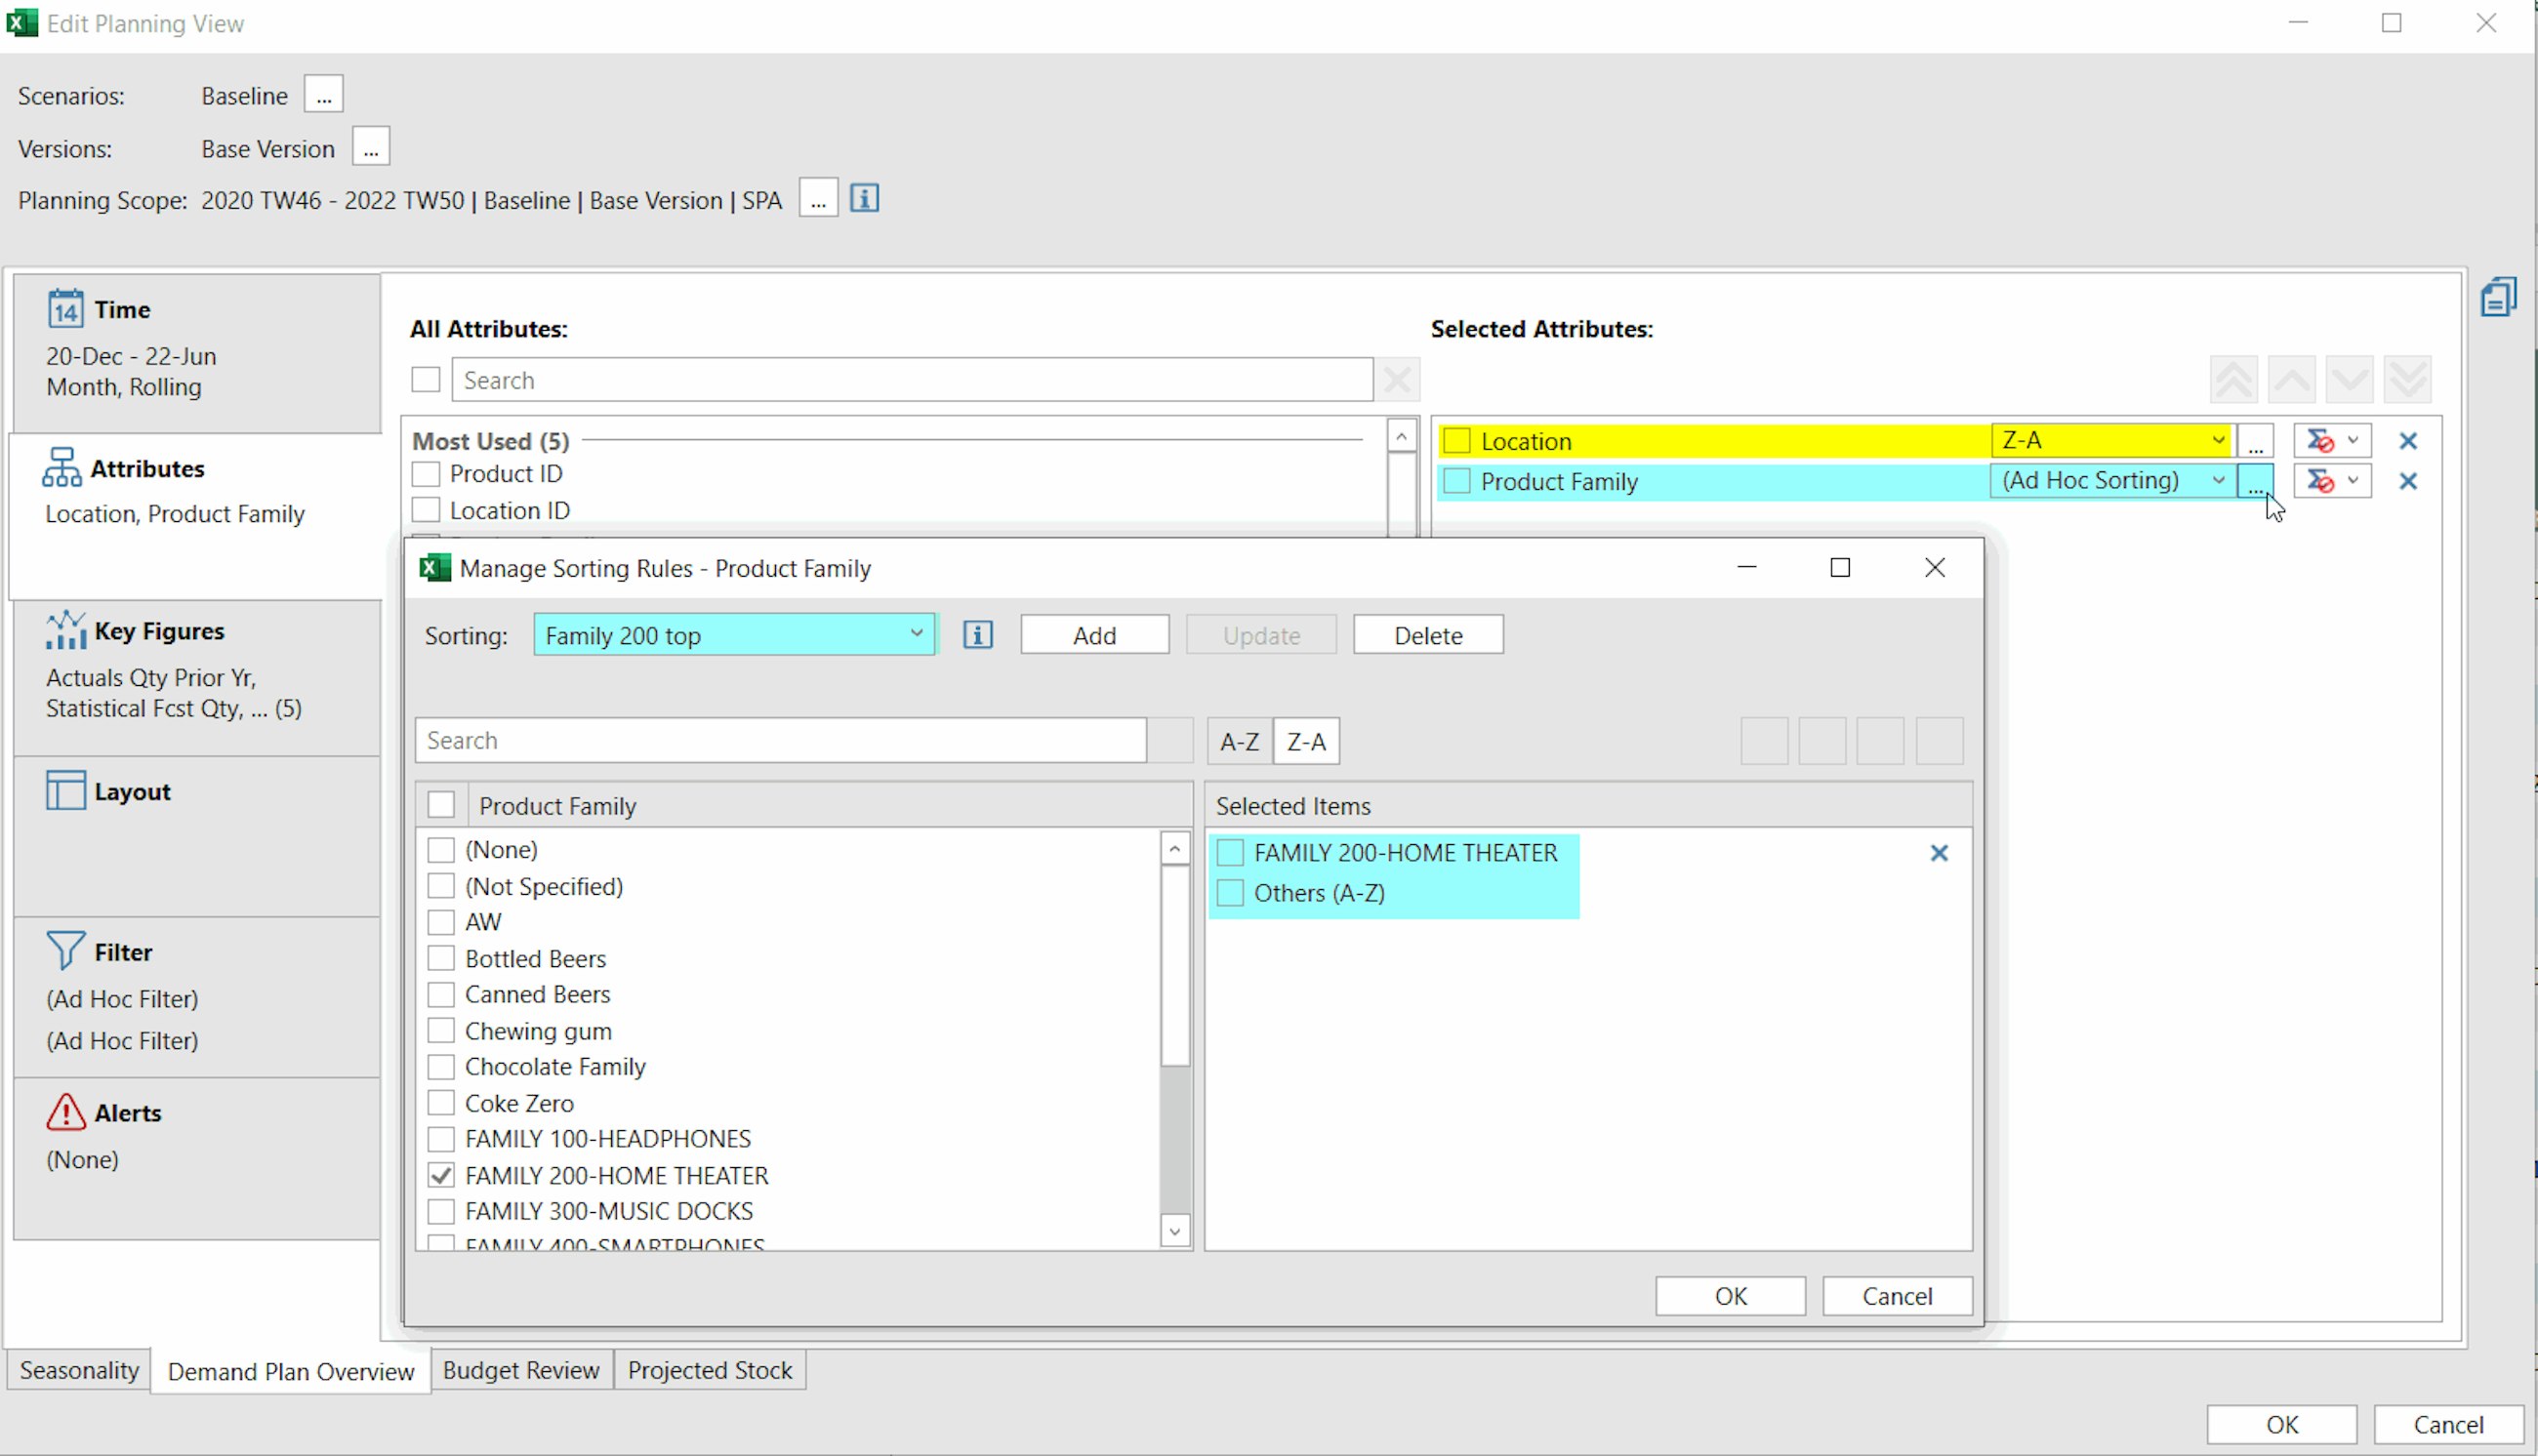
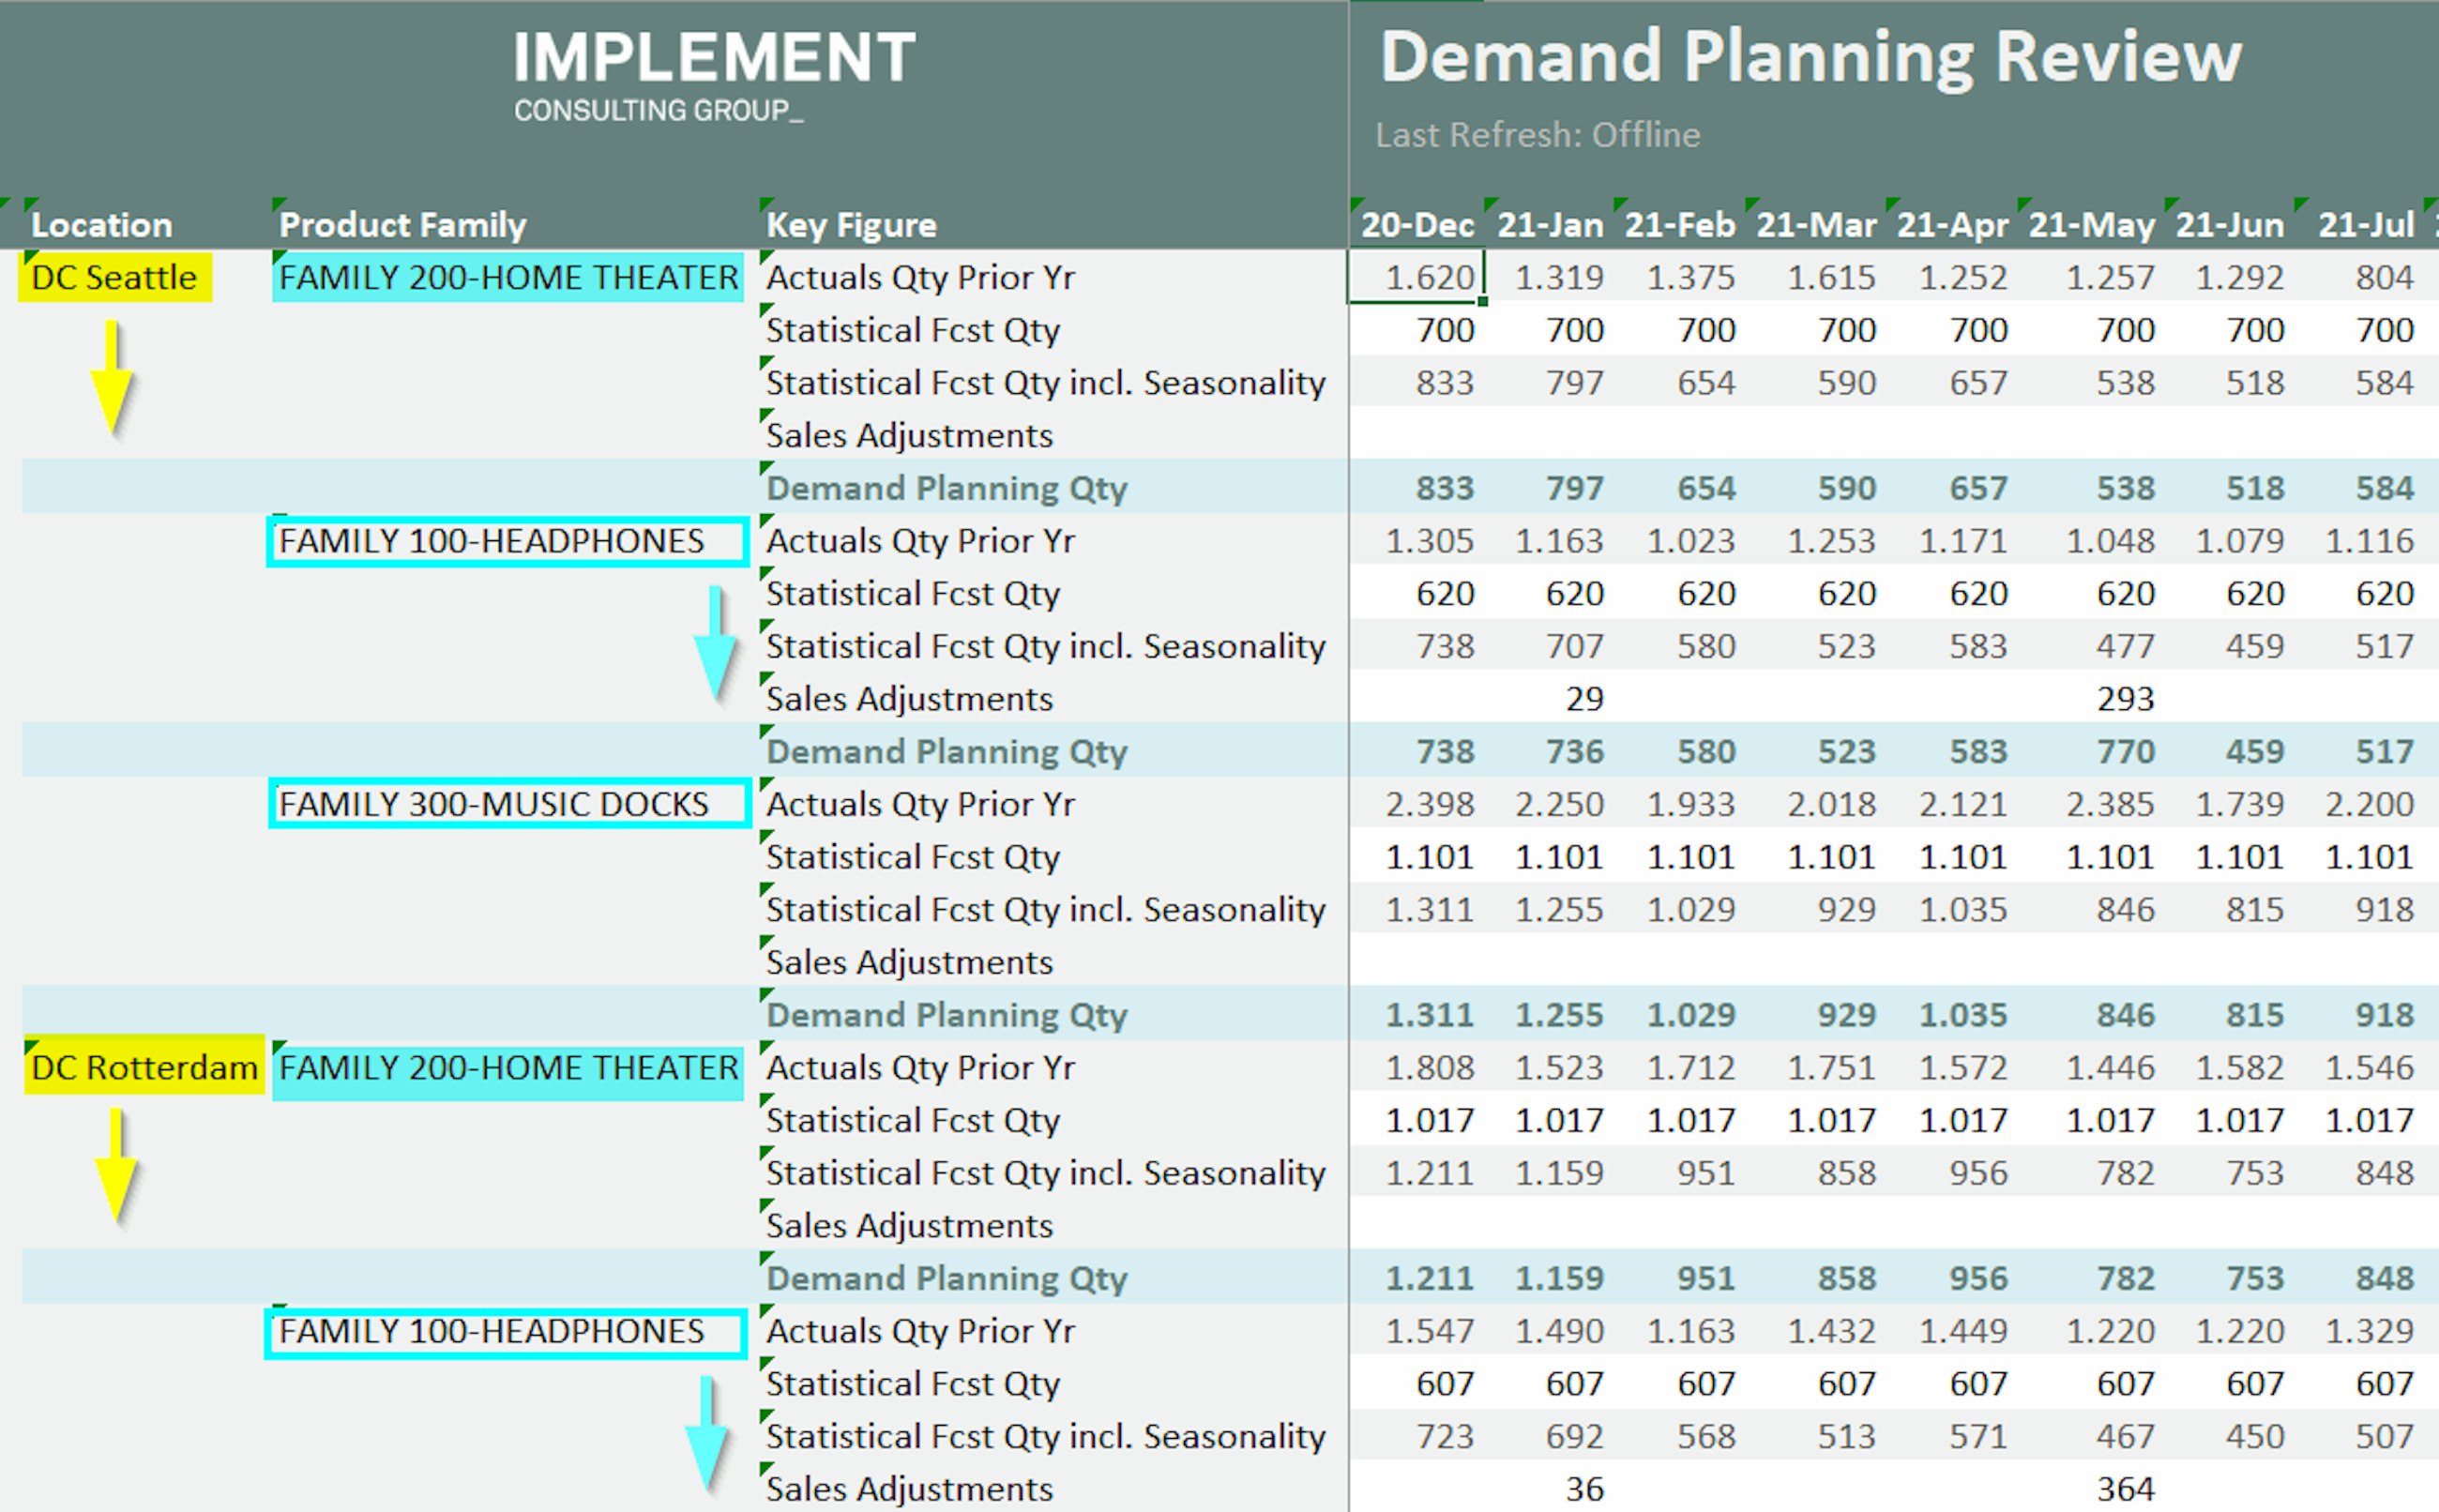
Luckily, with the 2011 upgrade, SAP has now incorporated sorting capabilities into the planning view settings. Here is how they work:
Although the new sorting capabilities are still limited, they can improve the structure and clarity of the planning views, thereby contributing to an increase in efficiency for planners. We have been waiting for this functionality for more than three years, when one of our good colleagues submitted a request for this feature in the SAP Customer Influence portal – so we are very excited to see it implemented in this quarterly release, and we hope you are too.
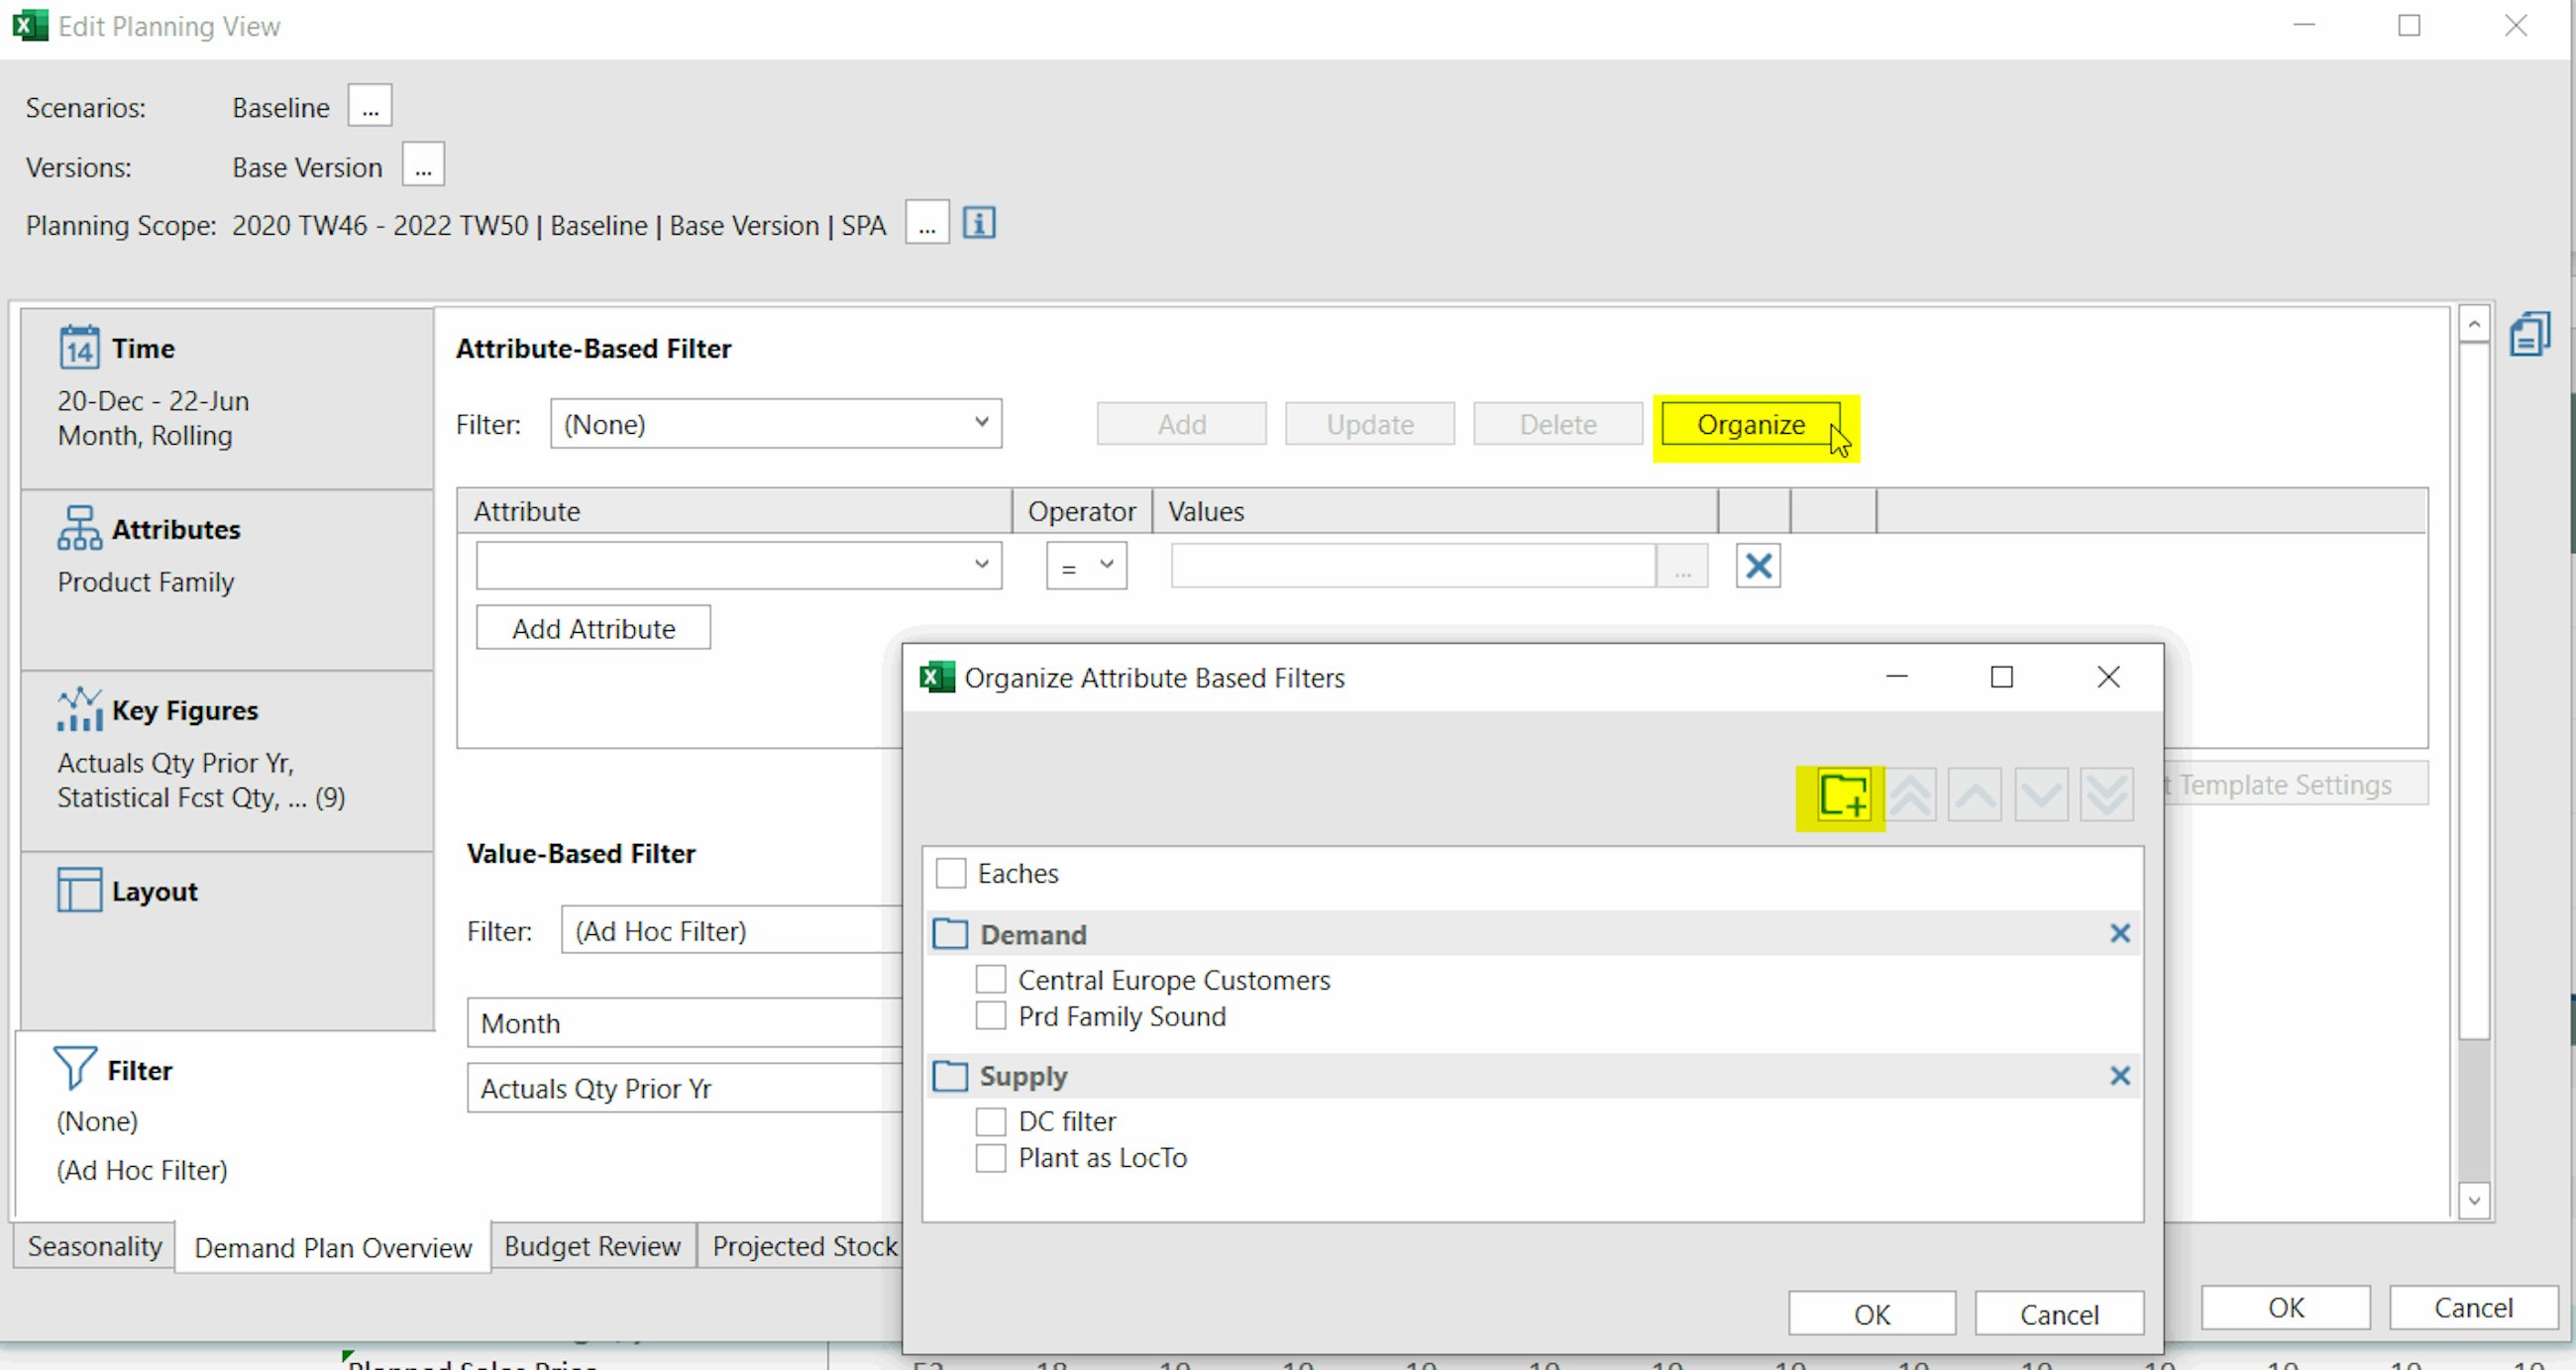
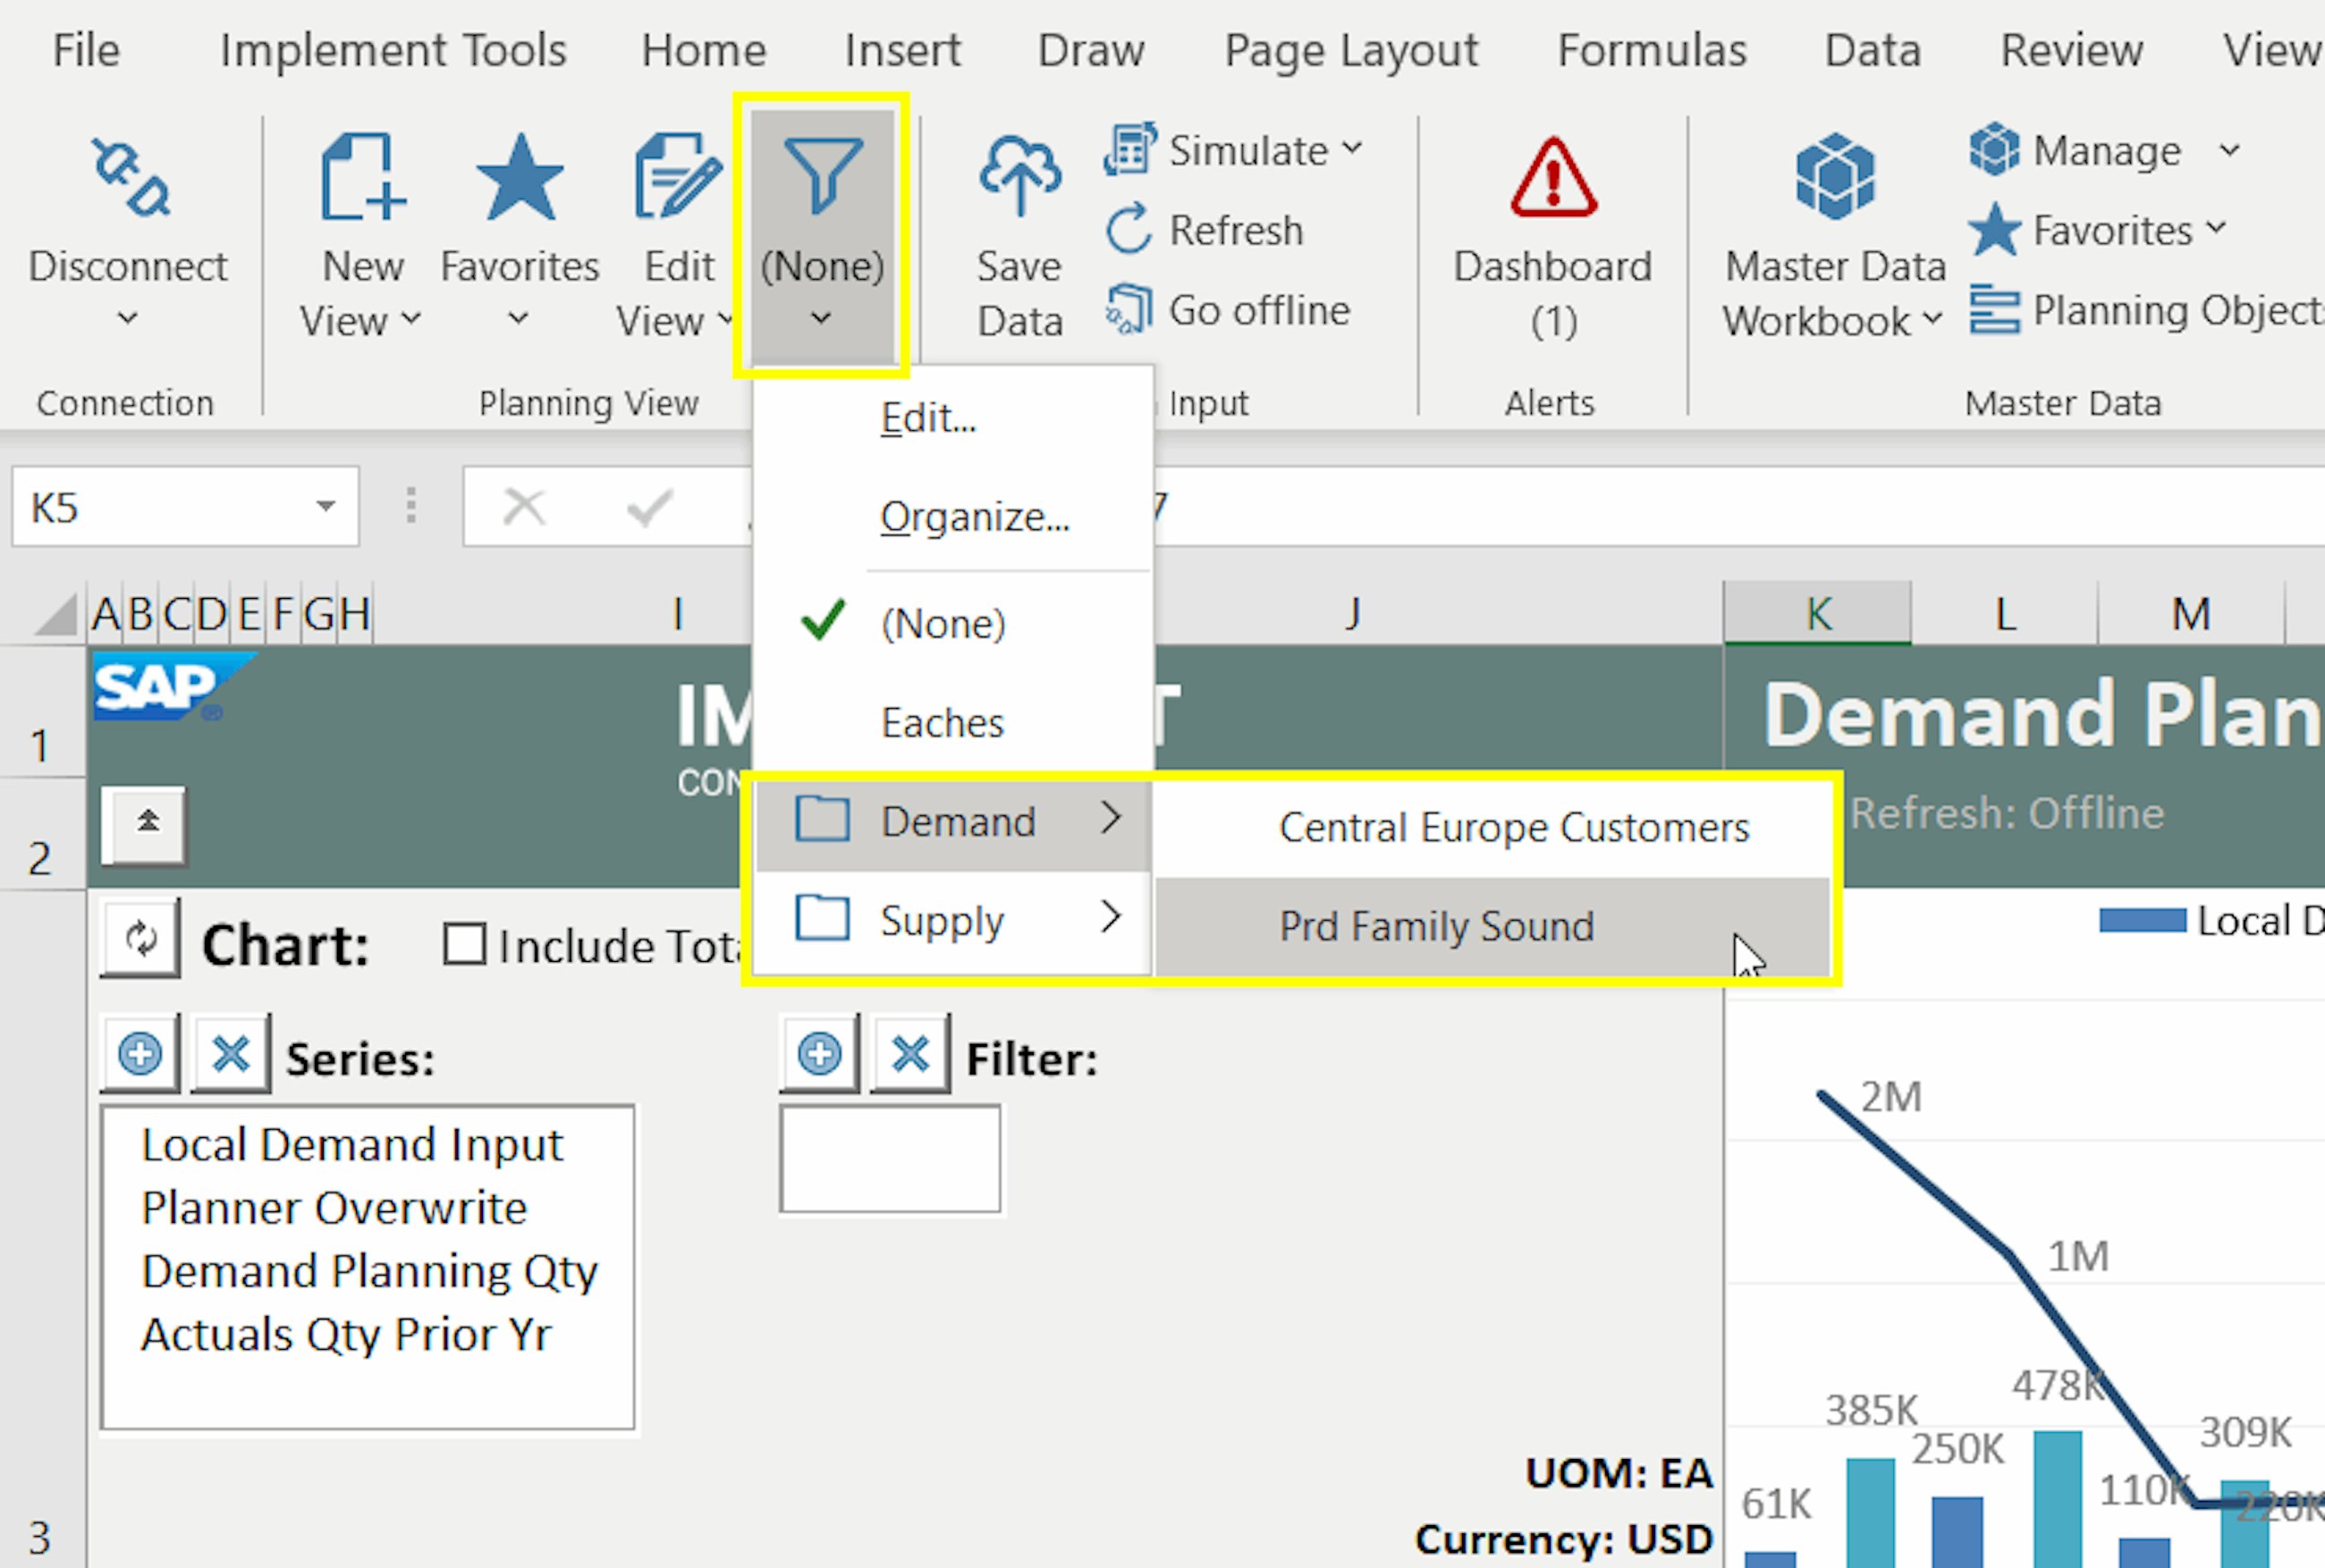
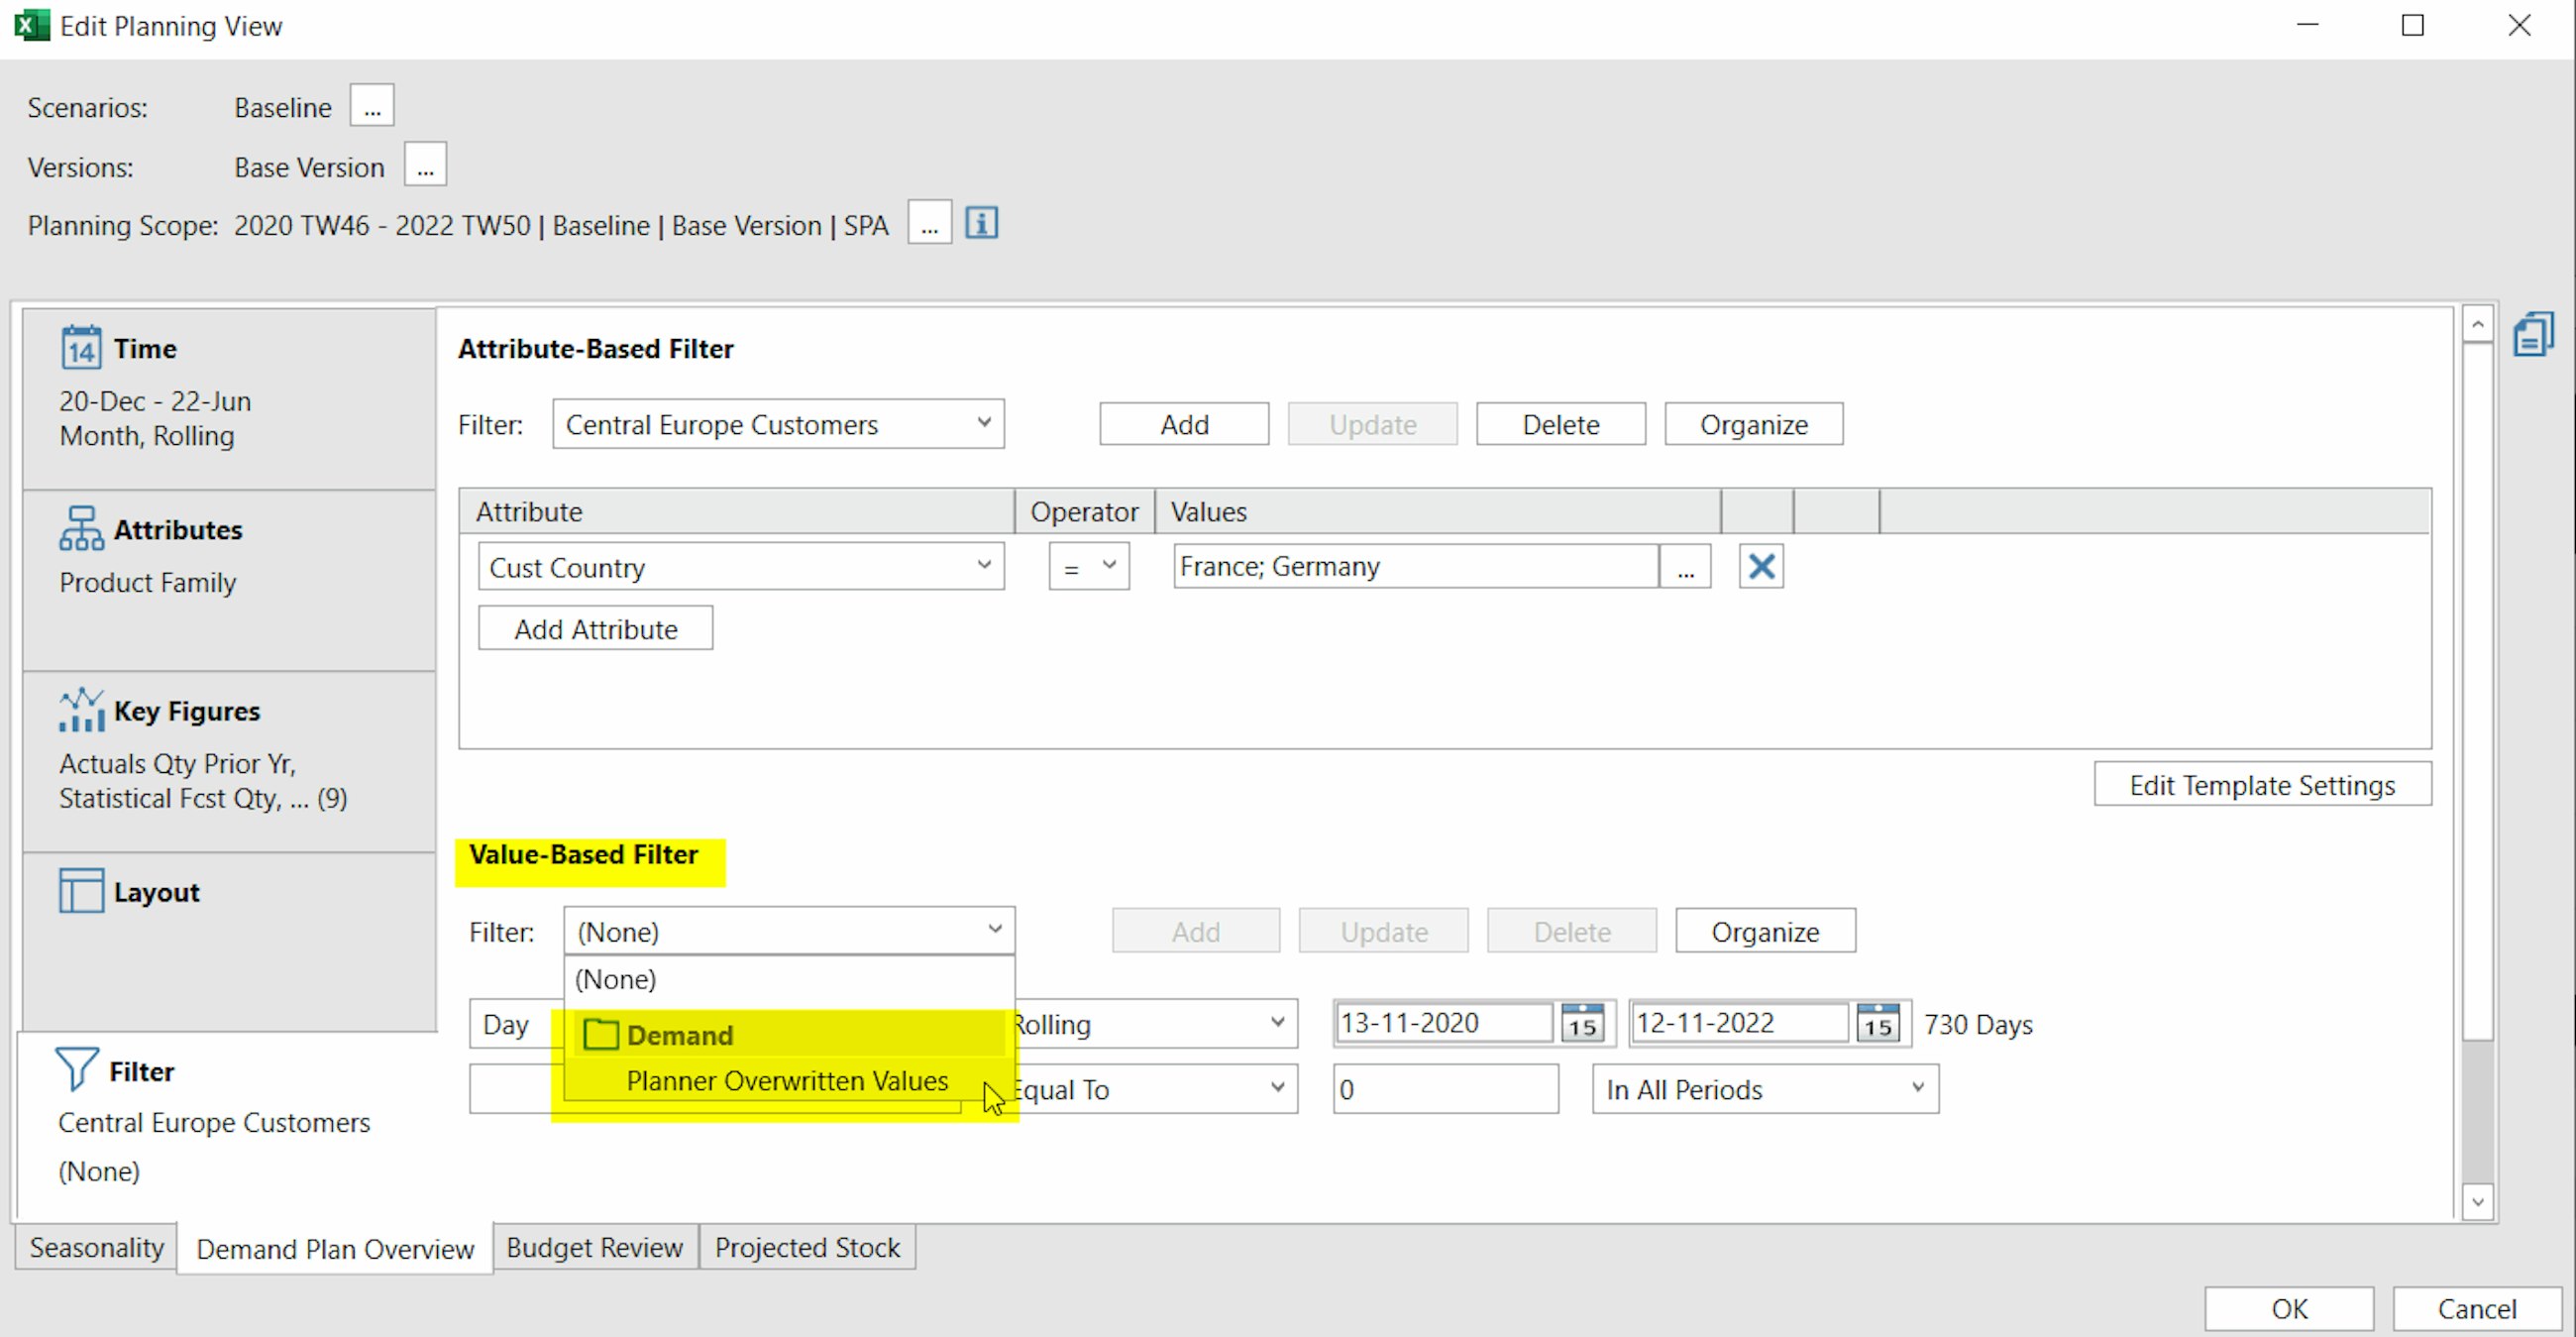
SAP added another useful functionality with this latest upgrade, and now you can create folders to organise your planning filters. Folders were already available for Templates and Favorites (both planning views and master data workbooks) as a way to help the users structuring their work in IBP, and they have now become available for both attribute filters and value-based ones. Whether you have a long list of filters that you want to sort out, or whether you just want to be more organised, you can now arrange your filters in folders, for instance, depending on the process they support, or the master data type they belong to (e.g. product, location etc.).
With the 2011 upgrade, SAP has delivered a series of improvements in the area of exceptions handling. This is thanks to the enhancements made to the Intelligent Visibility app and to an overall improved usability of alerts.
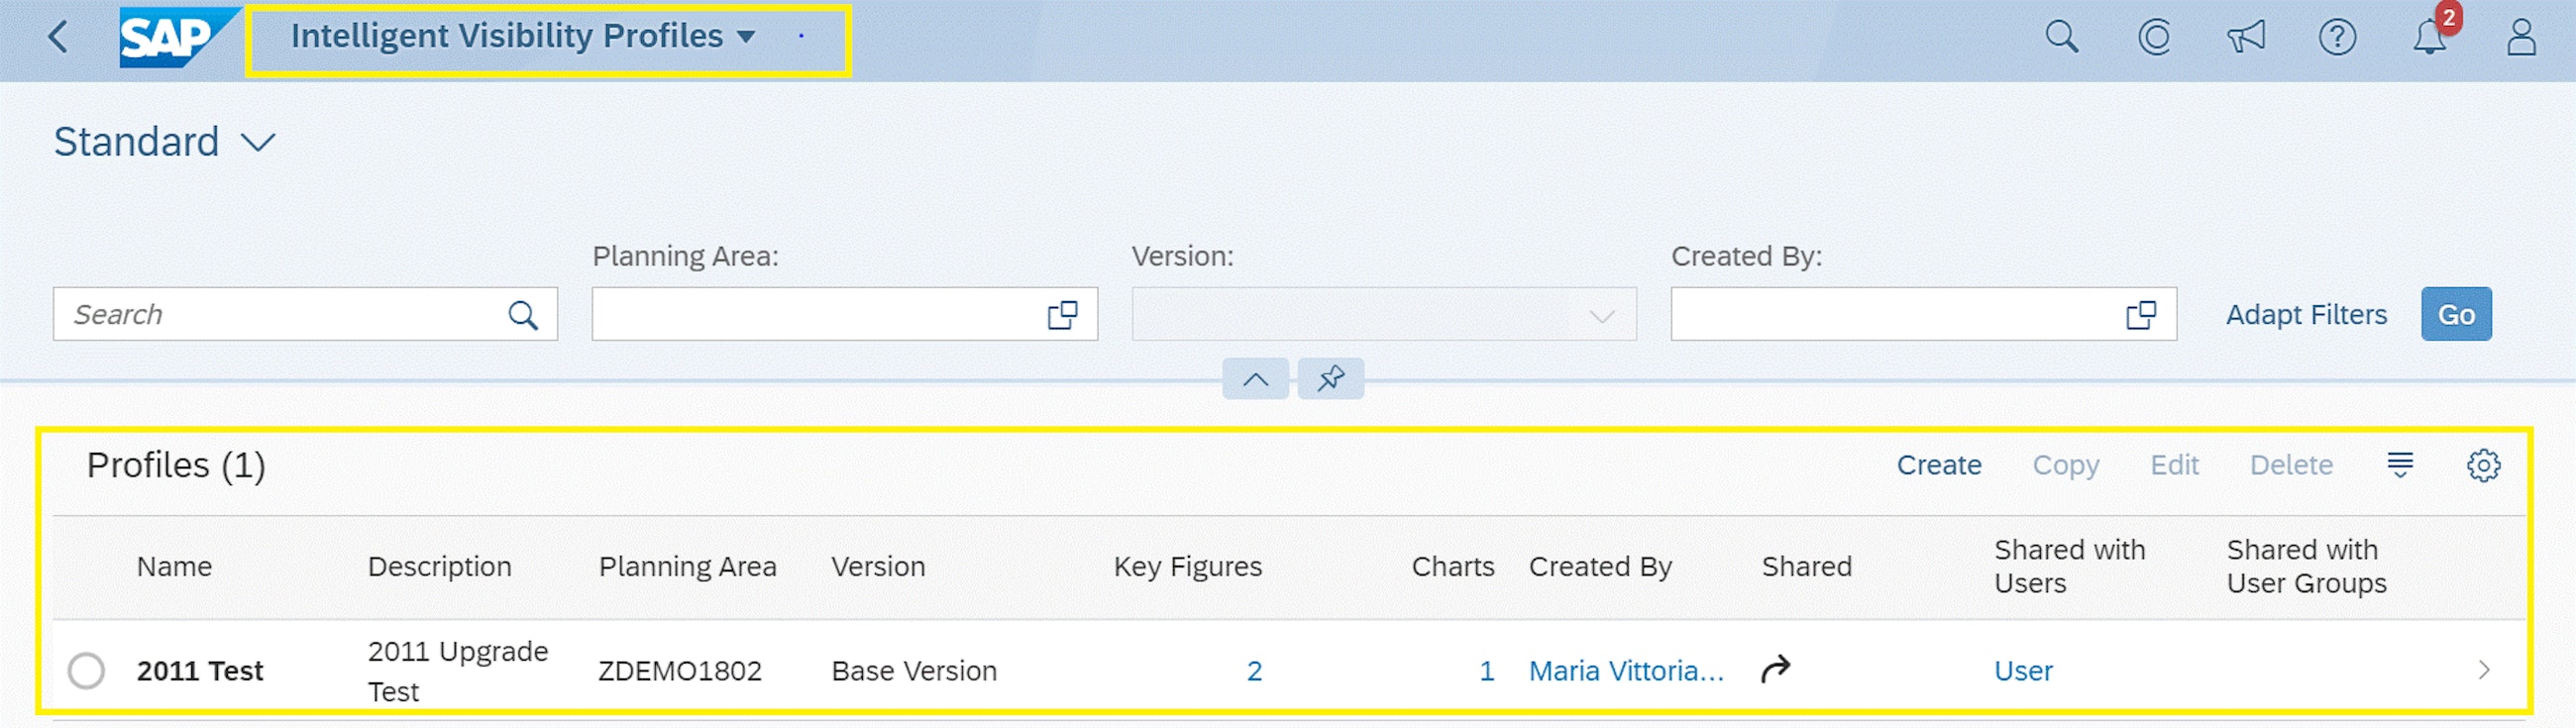
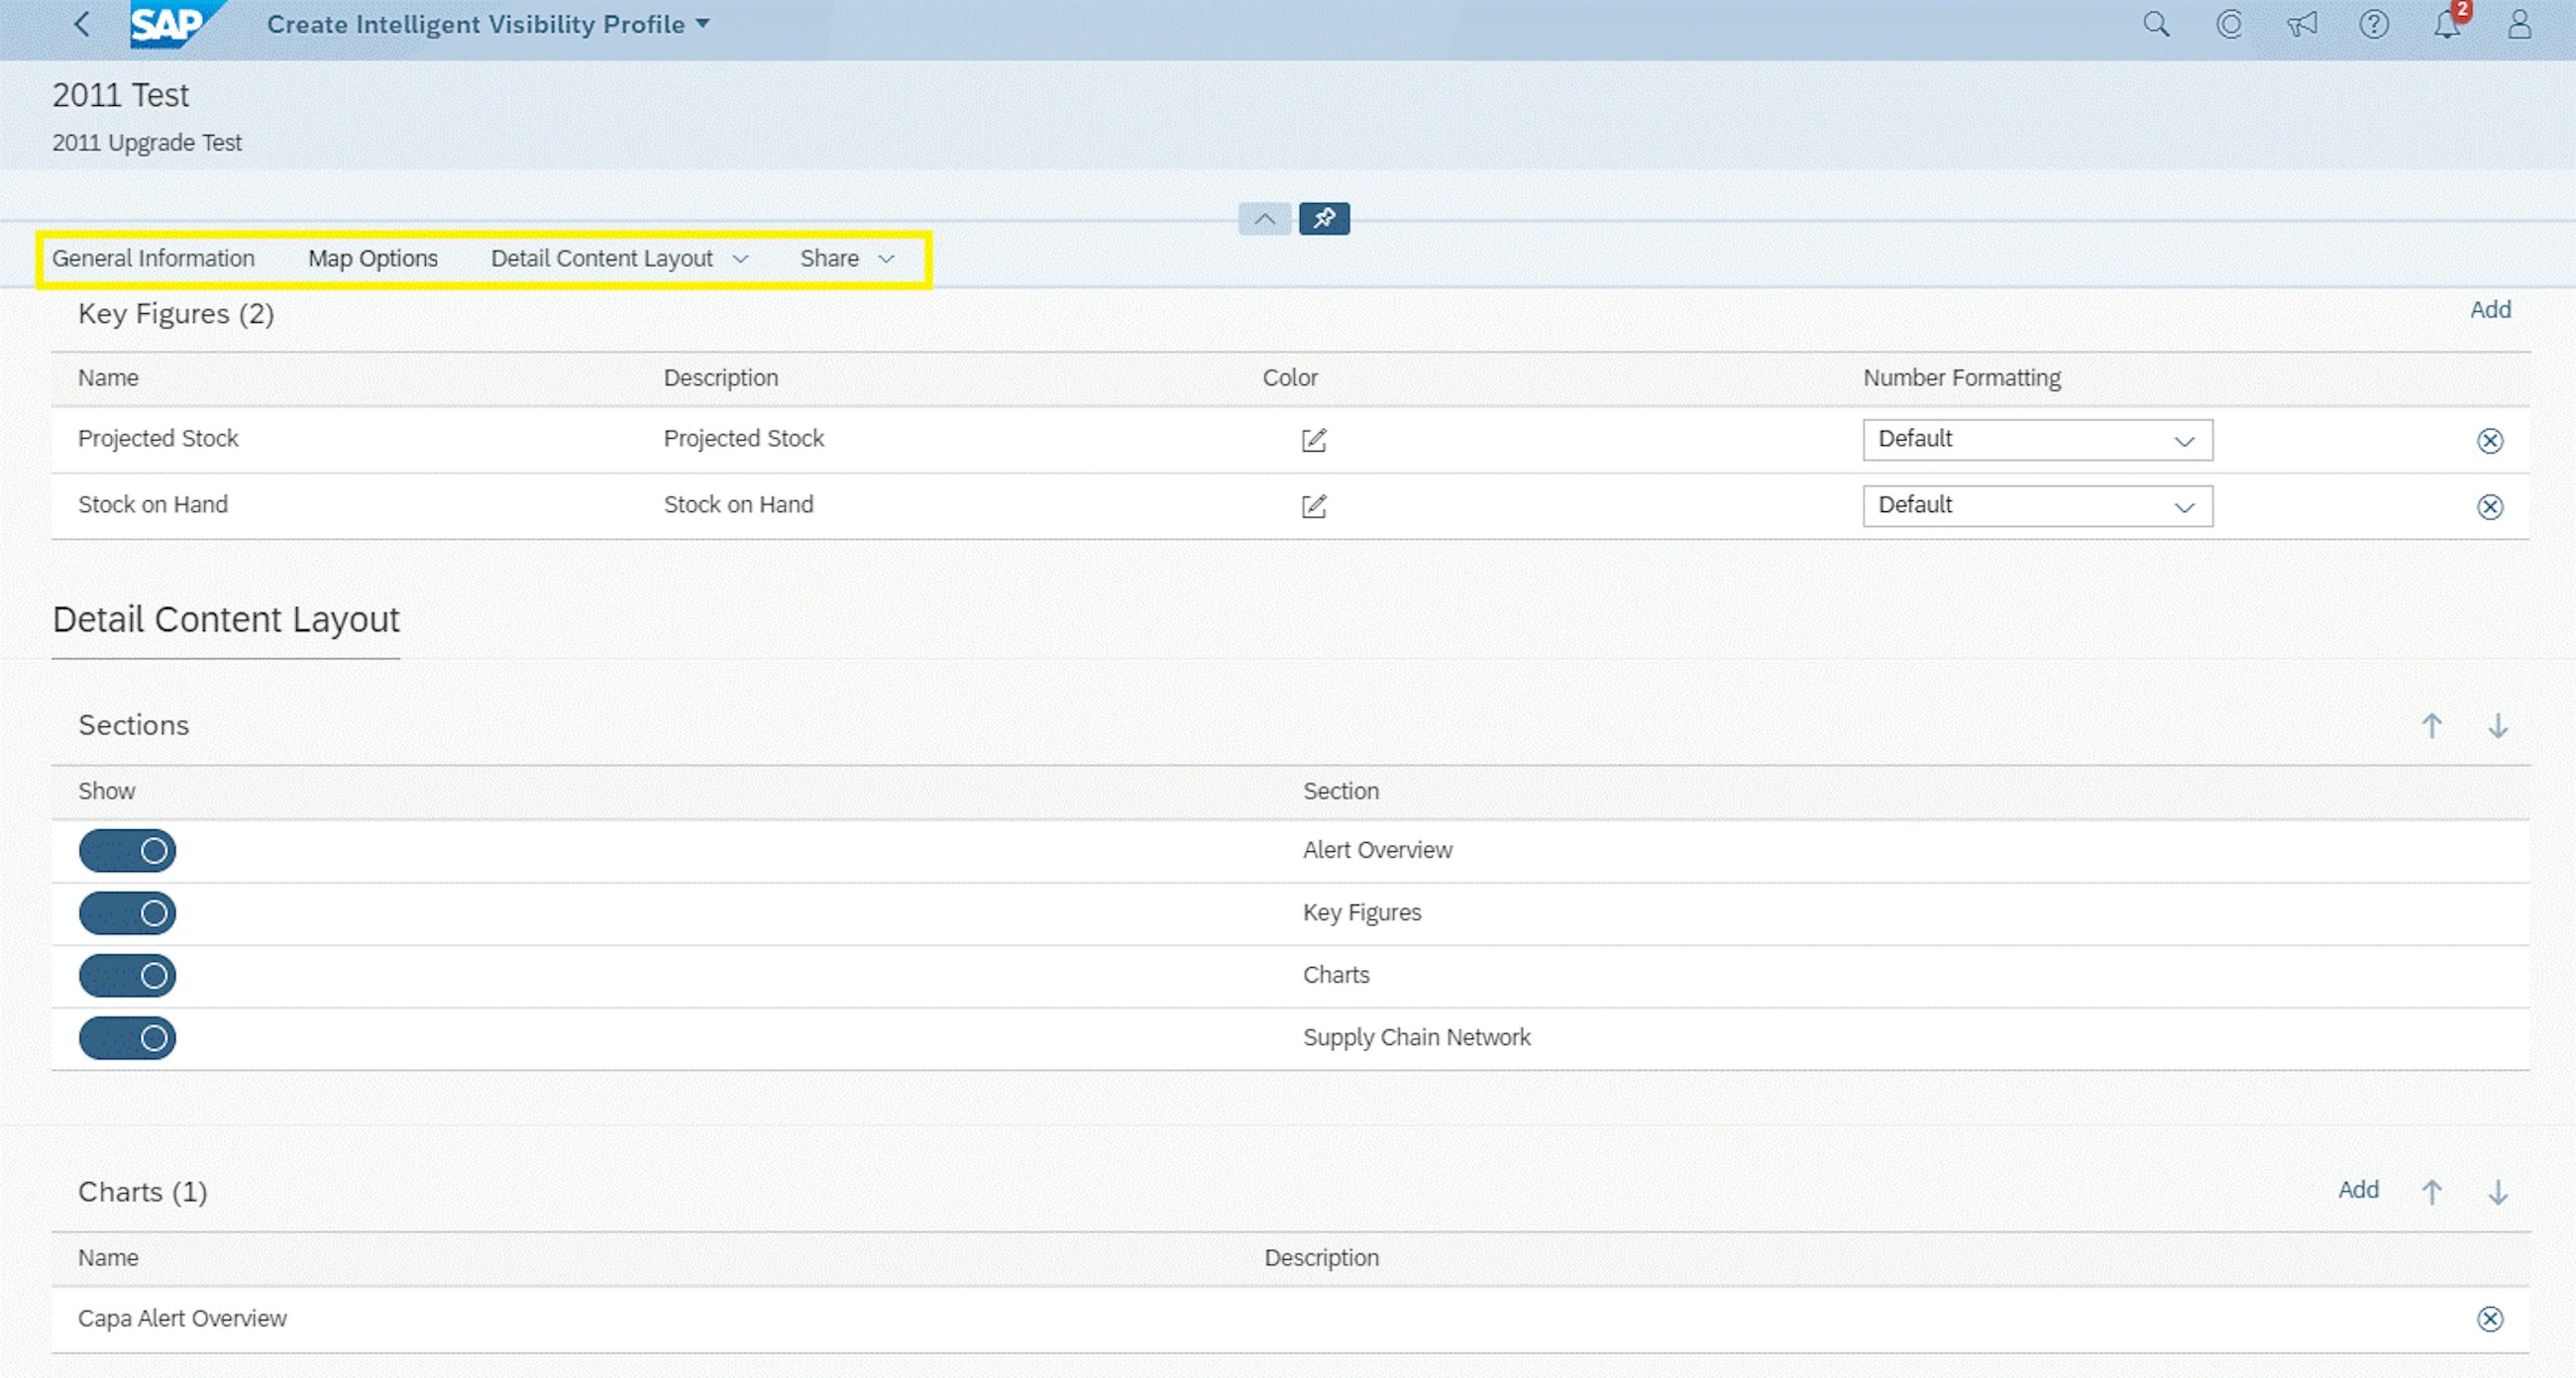
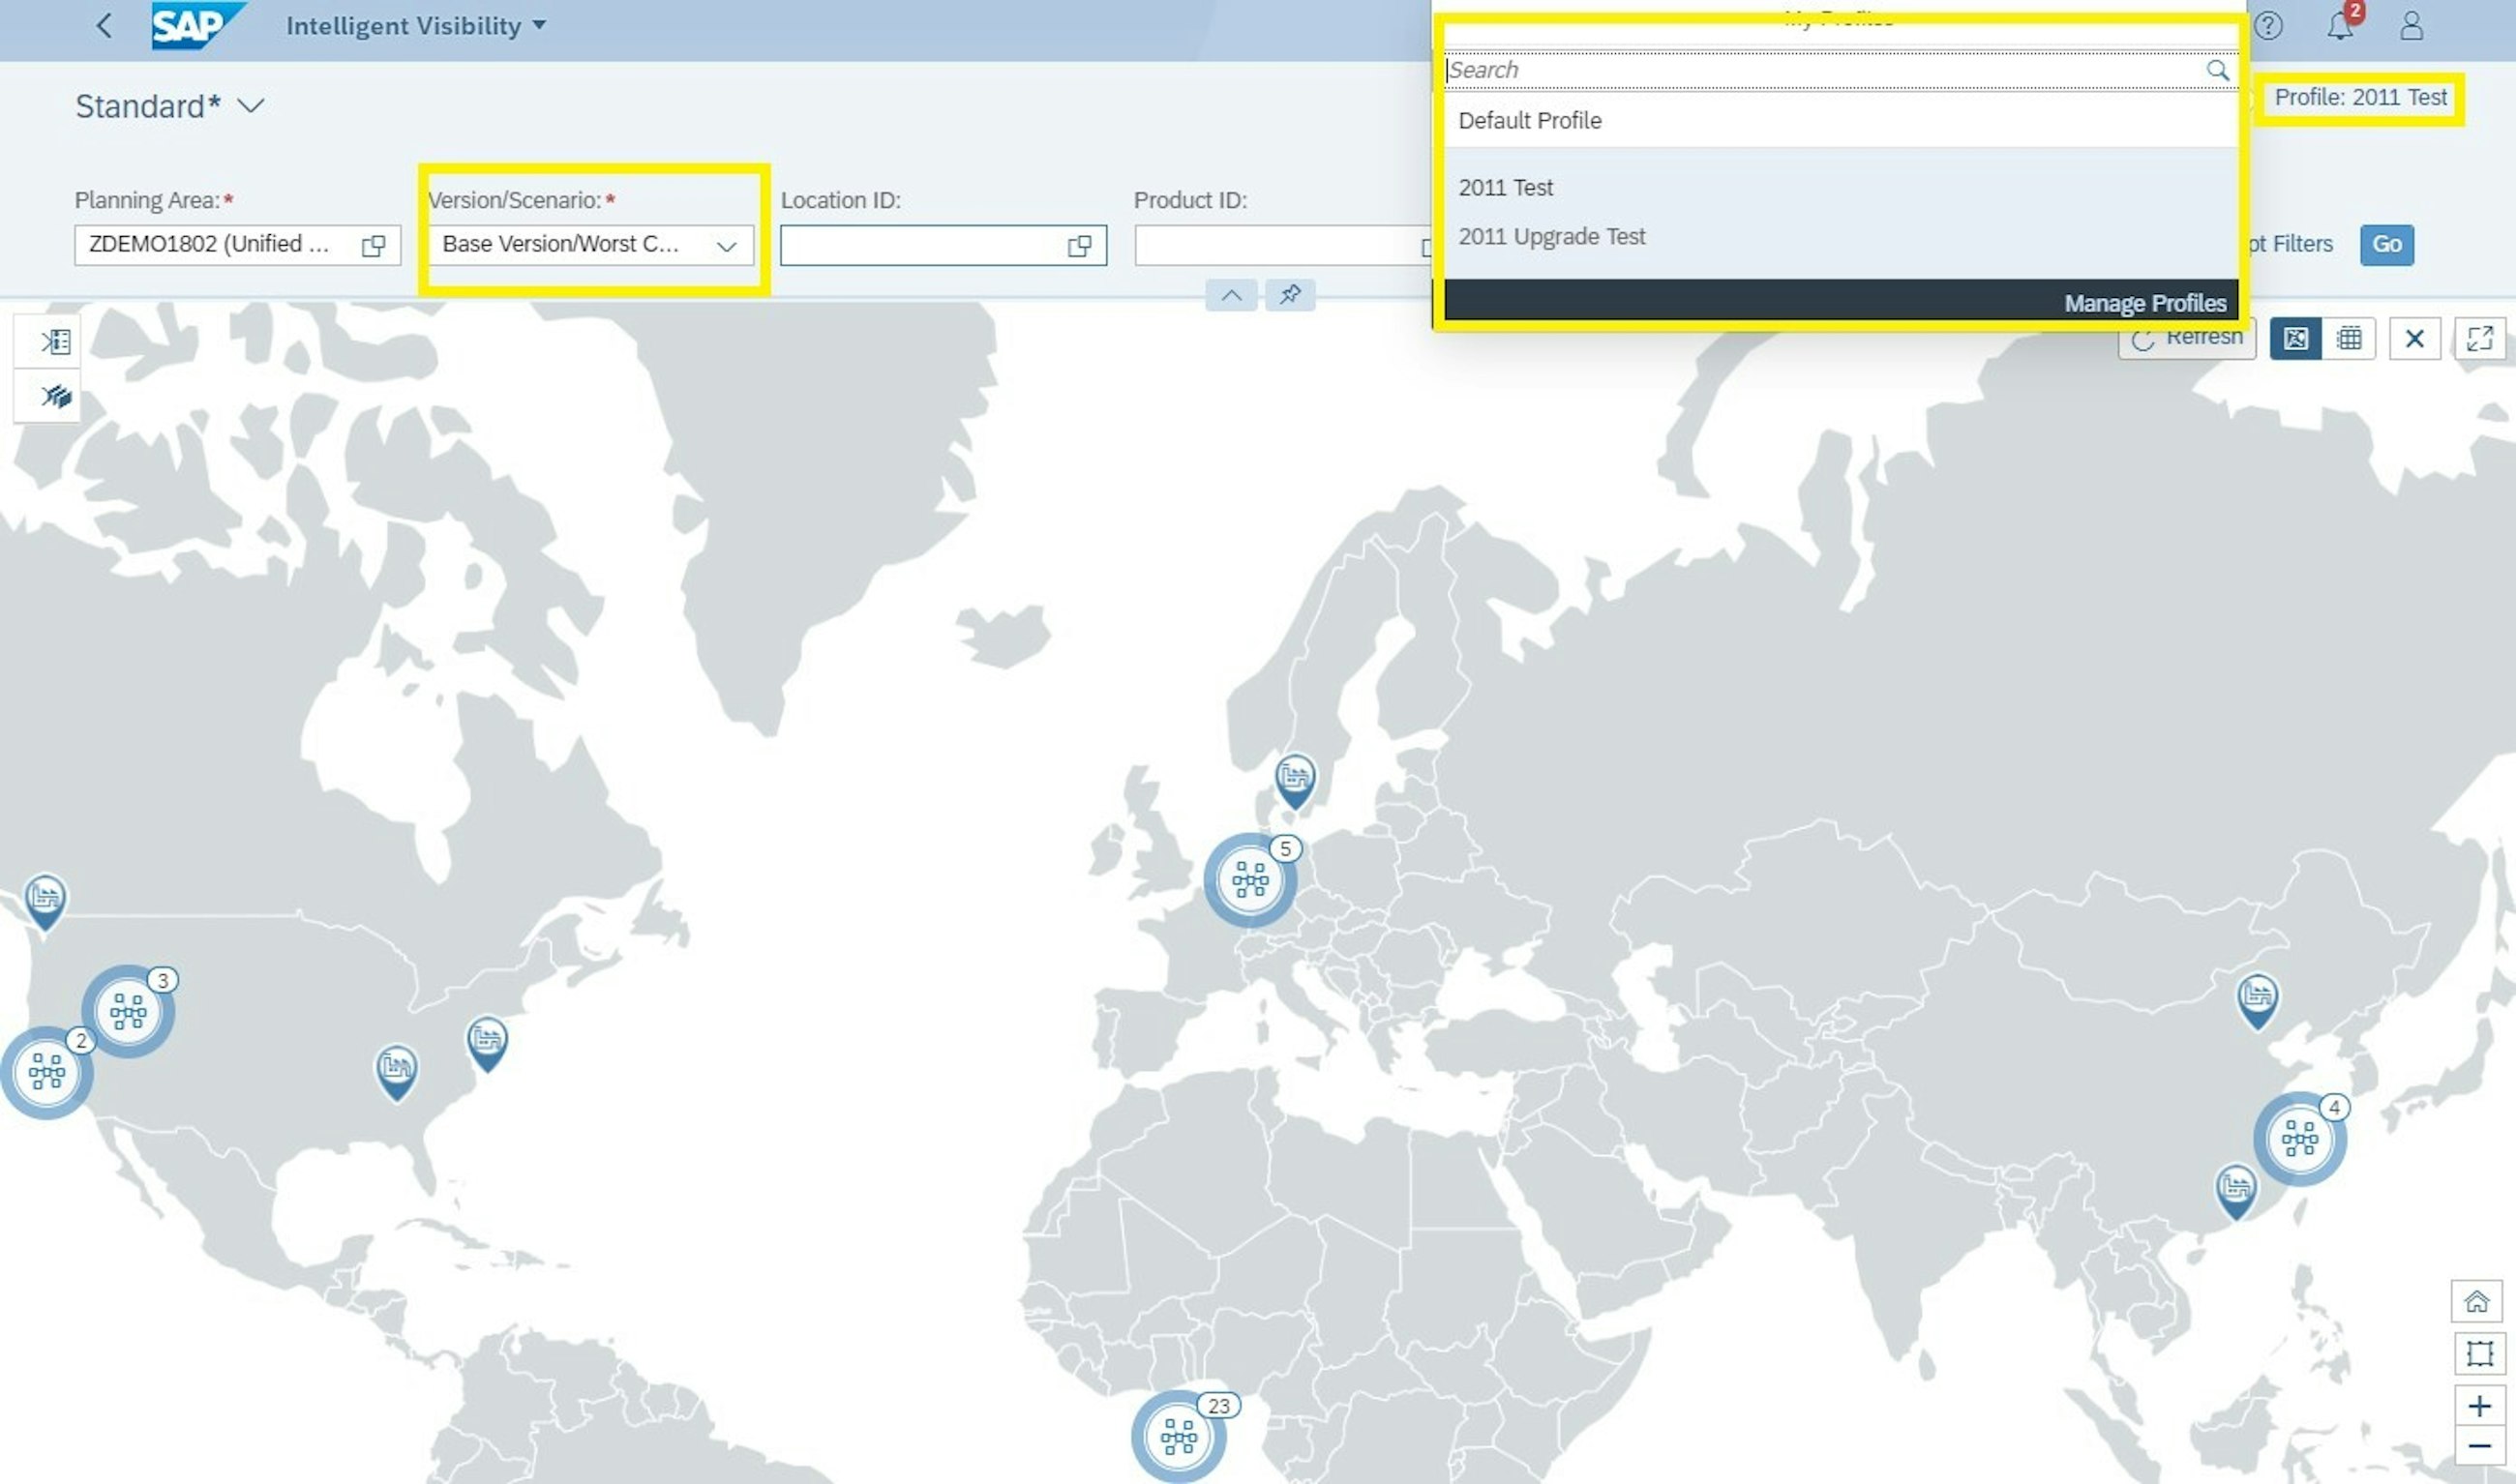
The Intelligent Visibility app (IV) was introduced with the 2002 upgrade. With the app, you can monitor processes and exceptions on a map or in a table and attain real-time visibility over supply chain issues. To make it easier to work with, SAP now introduces a new app: Intelligent Visibility Profiles. You use the new app to configure the content and the appearance of IV – the Intelligent Visibility Profiles app settings include map options, layout, charts and sharing options.
In addition to this, SAP has also made a few new features for the already existing Intelligent Visibility app:
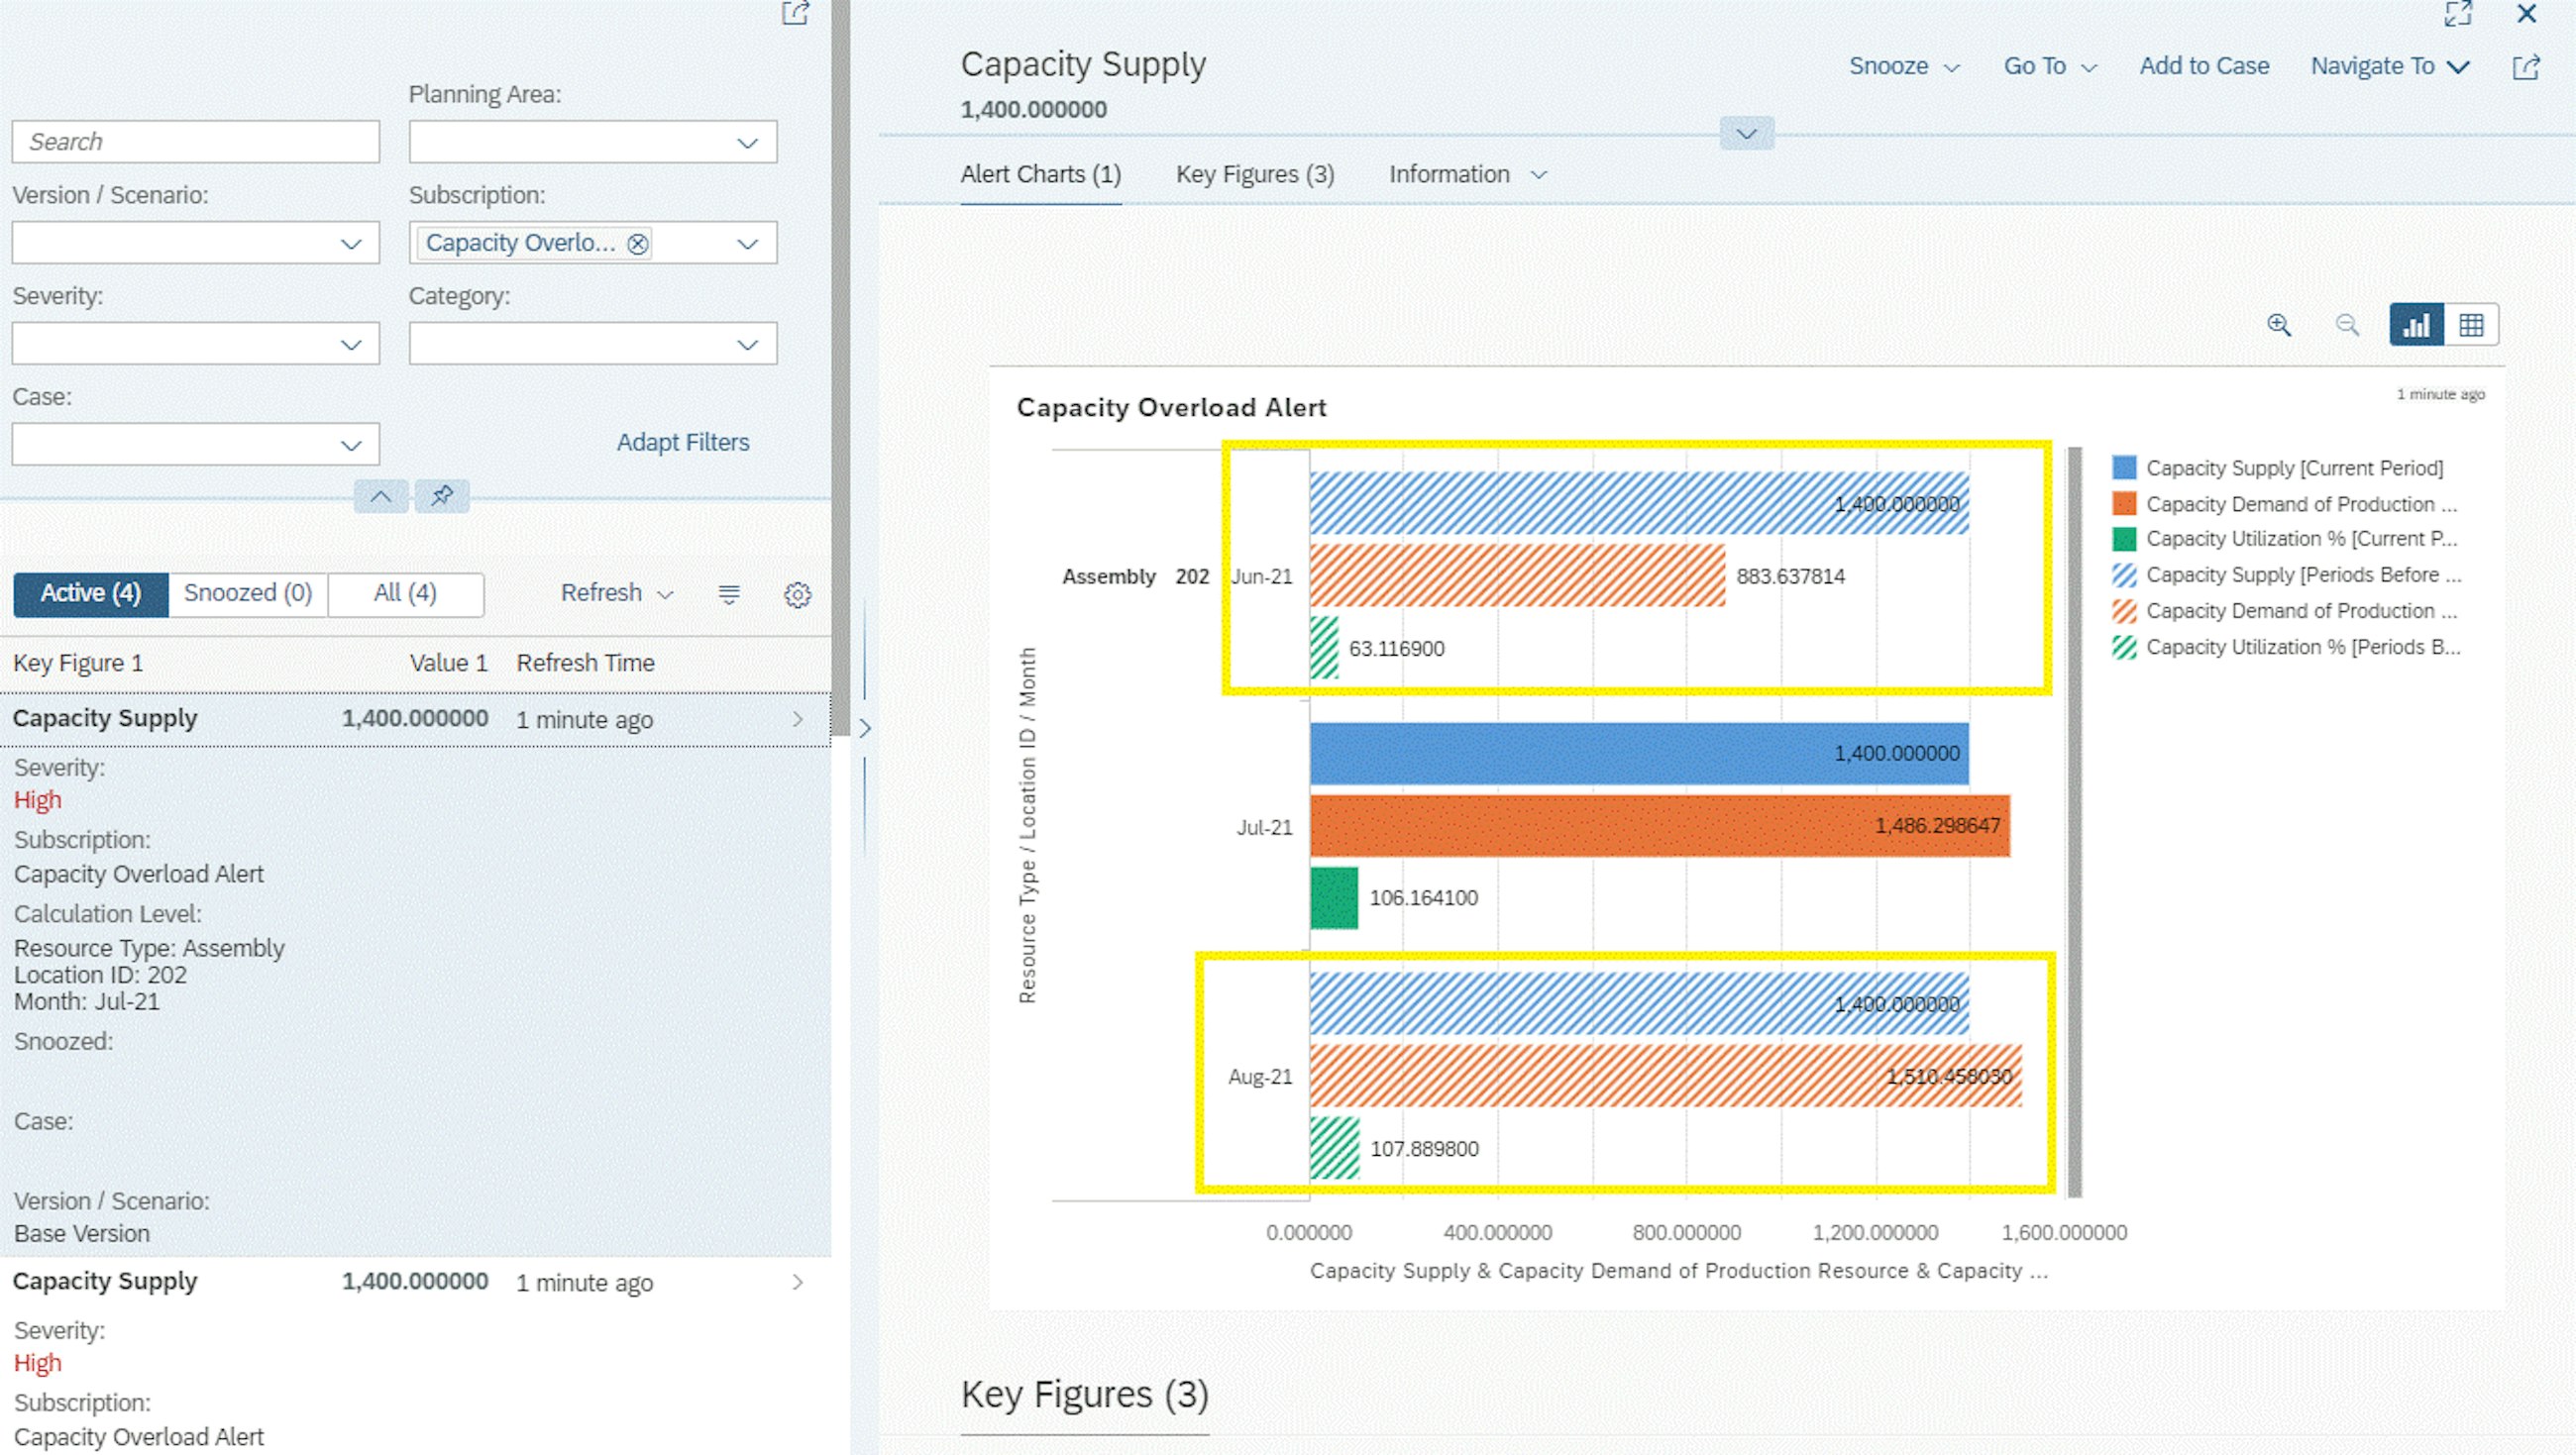
Moreover, SAP has introduced two new functionalities which have also become available for the Monitor Custom Alert app:
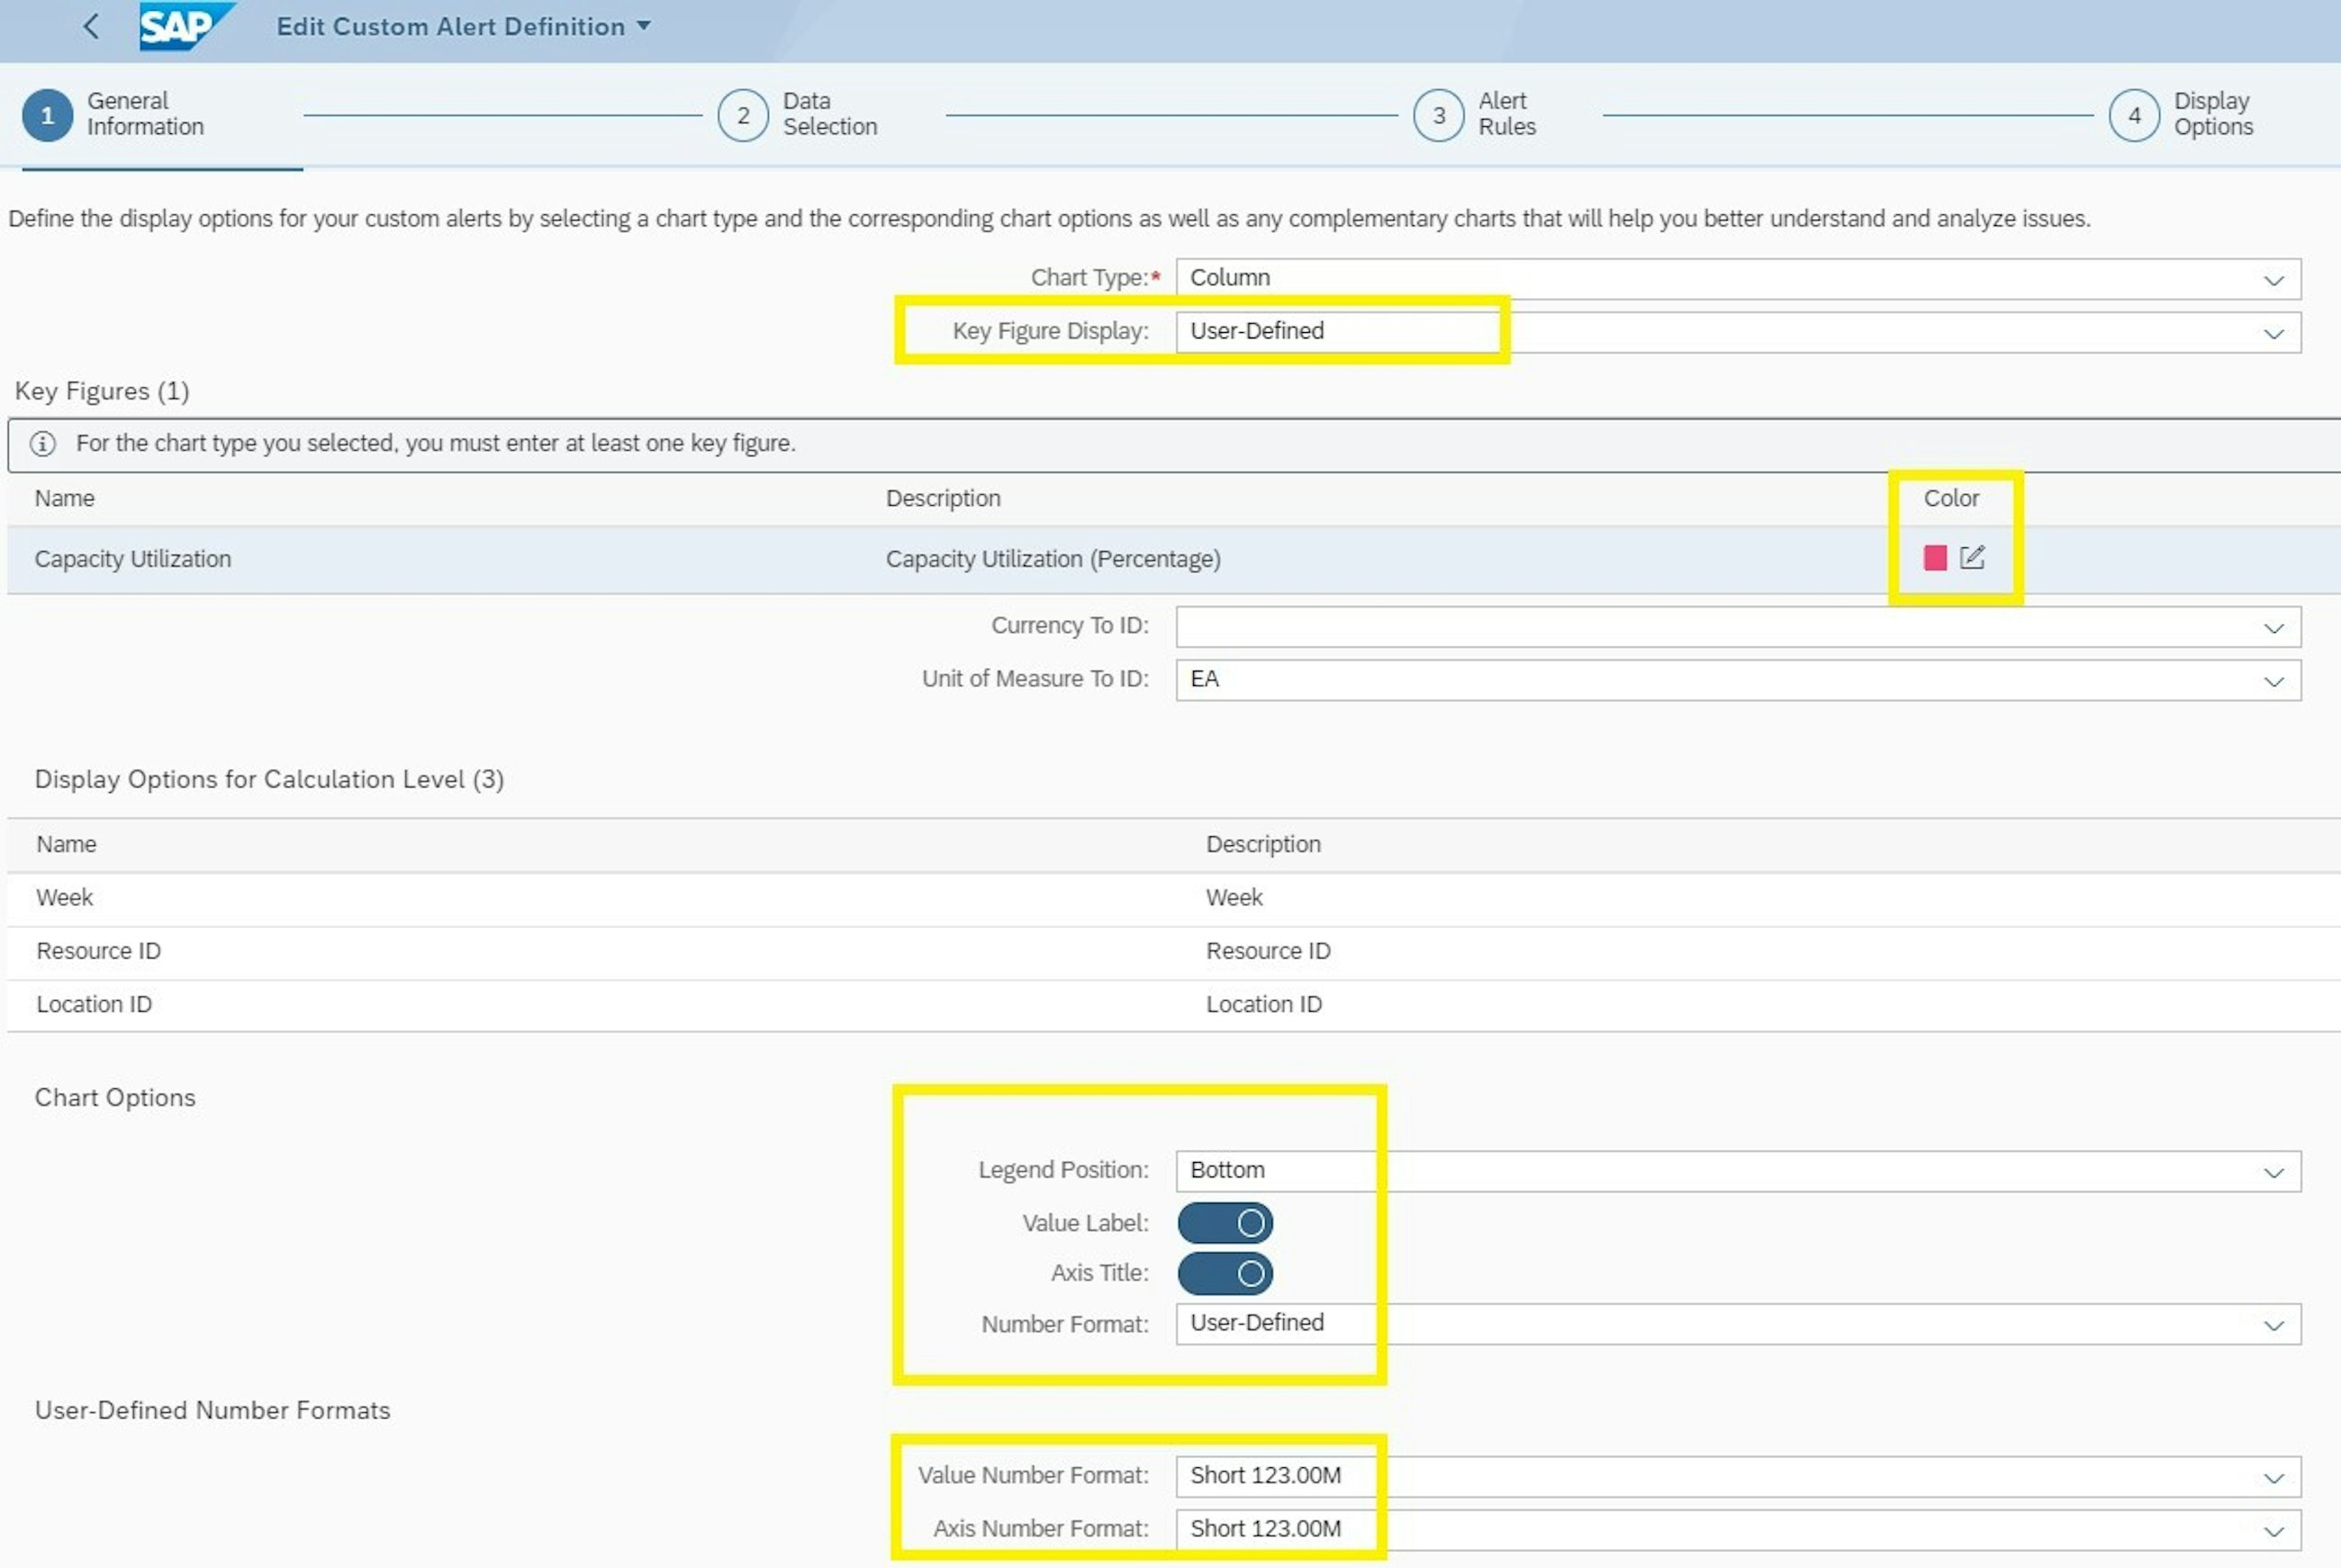
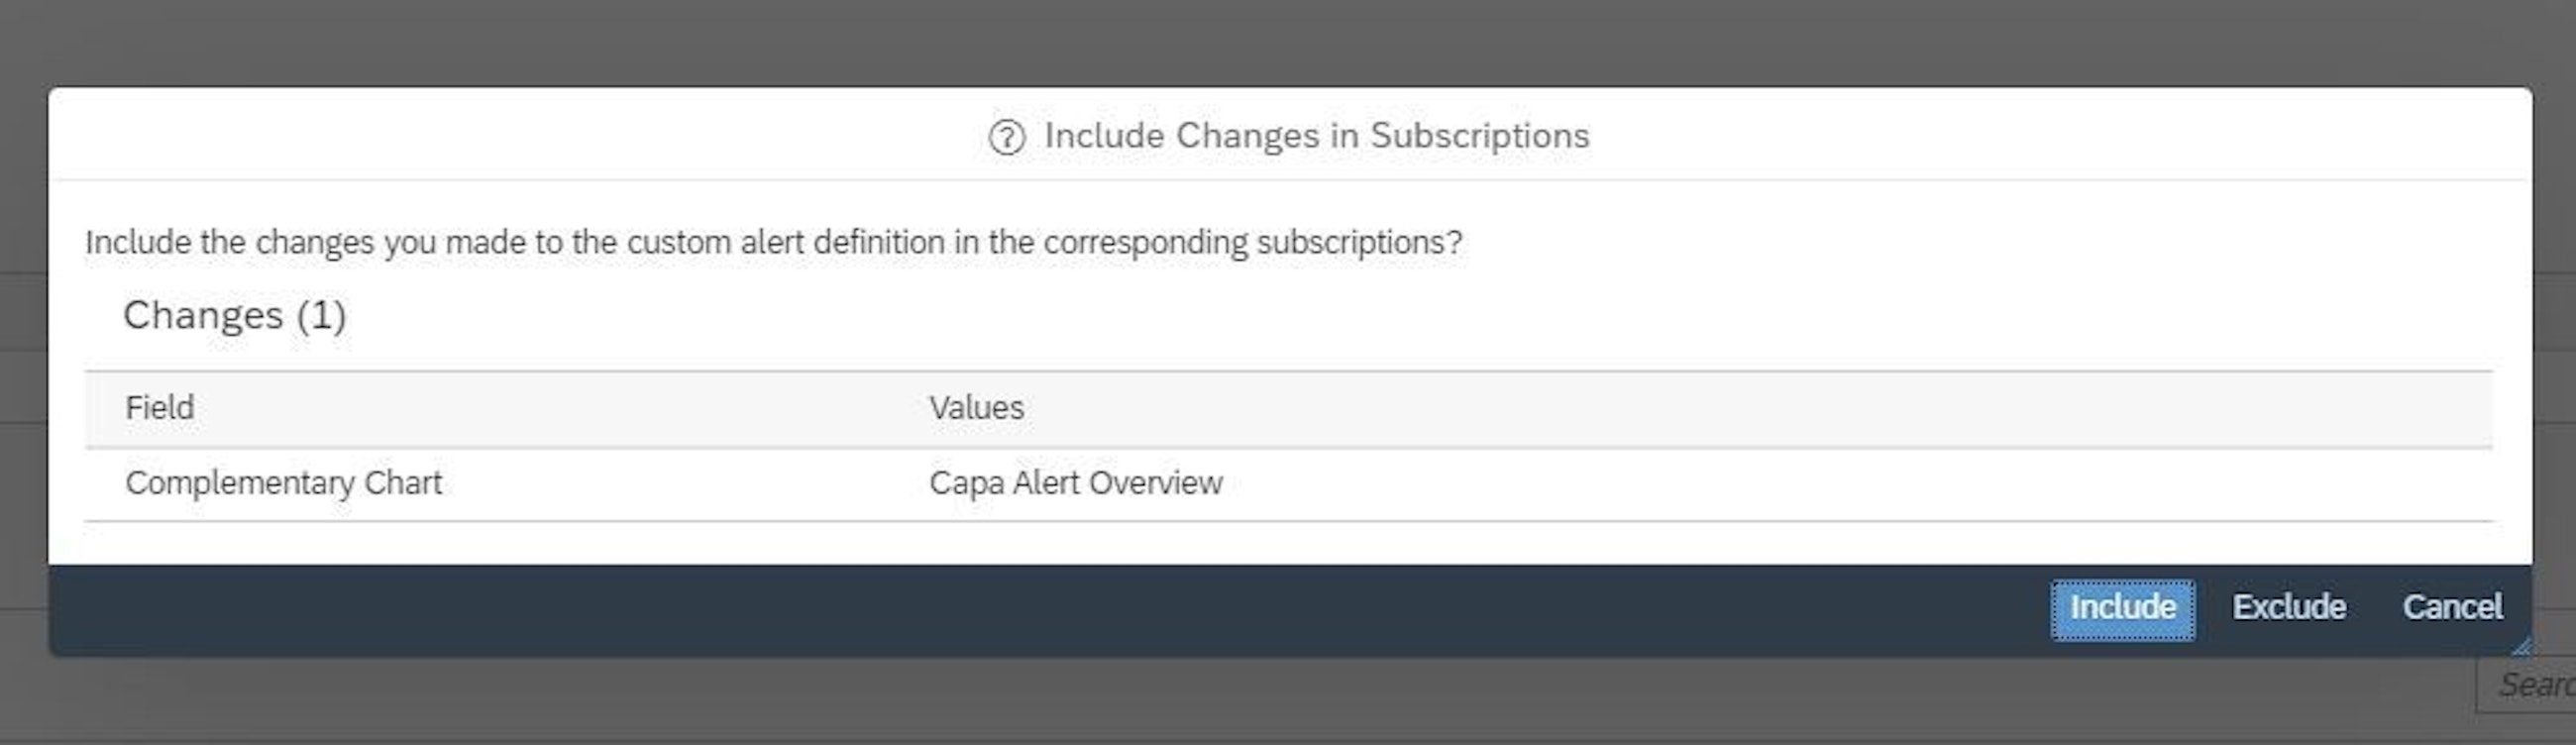
With the 2008 upgrade, SAP replaced the old Define and Subscribe to Custom Alerts app with a new version. Now, only three months later, we already see some new enhancements in terms of usability:
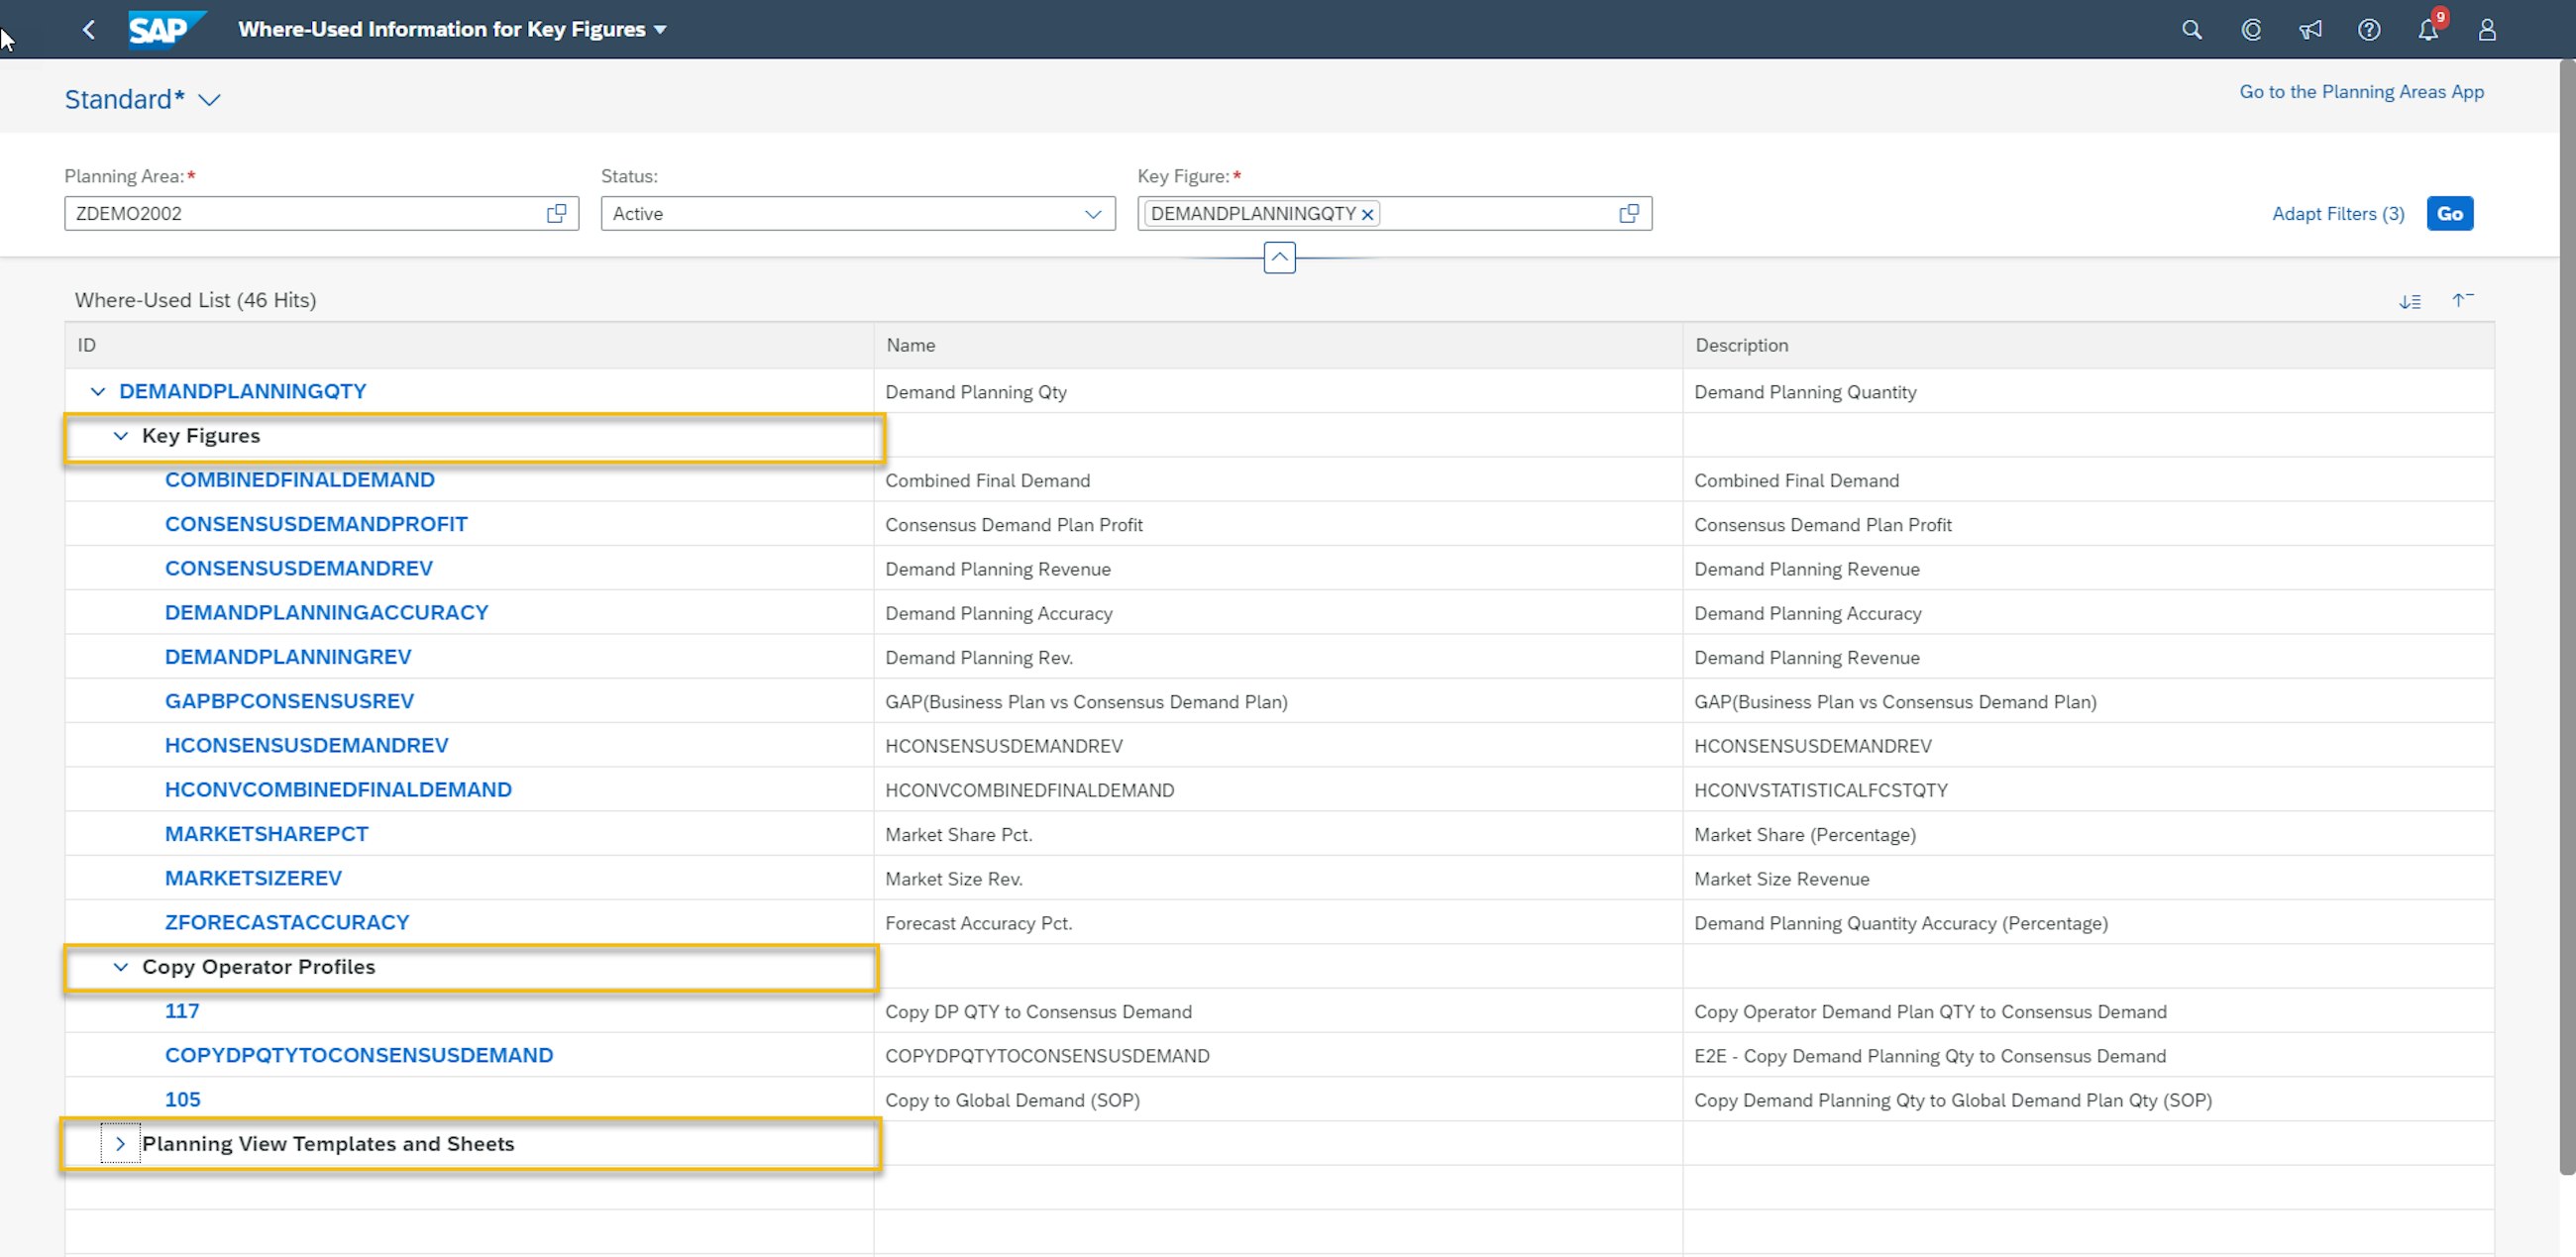
In the 2011 release, SAP has continued to improve the usability in the SAP Fiori apps where the introduction of the Where-Used Information for Key Figures application is added to the solution. This application allows you to display where-used information in which calculations key figures are used, which copy operators the key figures are a part of and also in which planning views they are added to.
A business scenario could be that business users are experiencing data inconsistencies for a key figure in an Excel planning view. However, they do not know where these inconsistencies are stemming from. The features in the new app enable a faster troubleshooting as back-end users can now get a quick overview of potential causes to the problem by getting a fast overview of where to find the root cause.
For a long time, it has only been possible to detect where key figures are used in copy operators by going through each of the copy operators. This has potentially caused many hours spent reading documentation for the Copy Operator setups – time spent which this new functionality now eliminates.
Remember that before business users can access the where-used information for key figures, the business catalogue must be added to the users’ role in the Maintain Business Roles app.
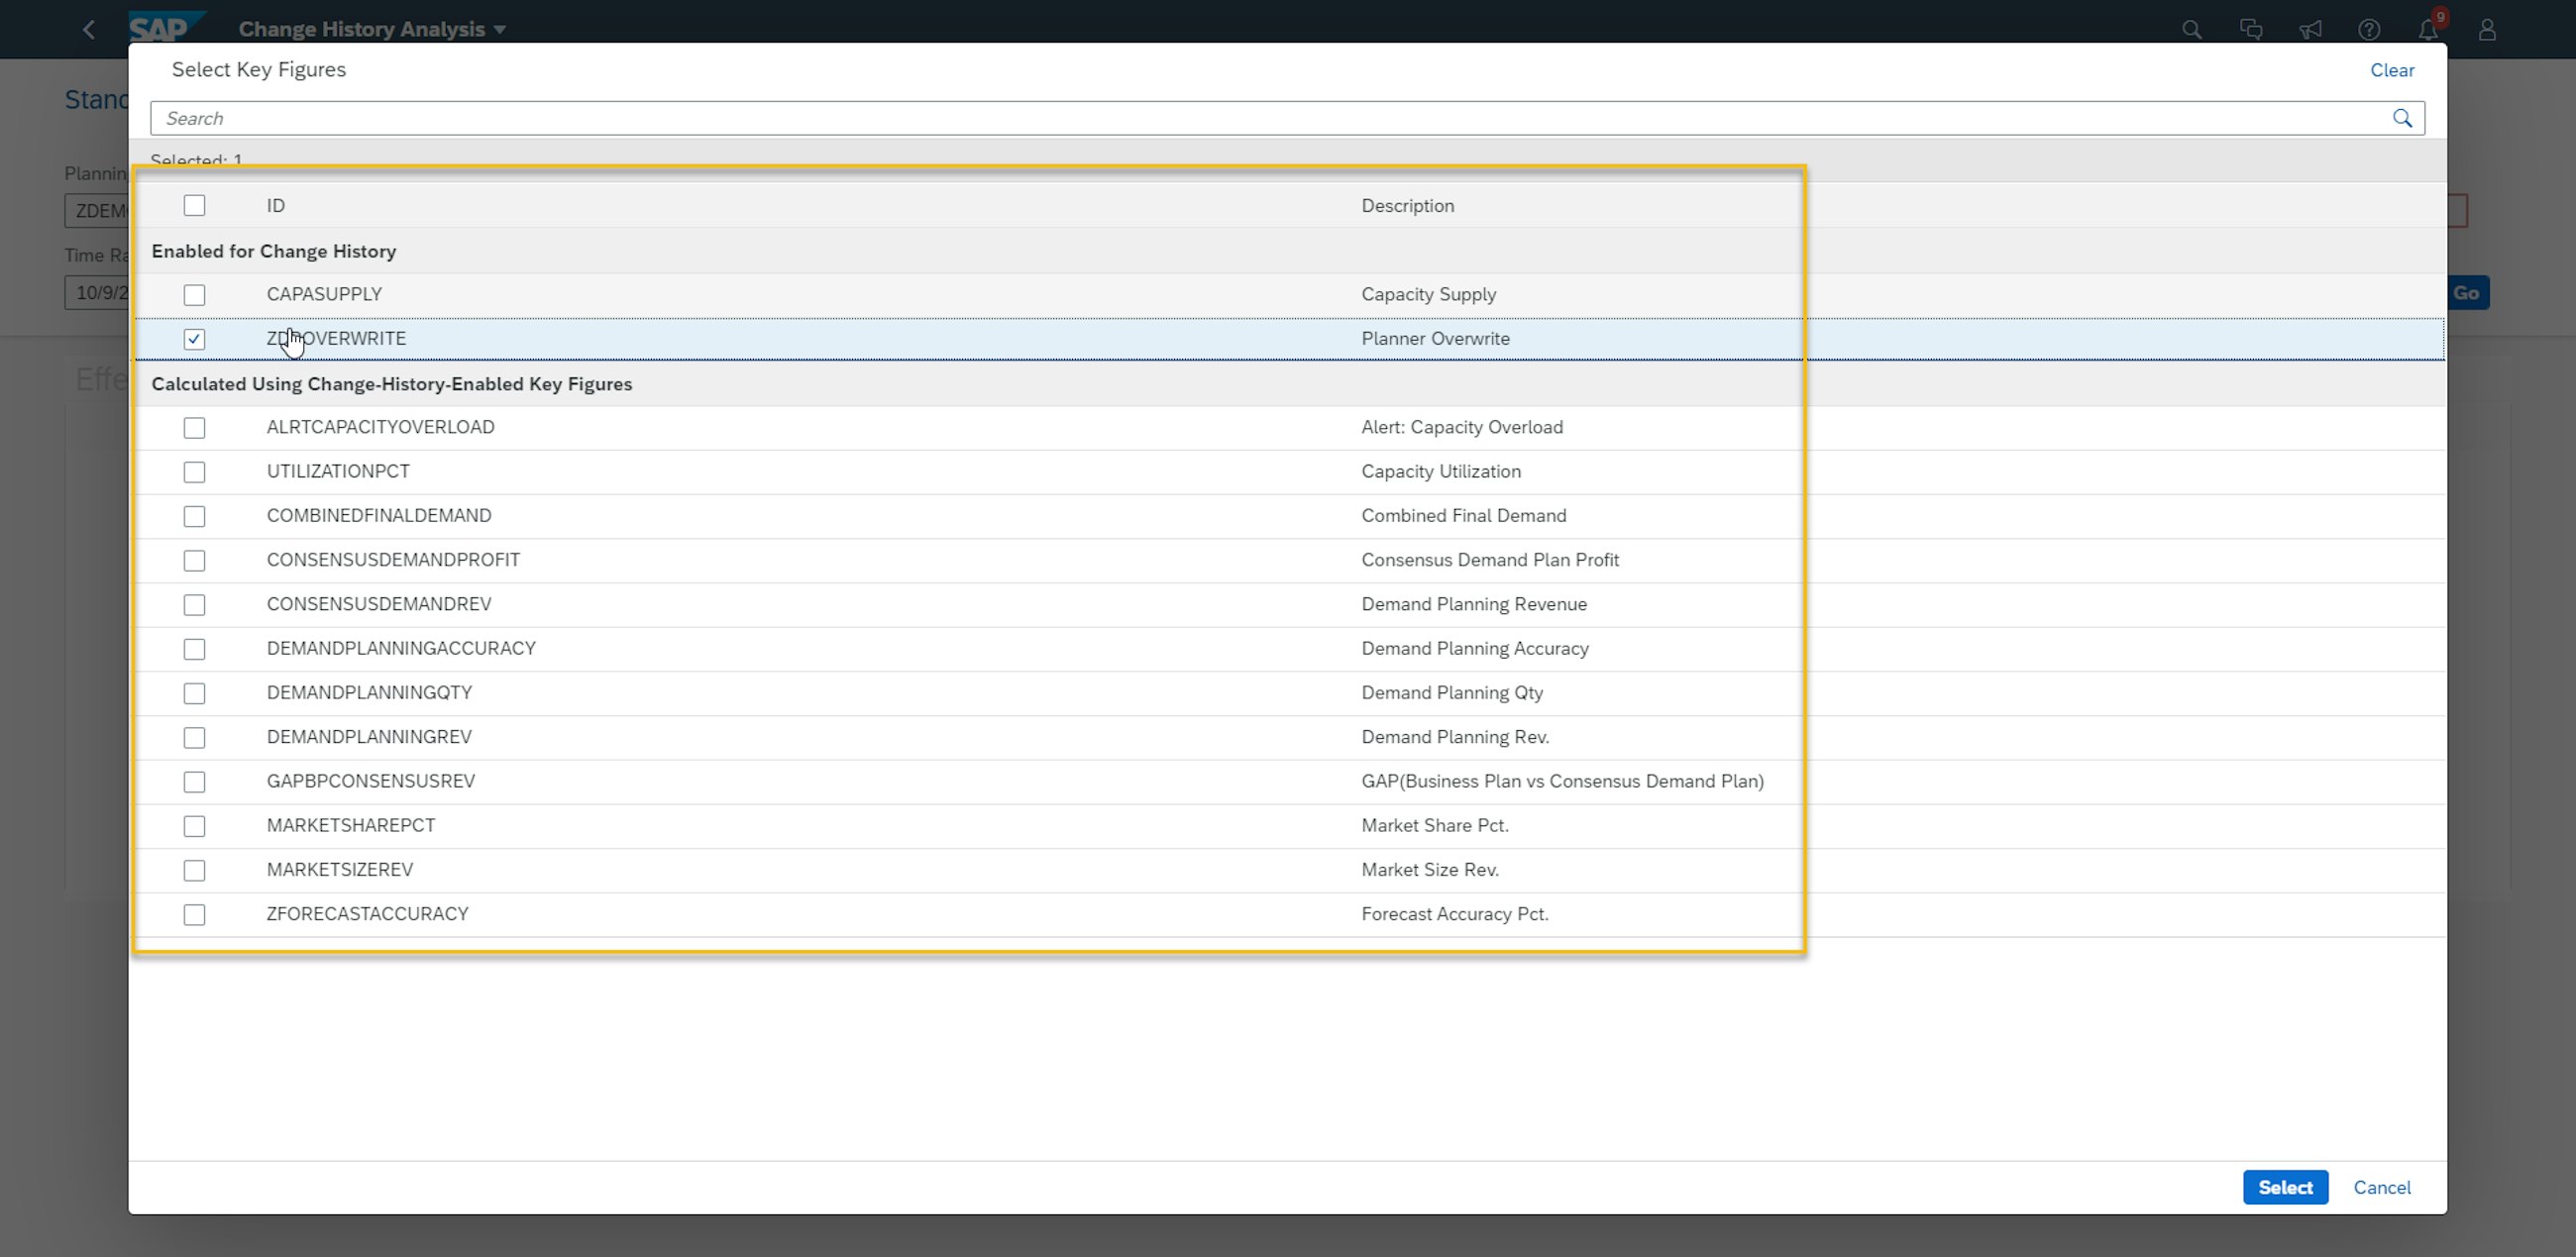
One of the enablers for a strong planning process in SAP IBP is the use of collaborative planning. With the 2011 release, SAP IBP now provides improved ways of reviewing changes to the plans in the planning processes with the new Change History Analysis app.
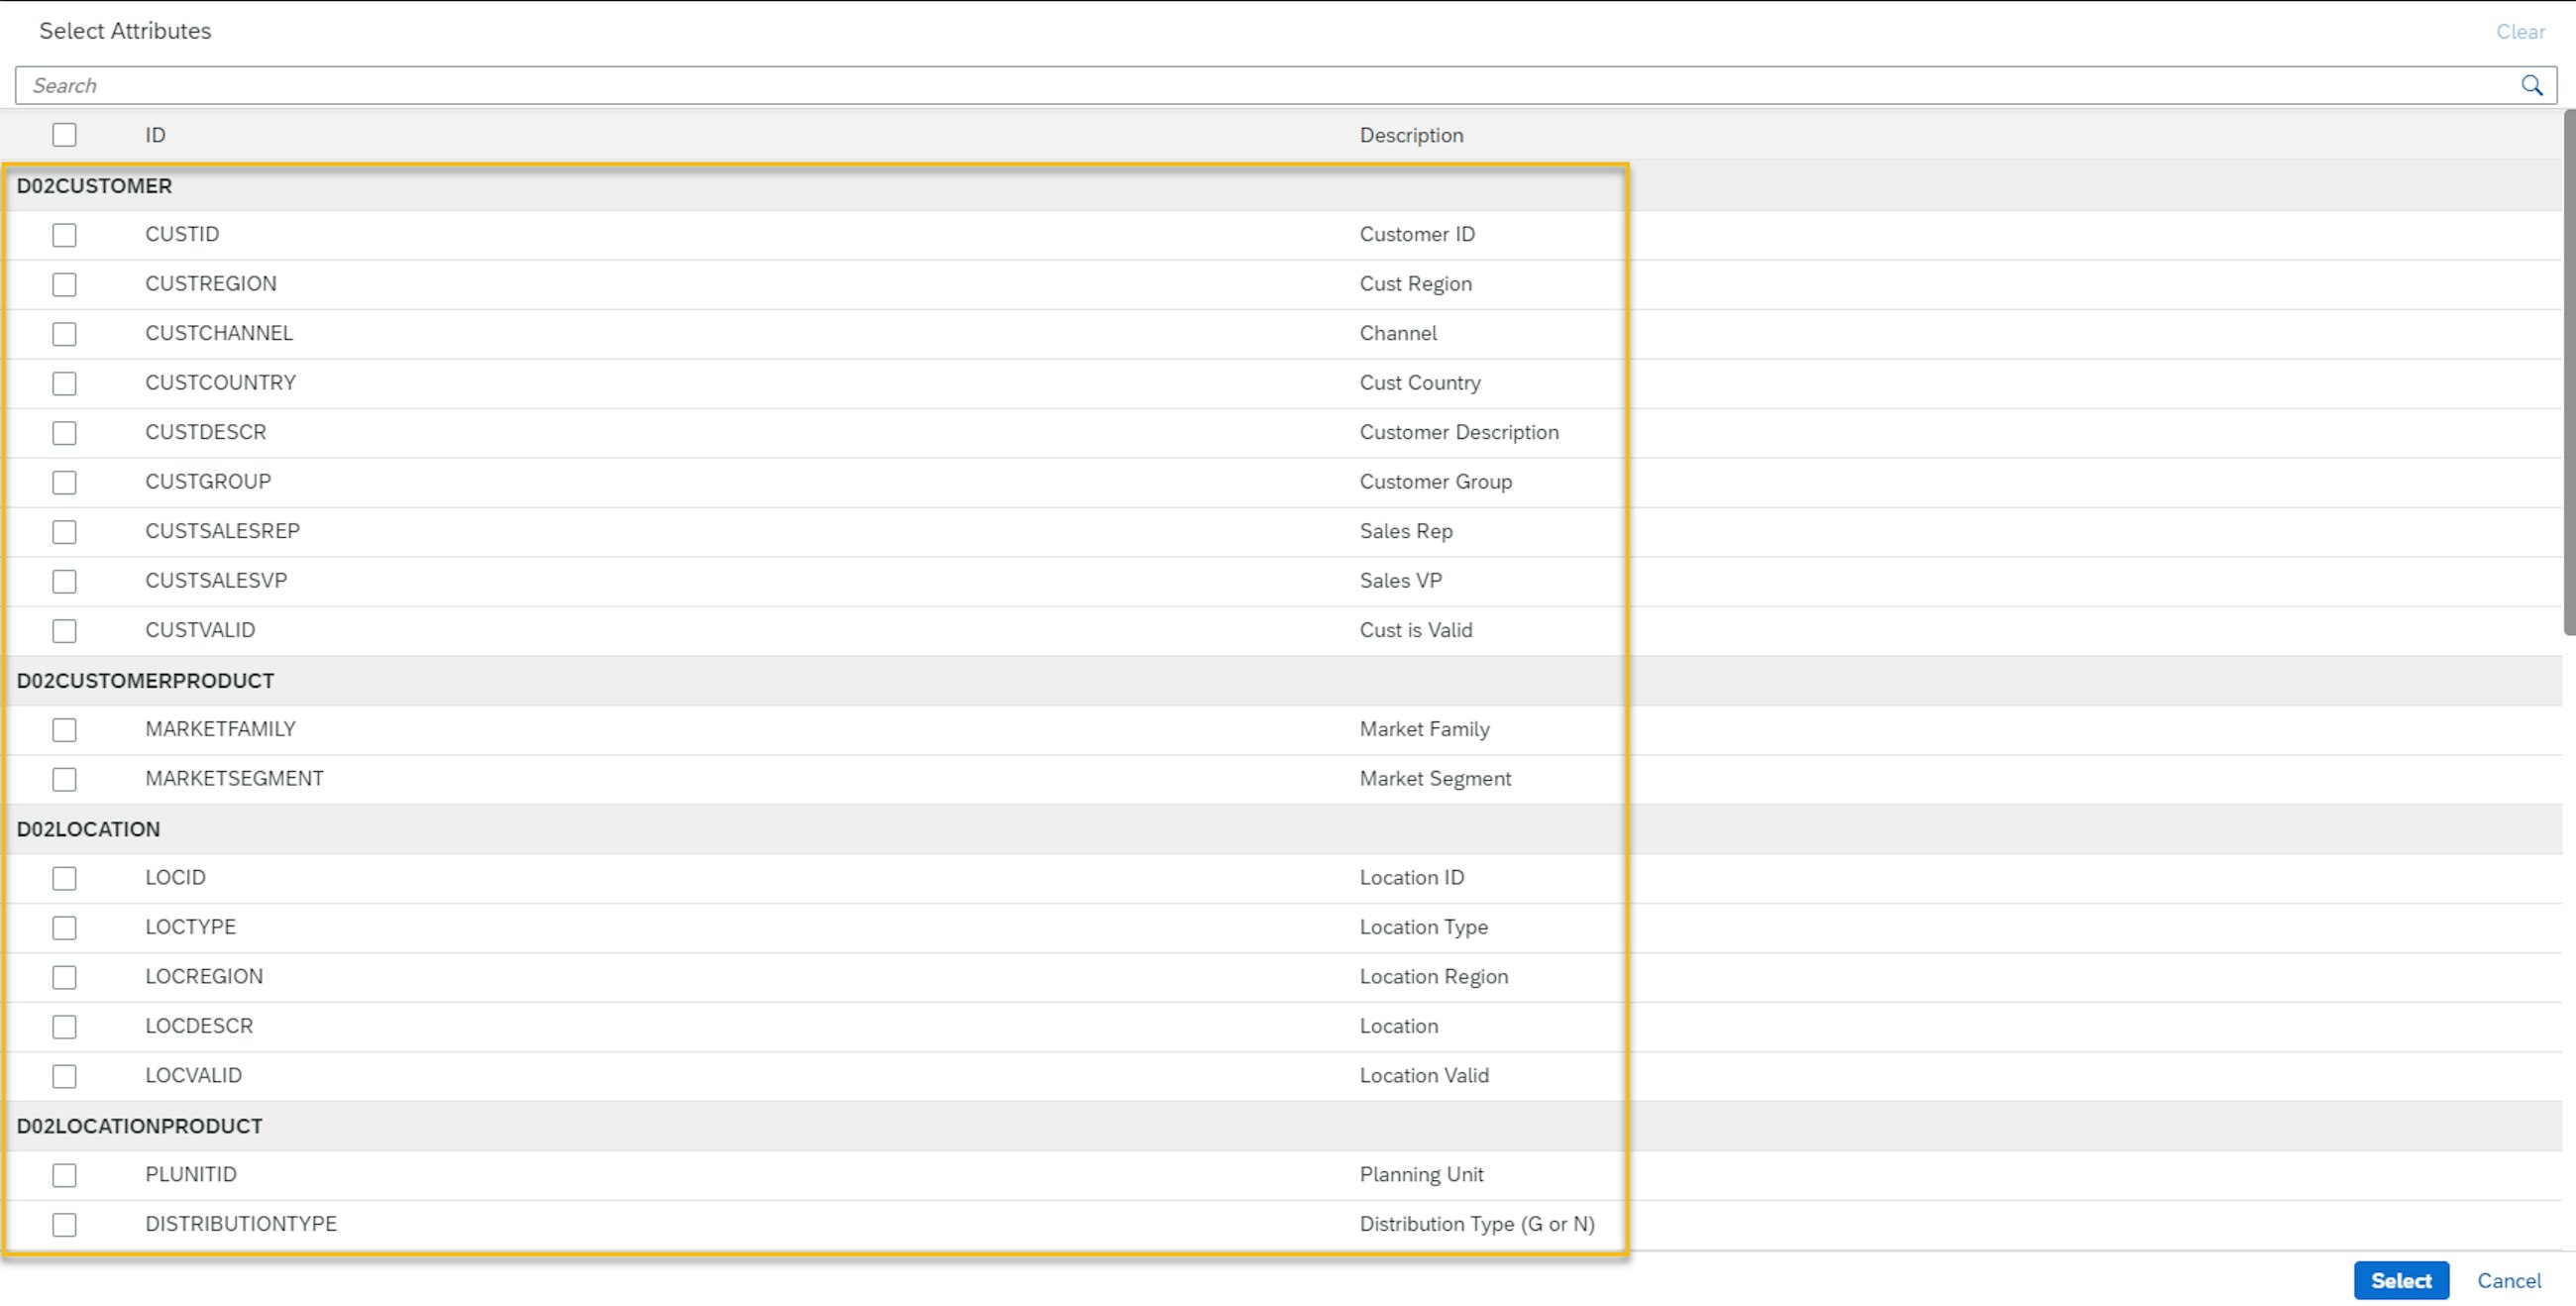
The new app has improved usability and improves planner productivity to analyse changes that affect the plan and the reason behind the changes to the plan. A key feature is that the new Change History Analysis app now only displays key figures configured as Change History enabled along with related key figures, for example if the key figure enabled for change history is a part of a key figure calculation. This is further improved by the more user-friendly attribute selection, which only displays the attributes on planning levels related to the selected key figures in the list. Furthermore, you can now select rolling time periods with calendar dates and make use of planning filters.
The key improvements for this app include:
An additional enhancement of the Change History functionality is that planners now can save multiple change history variants and share them with other users of IBP, just as you know it from the Excel front end.
Additionally, planners can now view shared change history views in the Content Administration app.
SAP will replace the old Change History app with the new app by the 2105 release and provide migration reports to merge Change History planning views in the old format with the format of the new app.
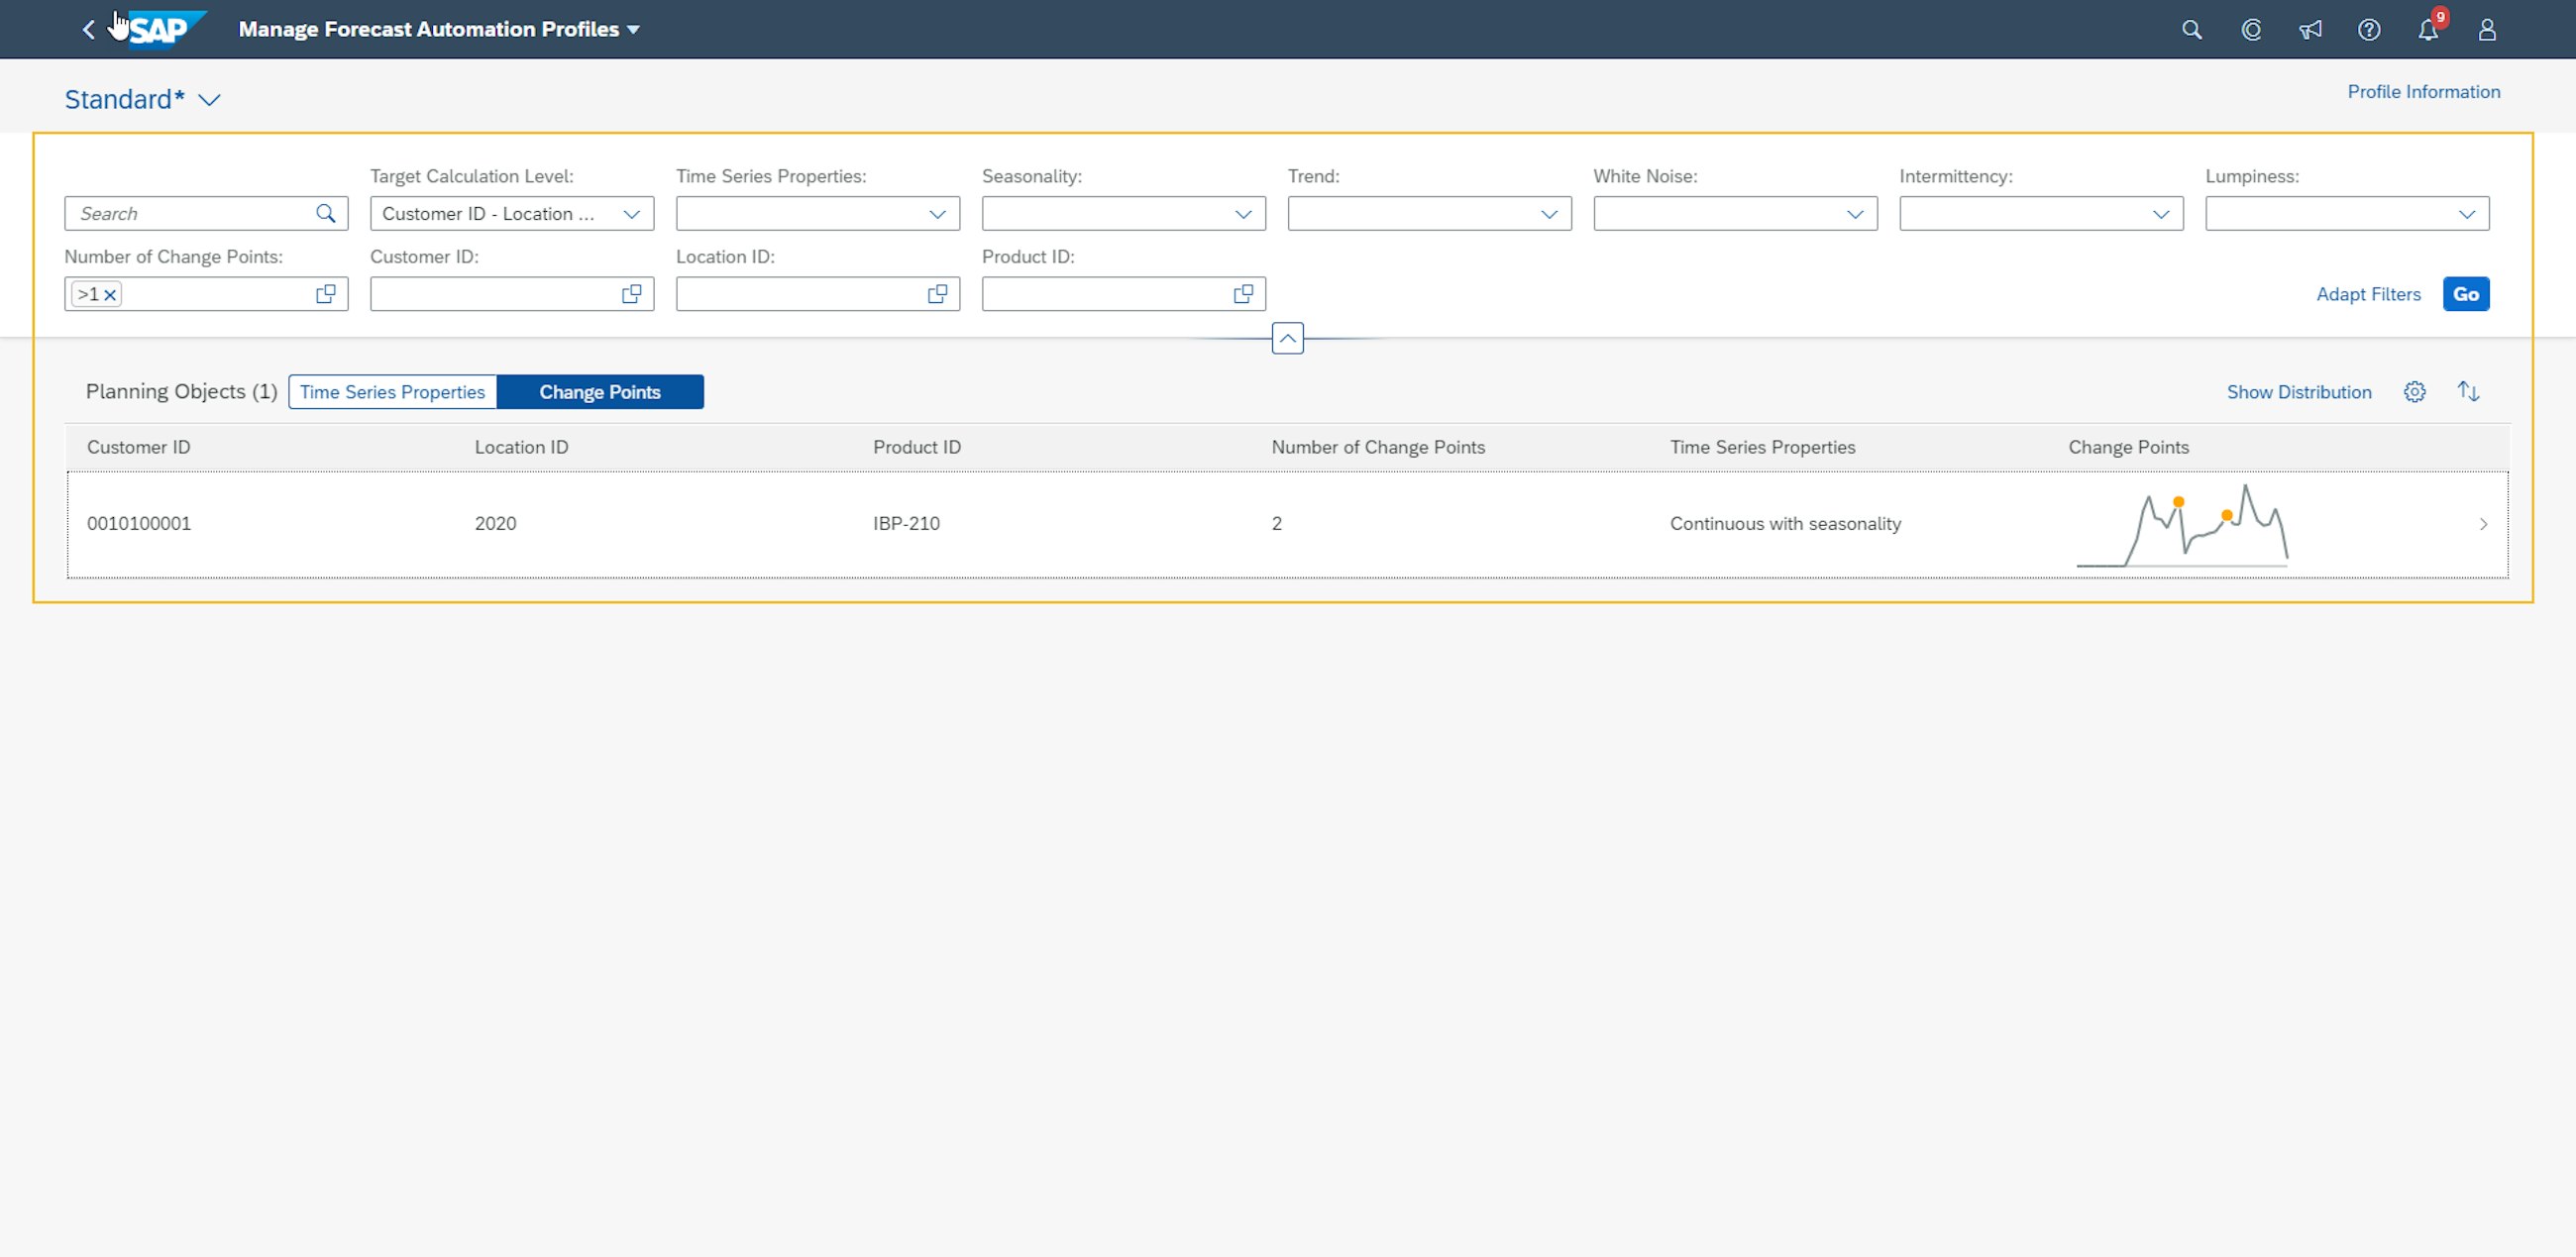
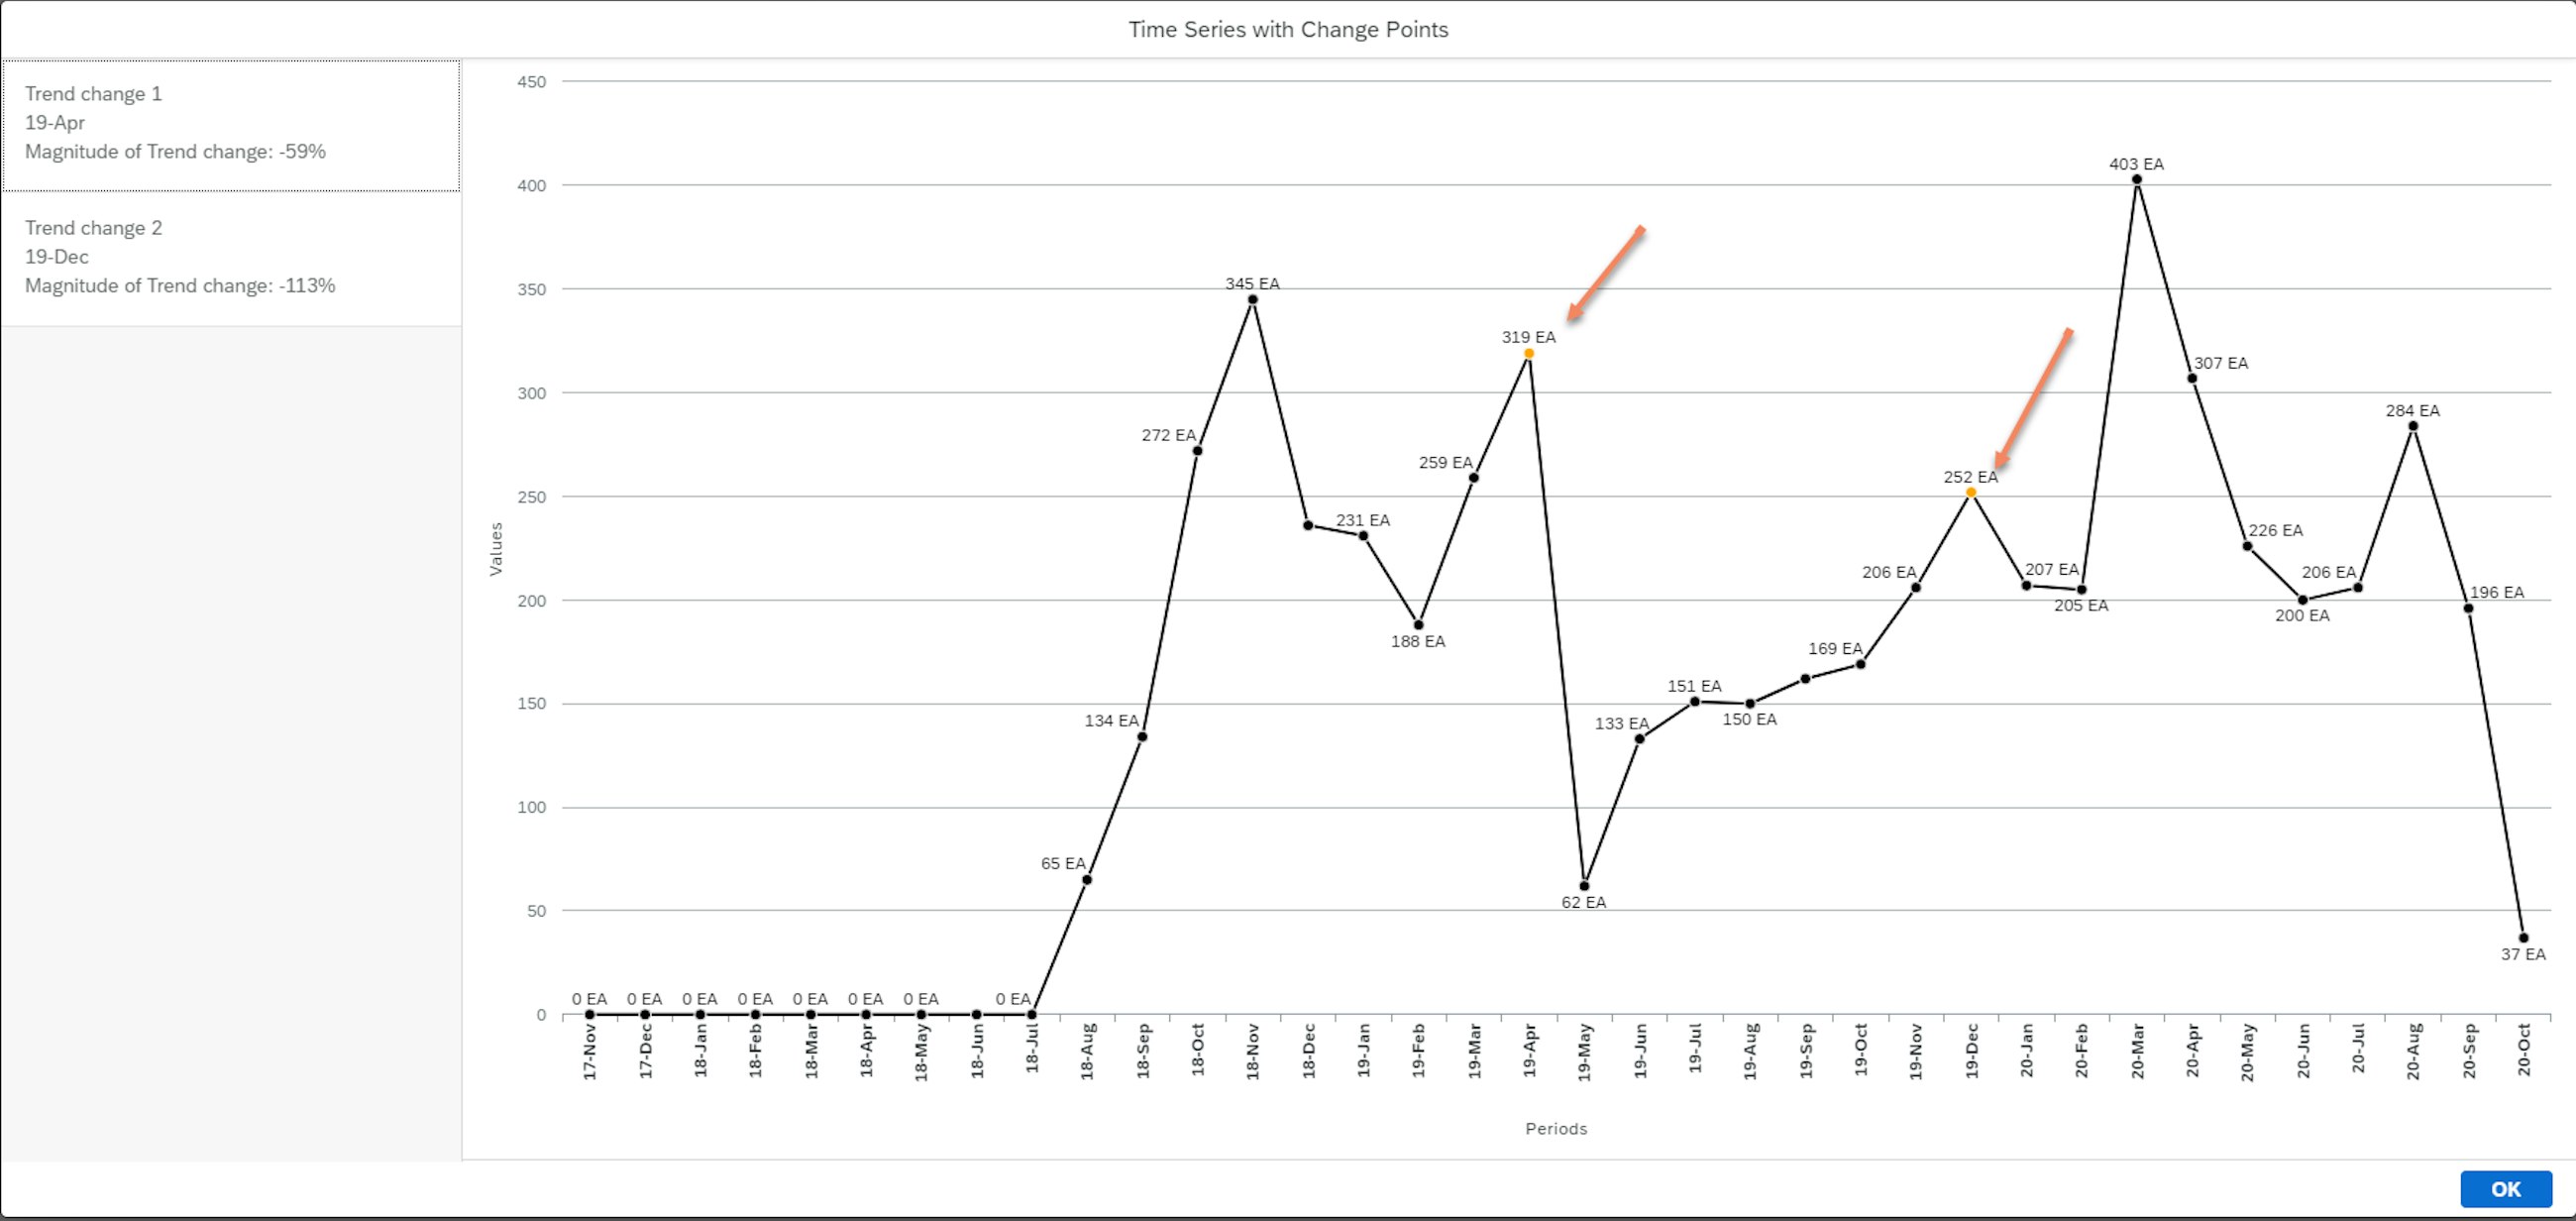
A year ago, in the new features of SAP IBP 1911, we presented the improvements for demand planning in the area of forecast automation functionality for trend and step changes. One year later, the functionalities are further improved in the new upgrade.
Until now, the change point detection was disabled for seasonal data, which was done in order to avoid “false positives”. Nevertheless, change point detection will from now on be able to check if your sales history data is seasonal and will also consider the impact of the seasonality during the change point detection.
For example, seasonality may occur when a product is only demanded during specific periods of the year, e.g. summer or winter. The algorithm would identify these seasonal patterns in the time series and would identify if there is a change point outside the seasonal impact.
In the 1911 blog, we explained how you work with the step change and trend. Here, we will guide you on how to include the seasonality in your analysis of the time series:
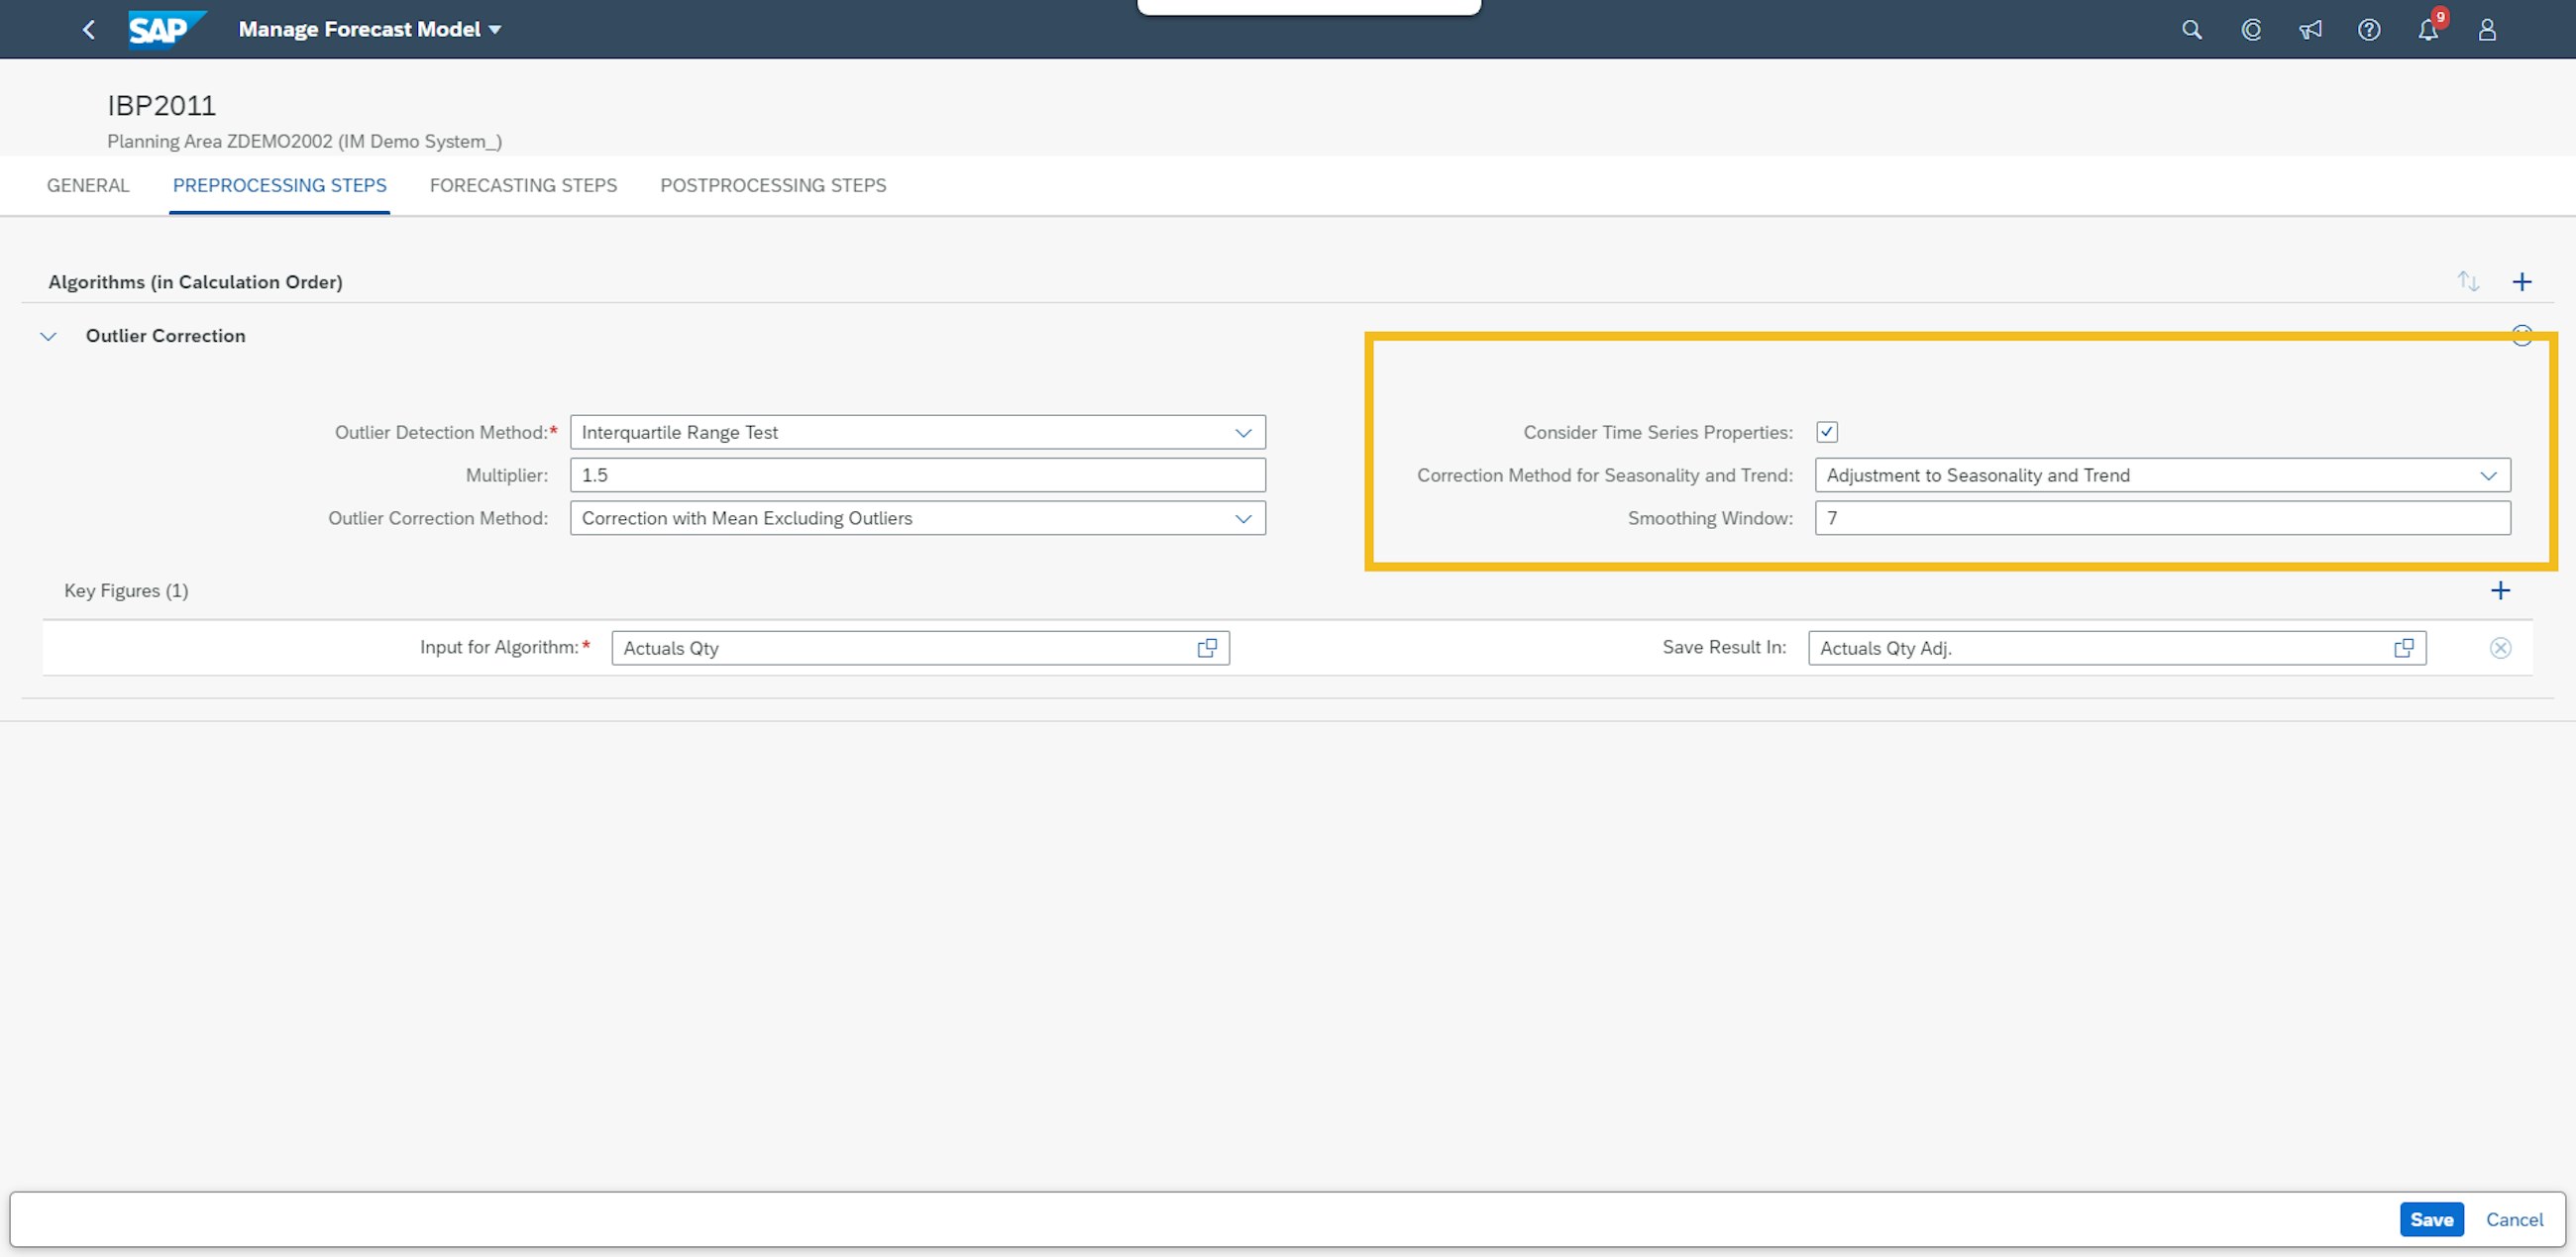
In the SAP IBP 1911 release, the information was only registered, but no actions from the system were executed to support demand planners. In this release, you can use the output results of the forecast automation for outlier correction, which can correct for seasonality and trend. The prerequisites for this to happen is that the forecast automation job is finished.
To utilise the output results for outlier correction, you need to set up the pre-processing criteria in your forecasting models to consider time series properties, where you can choose which outlier correction you want to use. The adjustments to seasonality and trend will then identify the outliers outside the season and trend that is identified in the forecast automation job, and the outlier correction will replace those values with your defined outlier correction method.
One thing you need to remember when using the outlier correction is that the time series analysis must run on the same level of the statistical forecast, including outlier correction.