Article
How the present course of events will affect the future energy landscape
Article
Read more
17 March 2023
In this article, we argue that the war in Ukraine will imply:
Consequently, Europe is in the middle of a rapid, volatile and uncertain transformation of our energy system leading to fundamental changes for the energy sector and energy users.
The Russian supply shock is bigger than the 1970s oil crisis
Russia sits on around 15 per cent of the world’s natural gas production of which 70 per cent is consumed domestically. Of the 30 per cent exported, three quarters (i.e. around 4 per cent of global gas use) used to flow to Western Europe via pipelines, and most of the remaining quarter flows to Asia via pipelines currently operating at maximum capacity.
Europe has already reduced its imports of Russian gas by 85 per cent (comparing Jan-Feb 2023 with Jan-Feb 2021), and the remaining 15 per cent can be eliminated before the end of 2024. After this, Europe will not buy a single cubic metre of Russian gas. This means that around 4 per cent of global gas supply has nowhere to go. Asian users do not have the same reservations as European users, but it takes years to build a new pipeline and liquefied natural gas (LNG) capacity. So, in essence, three quarters of Russian gas export are stuck in Russia, and 4 per cent of the global gas supply is taken off the market.
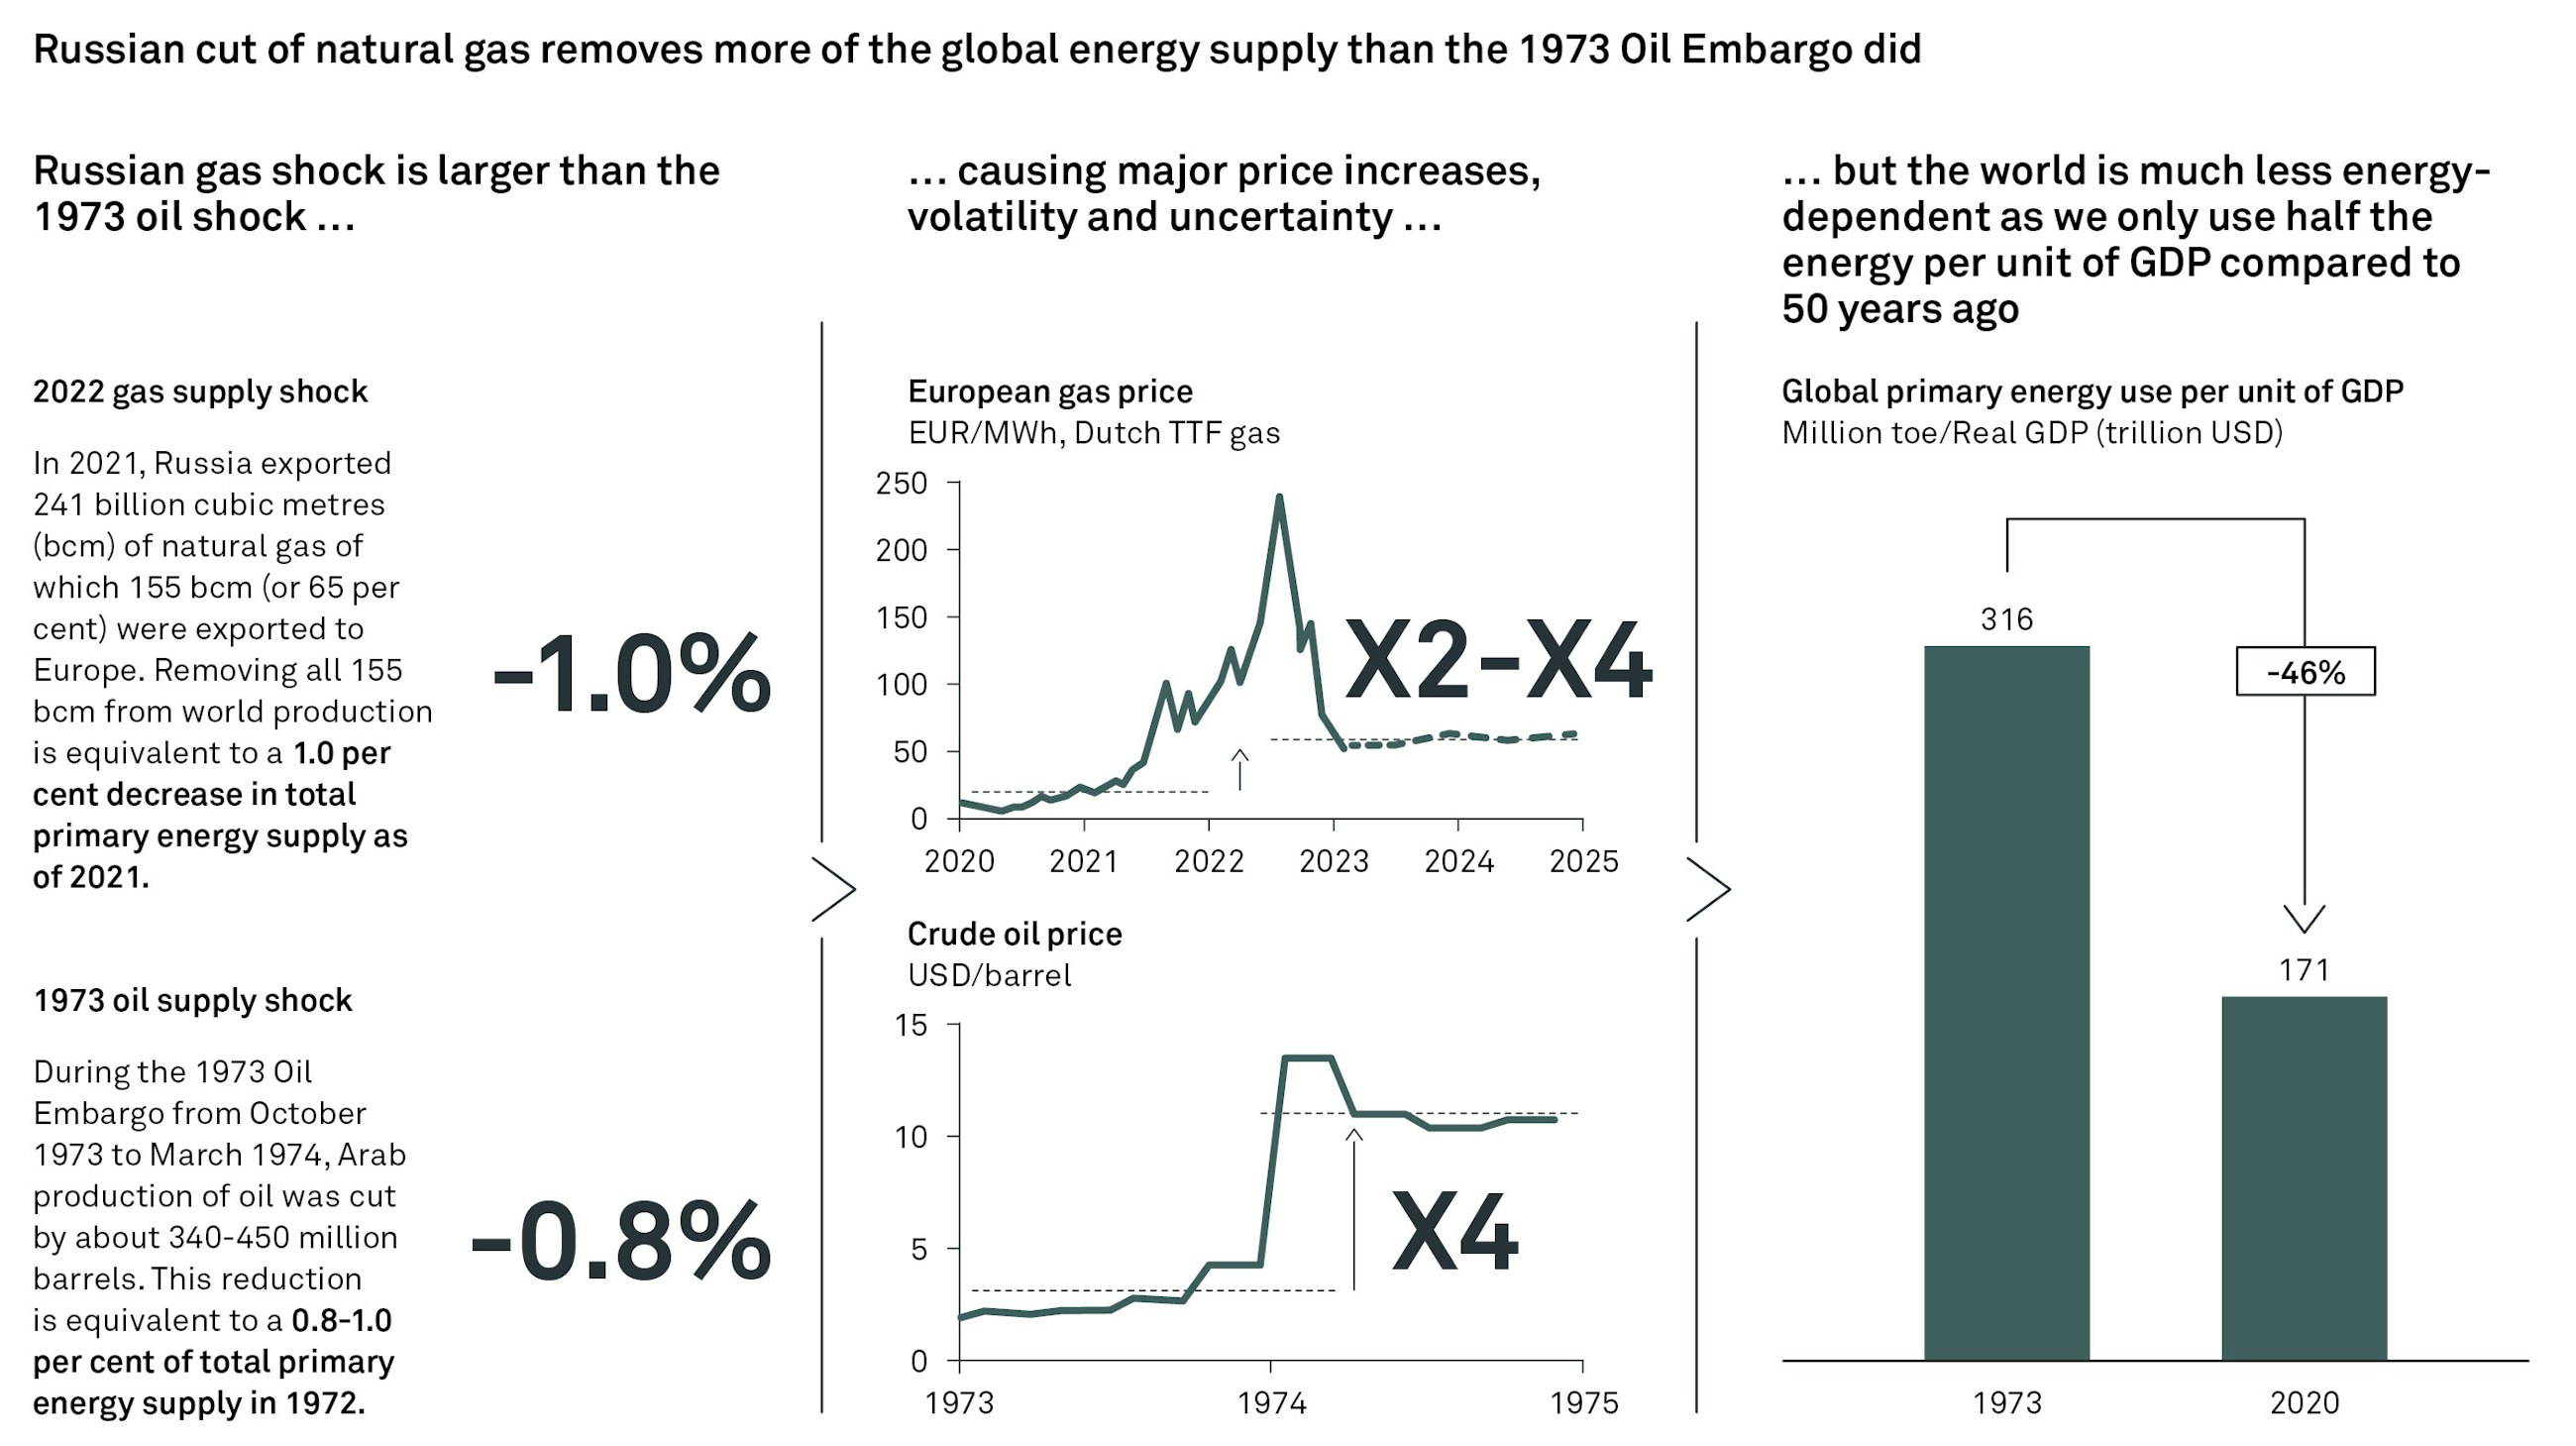
Natural gas constitutes around 25 per cent of global energy supply. So the Russian invasion of Ukraine causes a contraction of global energy supply of 1 per cent for an extended period of time until new pipelines and new LNG capacity are established. A 1 per cent supply contraction may seem small, but – as comparisons with previous energy shocks will show – a contraction of this size implies severe price changes as we have seen over the past year.
The energy crisis in 1973-74 was also caused by a supply shock. Although fifty years ago and caused by a contraction of oil supply, the size of the shock was of the same magnitude as today’s energy shock. In October 1973, the OPEC members imposed an embargo on oil exports to countries supporting Israel in the Middle East conflict. This meant withholding large amounts of oil from the market equalling what corresponded to 0.8 per cent of global energy supply at the time. By March 1974, the price of oil had gone up by a factor four from around USD 3 per barrel to around USD 12 per barrel. The oil supply shock of 1973-74 and the second shock in 1979-81 left the world markedly different.
Before the invasion of Ukraine, Russia was the single largest natural gas supplier to the EU, accounting for around 40 per cent of the EU’s 400 billion cubic metres of natural gas consumption. European gas demand is split roughly evenly across power generation, building heating and industry. Industrial gas use is concentrated in a few industries which play a relatively modest role in the EU’s overall economy.
The most affected sectors are refineries, chemicals, iron, steel, cement, glass, paper and food and beverage manufacturing. Germany alone accounts for a quarter of all industrial gas demand in the EU.
The dependency on Russian gas has varied greatly across the European economies with countries closest to Russia having the largest dependence. Hungary, Latvia and Slovakia all depended on Russian gas for more than 20 per cent of total energy consumption in 2020.
In response to the gas crisis, EU Member States agreed to voluntarily reduce their gas demand by 15 per cent (between August 2022 and March 2023) compared to their average consumption in the past five years with measures of their own choice.
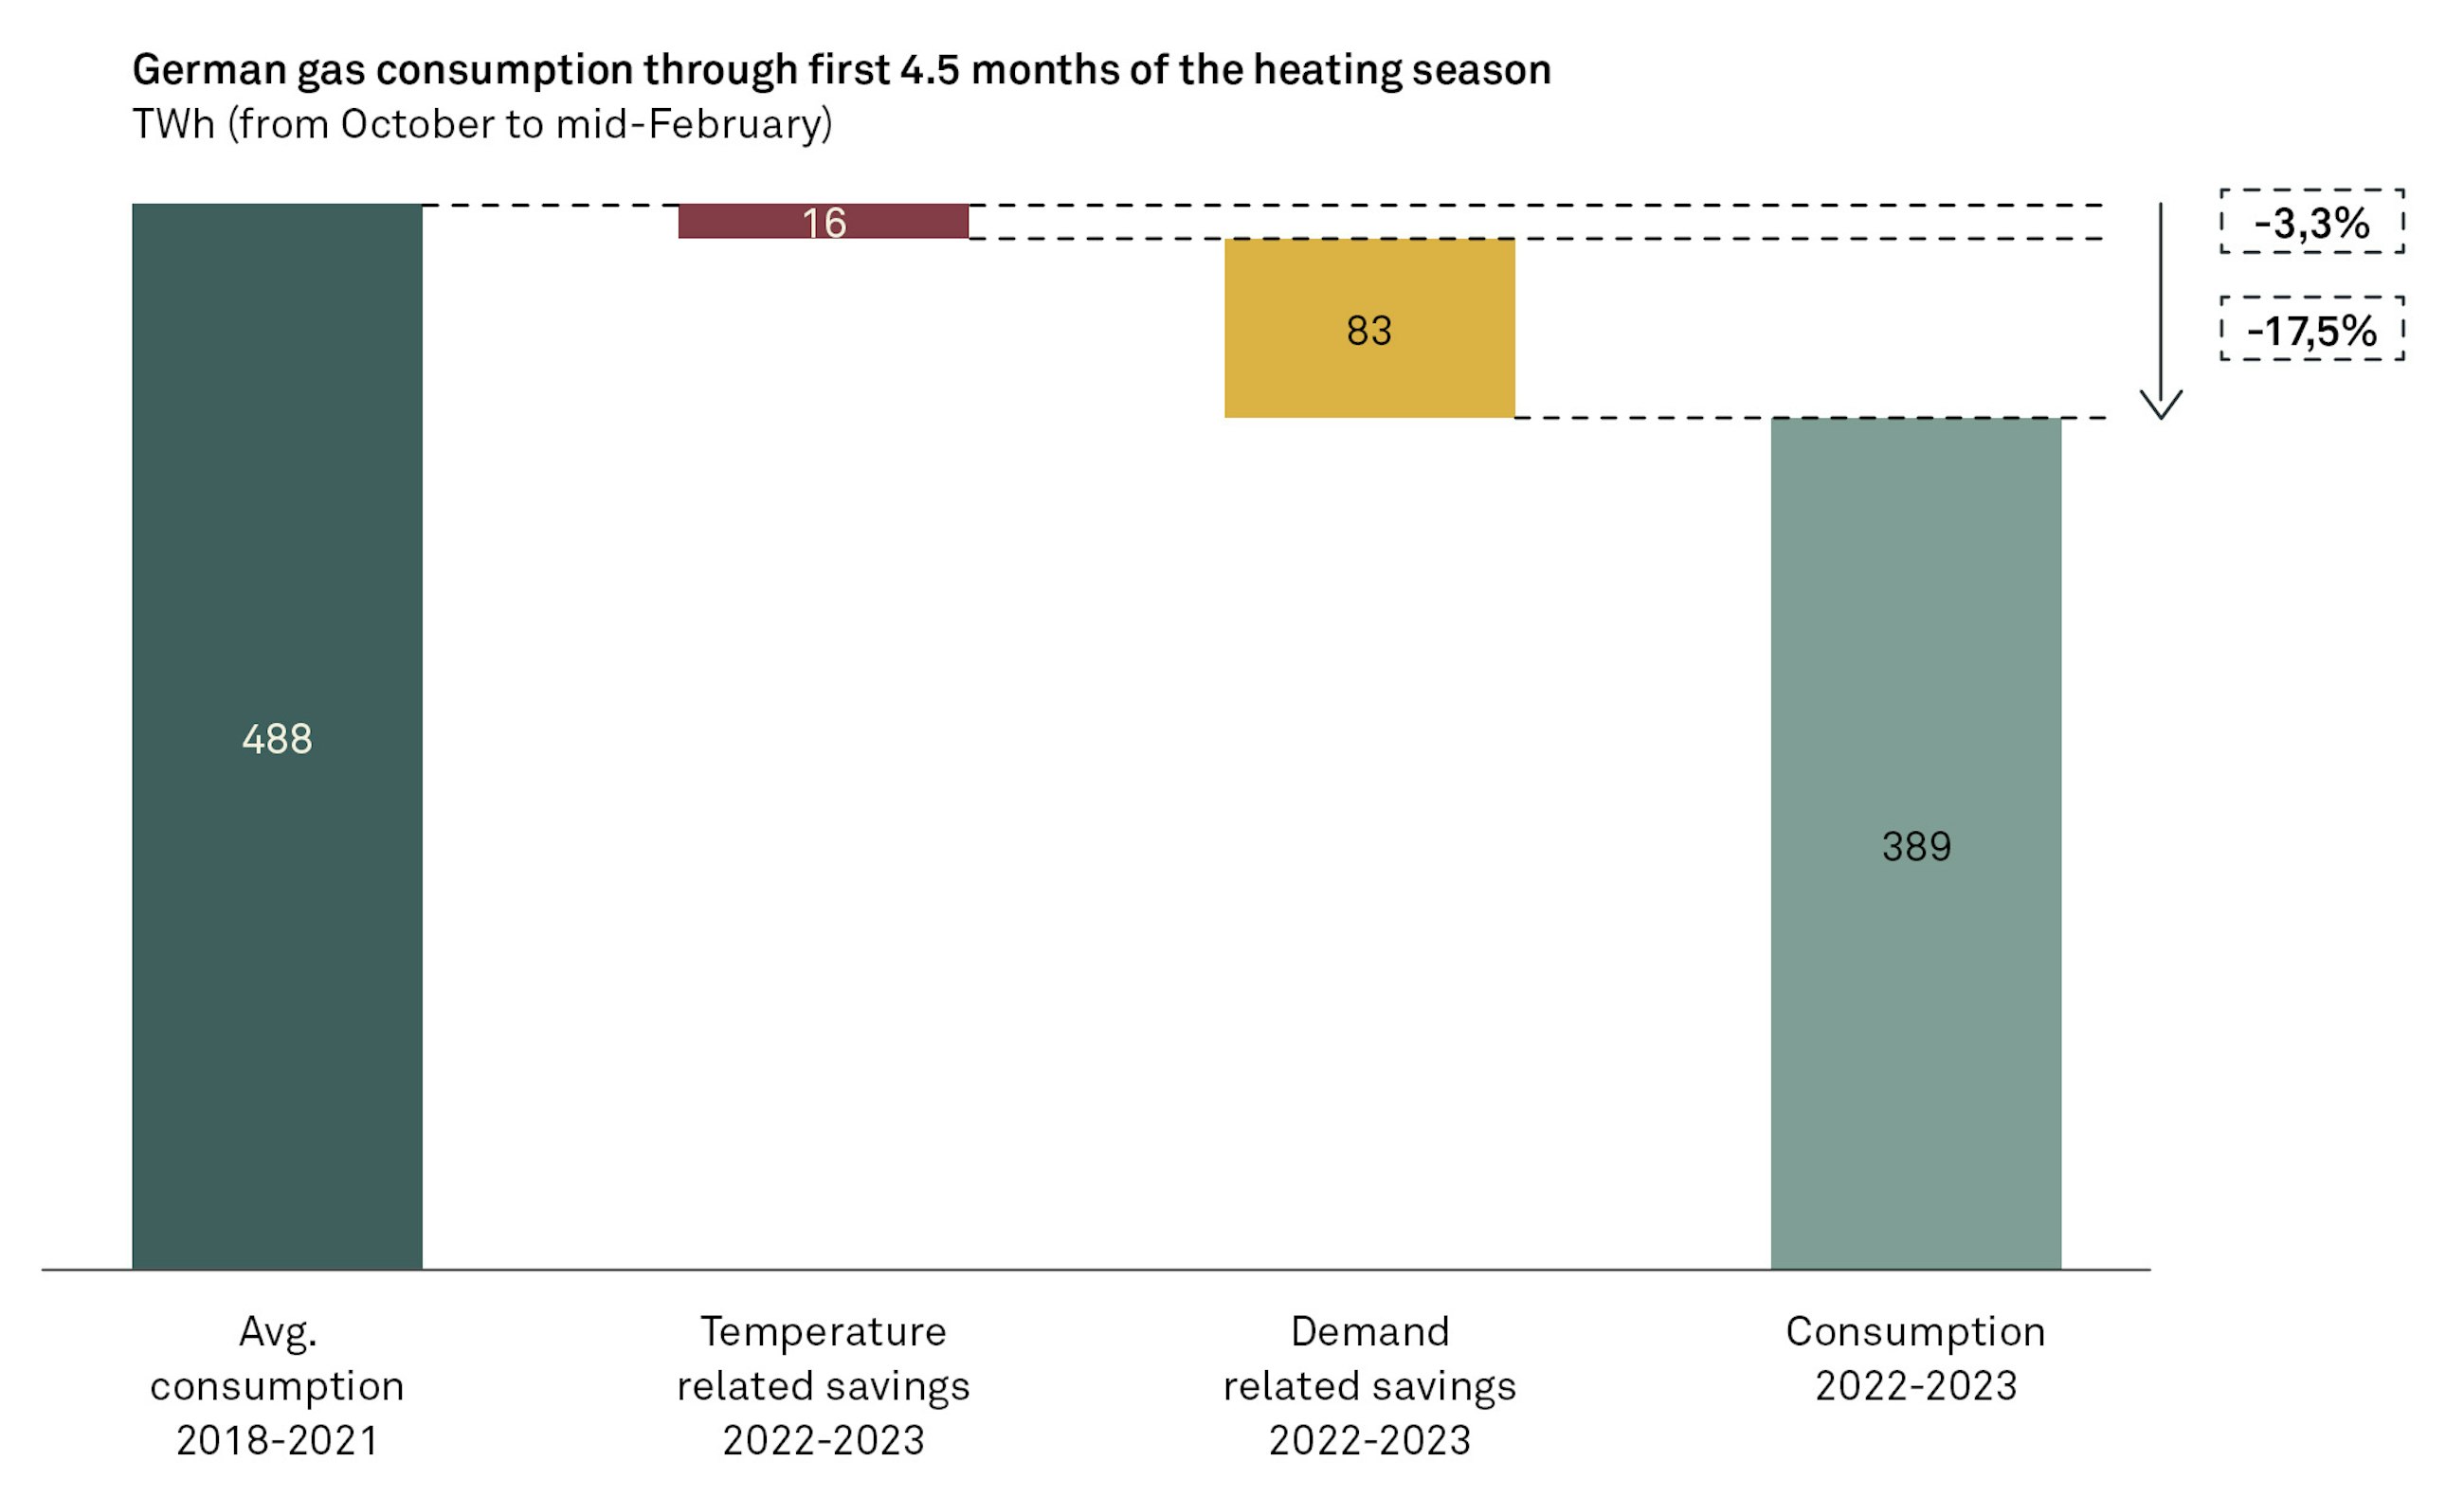
So far, the actual consumption in Europe’s largest gas market, Germany, shows a demand reduction of more than 20 per cent compared to an average winter consumption. This is partly because of warmer weather, but predominantly because of non-weather-related savings of gas.
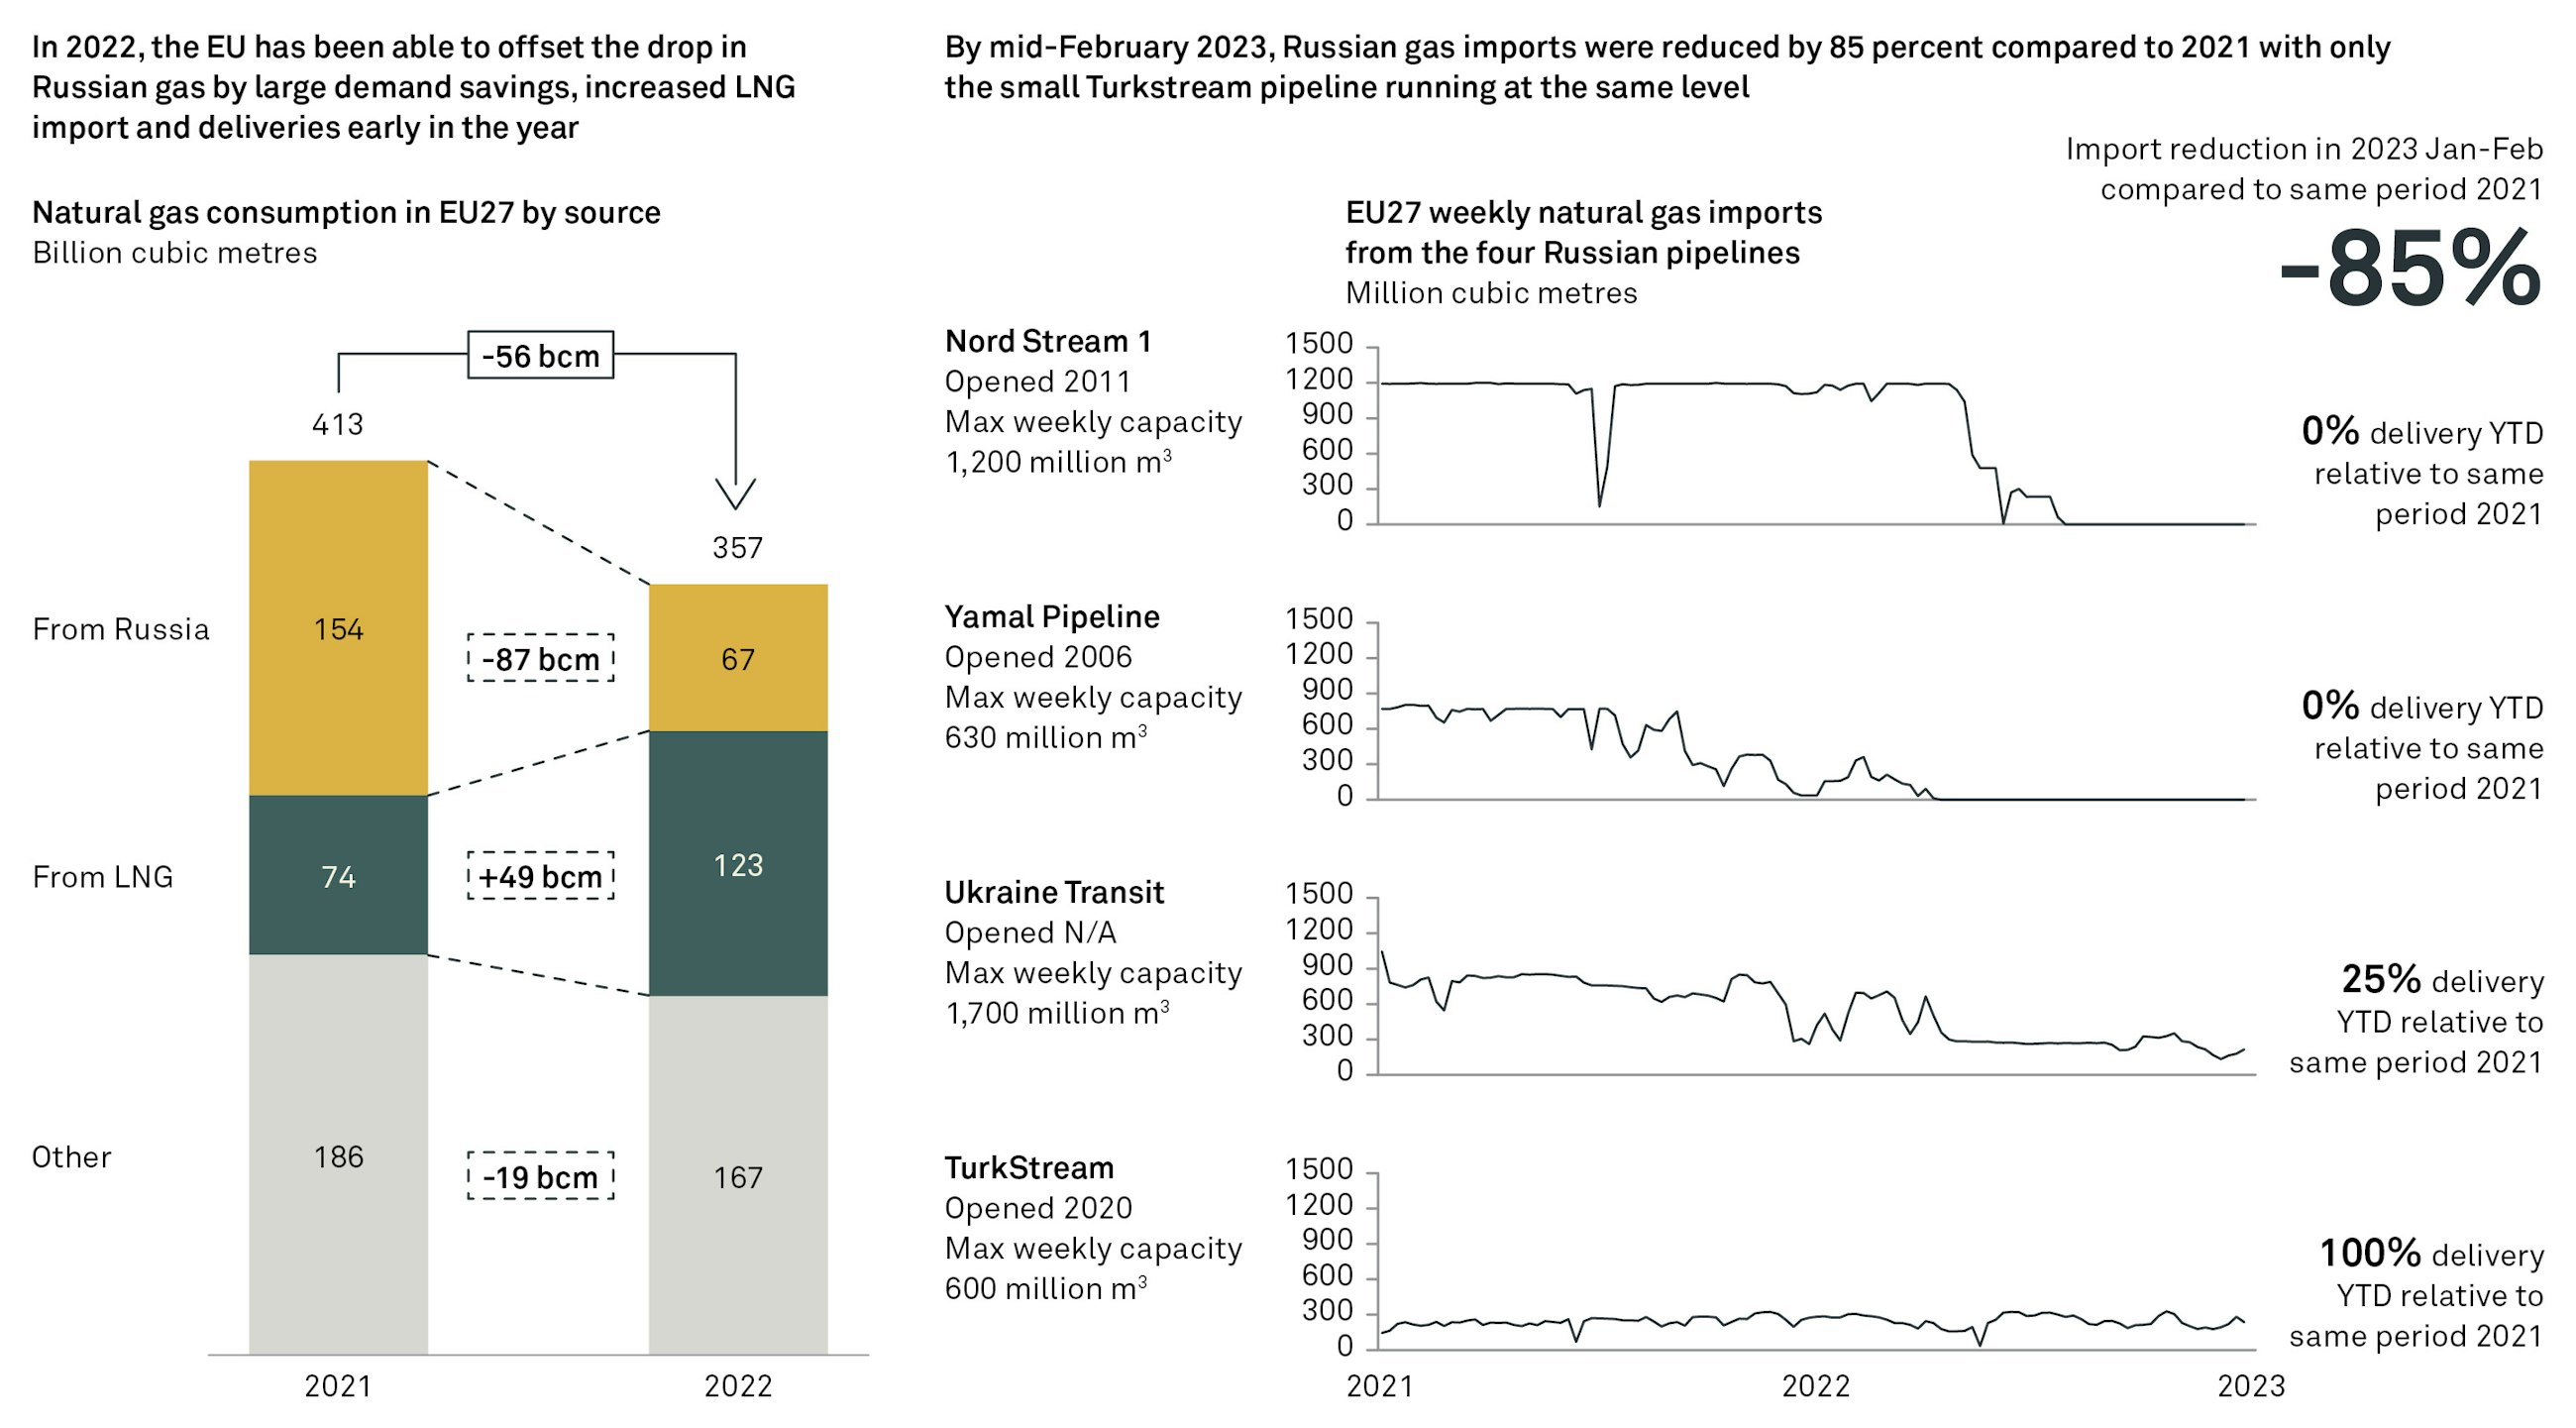
Altogether, the EU used 56 billion cubic metres less gas in 2022 than in 2021 (-14%) according to Eurostat data. This is a bigger reduction than foreseen in the Ten Point Plan suggested by the International Energy Agency in March 2022. This all means that imports from Russia were reduced from 154 billion cubic metres to only 69 billion cubic metres (-52%).
This significant reduction is a result of large gas savings (-56 bcm) and a massive, but expensive, substitution to liquified natural gas (+49 bcm). At the same time, Europe has almost kept its gas imports from Norway, Algeria and other countries unchanged since supply from these countries cannot increase in the short term due to pipeline capacity constraints (-29 bcm).
The imports from Russia have decreased markedly during 2022 and two pipelines – Nord Stream via Germany and Yamal via Poland – are now fully closed off. In the beginning of 2023, Europe has reduced its imports of gas from Russia by 85 per cent compared to the same period of 2021.
Part of the large demand savings is a direct result of the exorbitant price increases for gas in September 2022, and part is due to mandatory reductions in comfort temperatures in public buildings and several private offices. While these reductions may not all be of a permanent nature, a substantial part of the demand reduction is permanent.
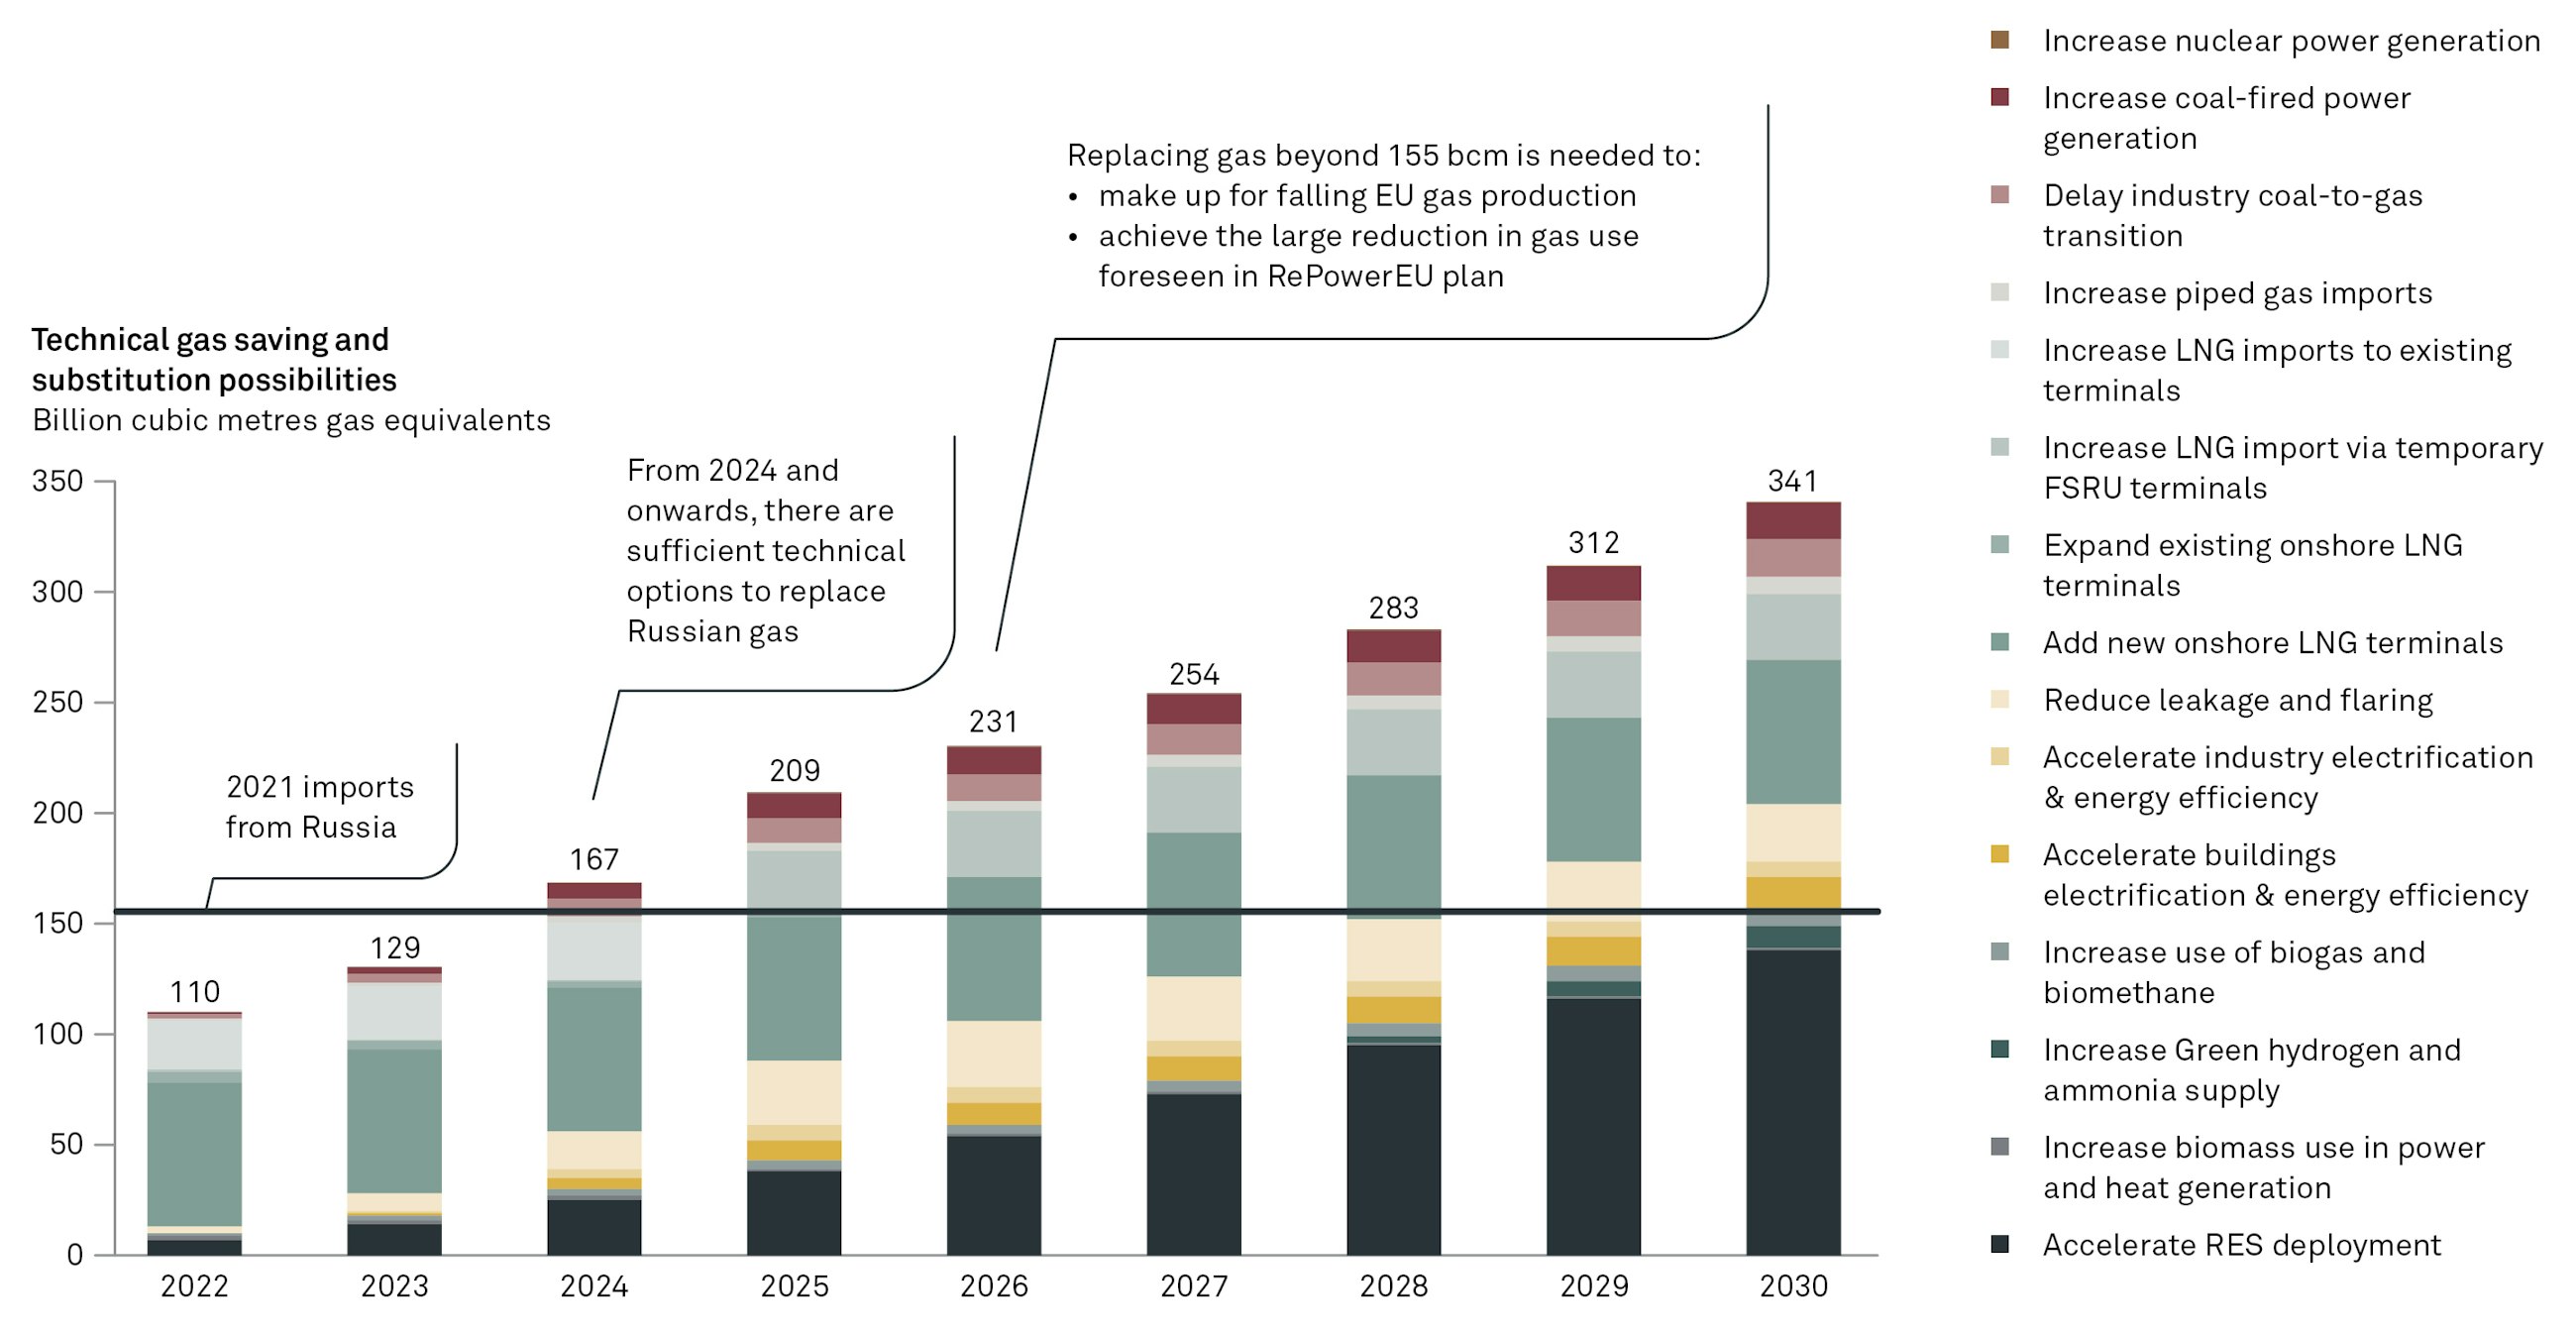
Forecasting gas demand and changing import patterns during disruptive times is extremely uncertain. We have projected the likely quantity of Russian gas which can be replaced by alternative sources and from savings to estimate the ability and timing for independence from Russian gas. We find that from 2024 and forward it is likely that Russian gas imports can be fully replaced.
The possibility of an early independence is supported by actual reductions during 2022 and by Enerdata scenarios which show that increased use of heat pumps, accelerated energy savings in buildings and gas savings in the manufacturing industry could mean that the EU can become independent from Russian gas as early as 2024. This is earlier than expected in the emergency plan, RePowerEU, developed by the European Commission in the spring of 2022 and forecasting independence by 2027.
Natural gas has traditionally been viewed as a greener alternative to both coal and oil, making it a transition fuel to substitute these higher content fossil fuels reducing CO2 emissions in the near future.
Simultaneously, European countries, such as Germany and Belgium, also planned to use gas to phase out their aging nuclear reactors. The role of gas as a transition fuel will still be there, but because of the marked shifts in the relative competitiveness of renewables, the role will be significantly smaller.
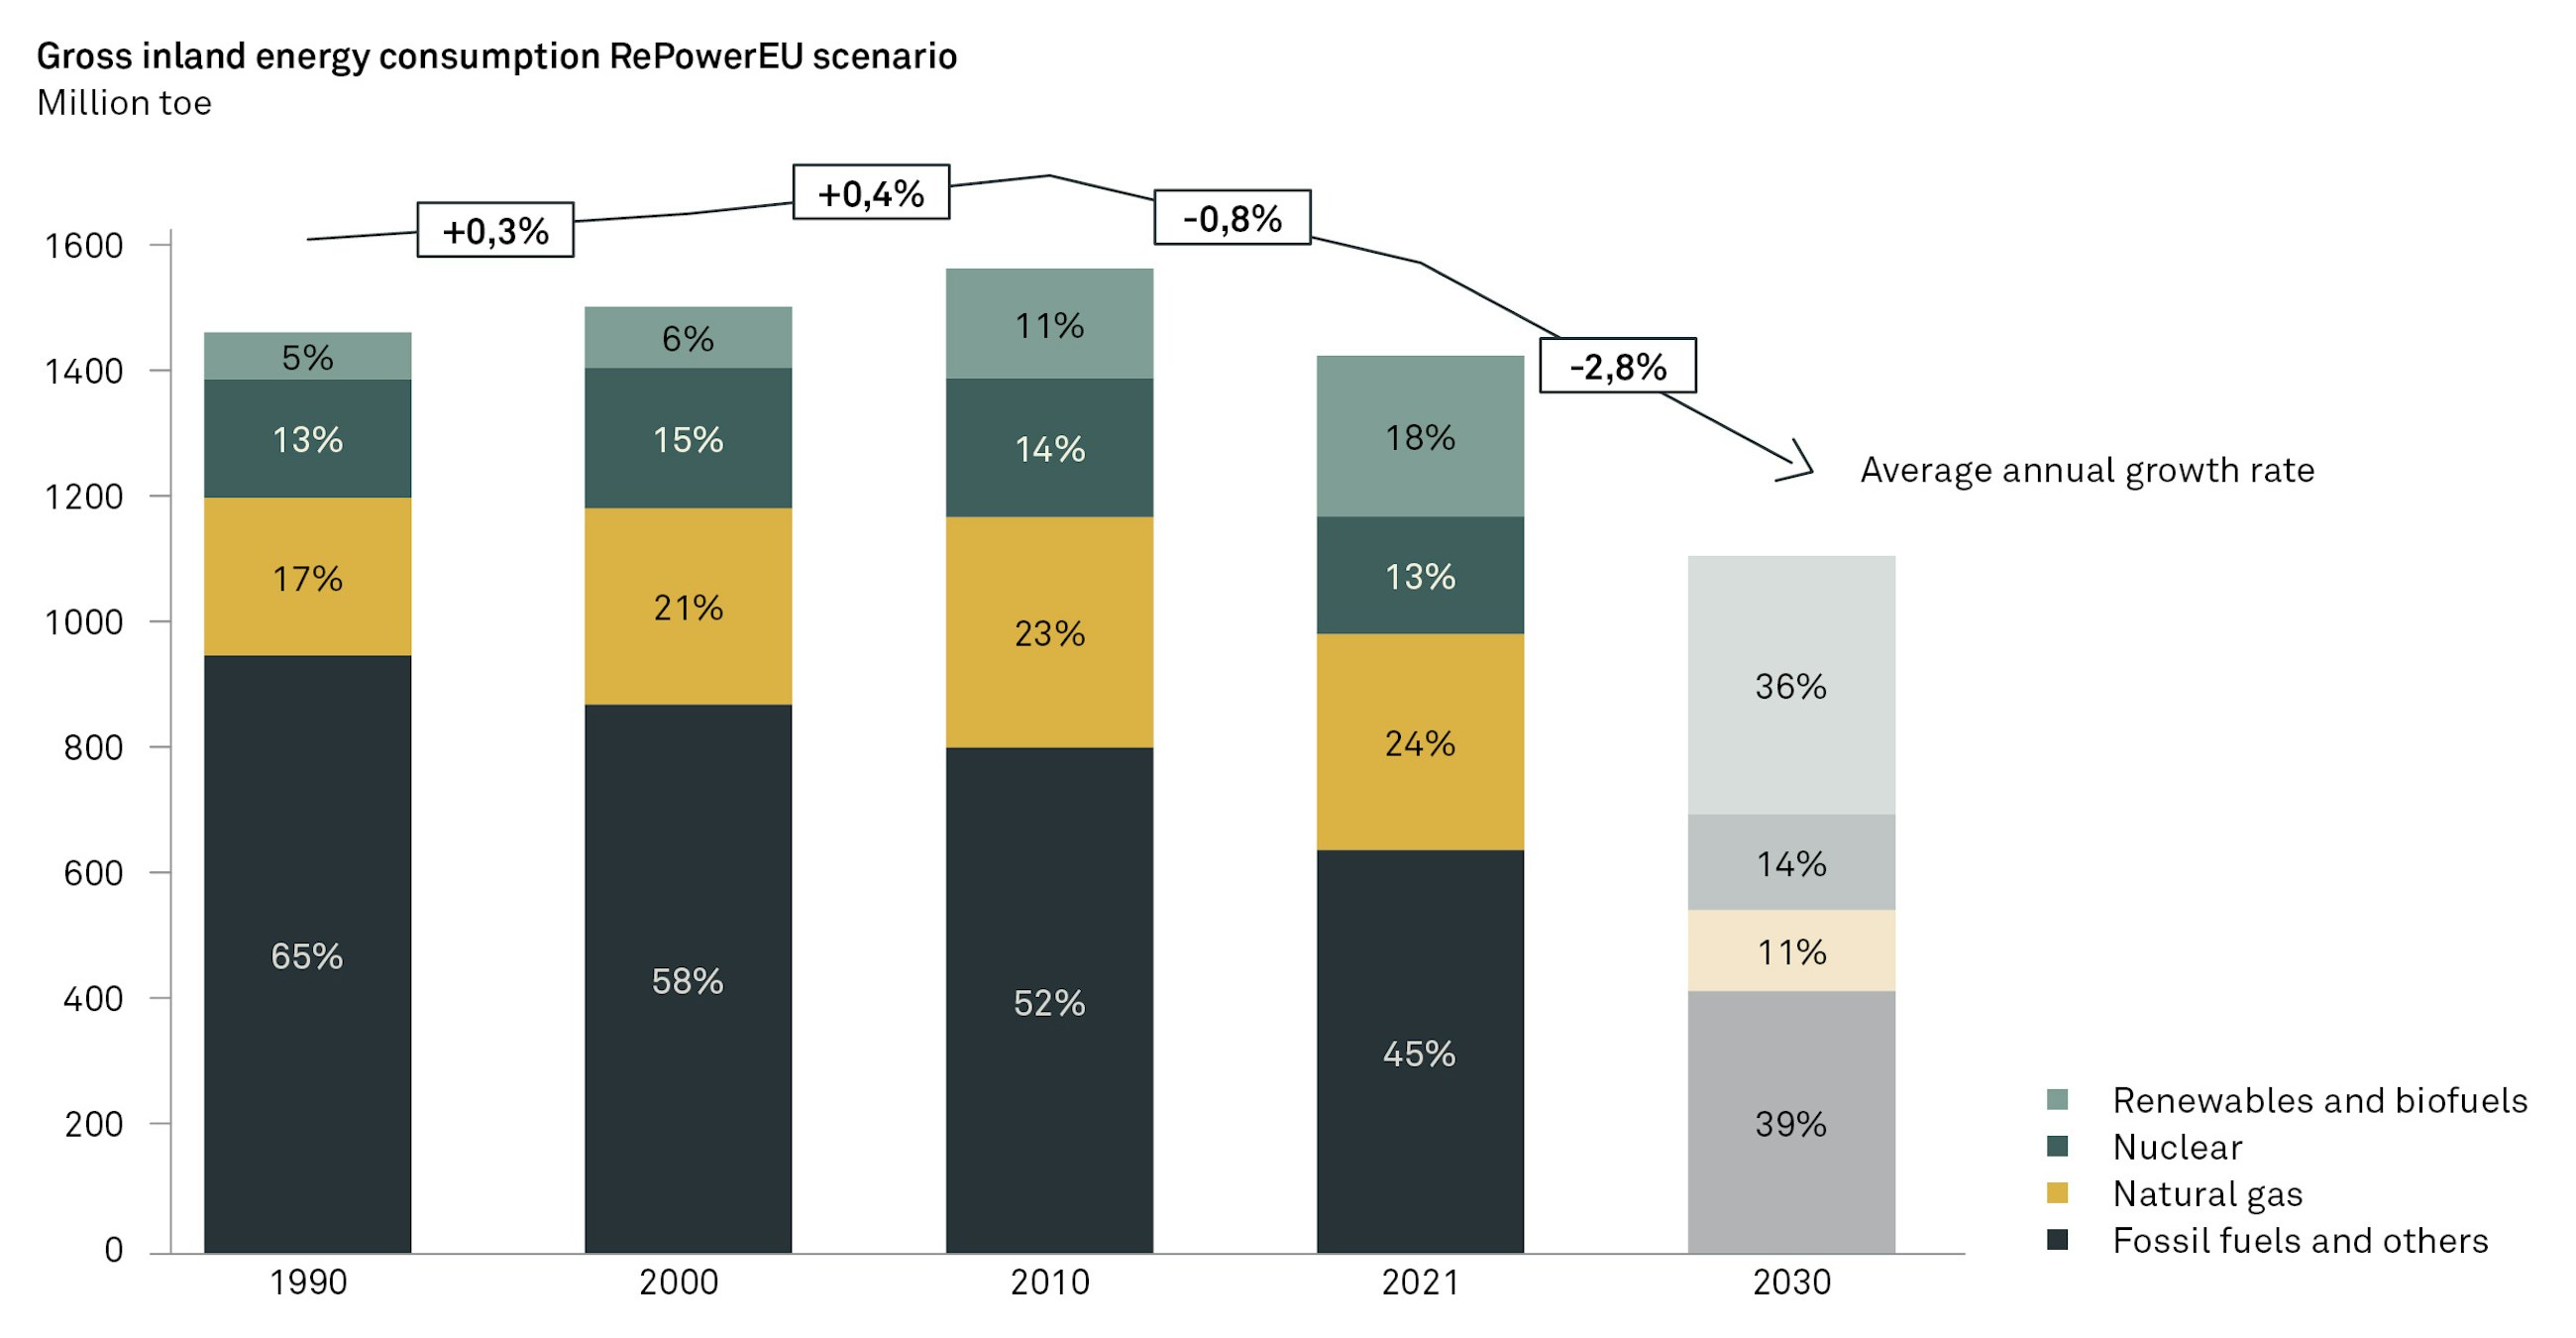
The recent RePowerEU analysis suggests that the higher energy prices and new policy measures will change the EU energy system compared to the pre-war outlook. Gas use in the EU will decrease faster than foreseen in the Fit for 55 legislative package. Part of this is due to fuel switching in the power sector, where the higher gas prices have increased the power generation from coal and nuclear power plants. In the longer term, the analysis forecasts more renewables (including direct natural gas substitutes such as biomethane and hydrogen) and more energy savings than foreseen in the Fit for 55 package.
In the RePowerEU outlook for 2030, natural gas use in the EU will drop to nearly one third of the 2021 level to around 140-150 billion cubic metres. This is much less than the 210-220 billion cubic metres foreseen in the pre-war forecast. Similarly, gross inland energy consumption in the EU is expected to decrease by nearly 3 per cent per year on average. Europe will have a smaller energy consumption than otherwise foreseen with a different energy mix involving significantly less gas than anticipated before the invasion.
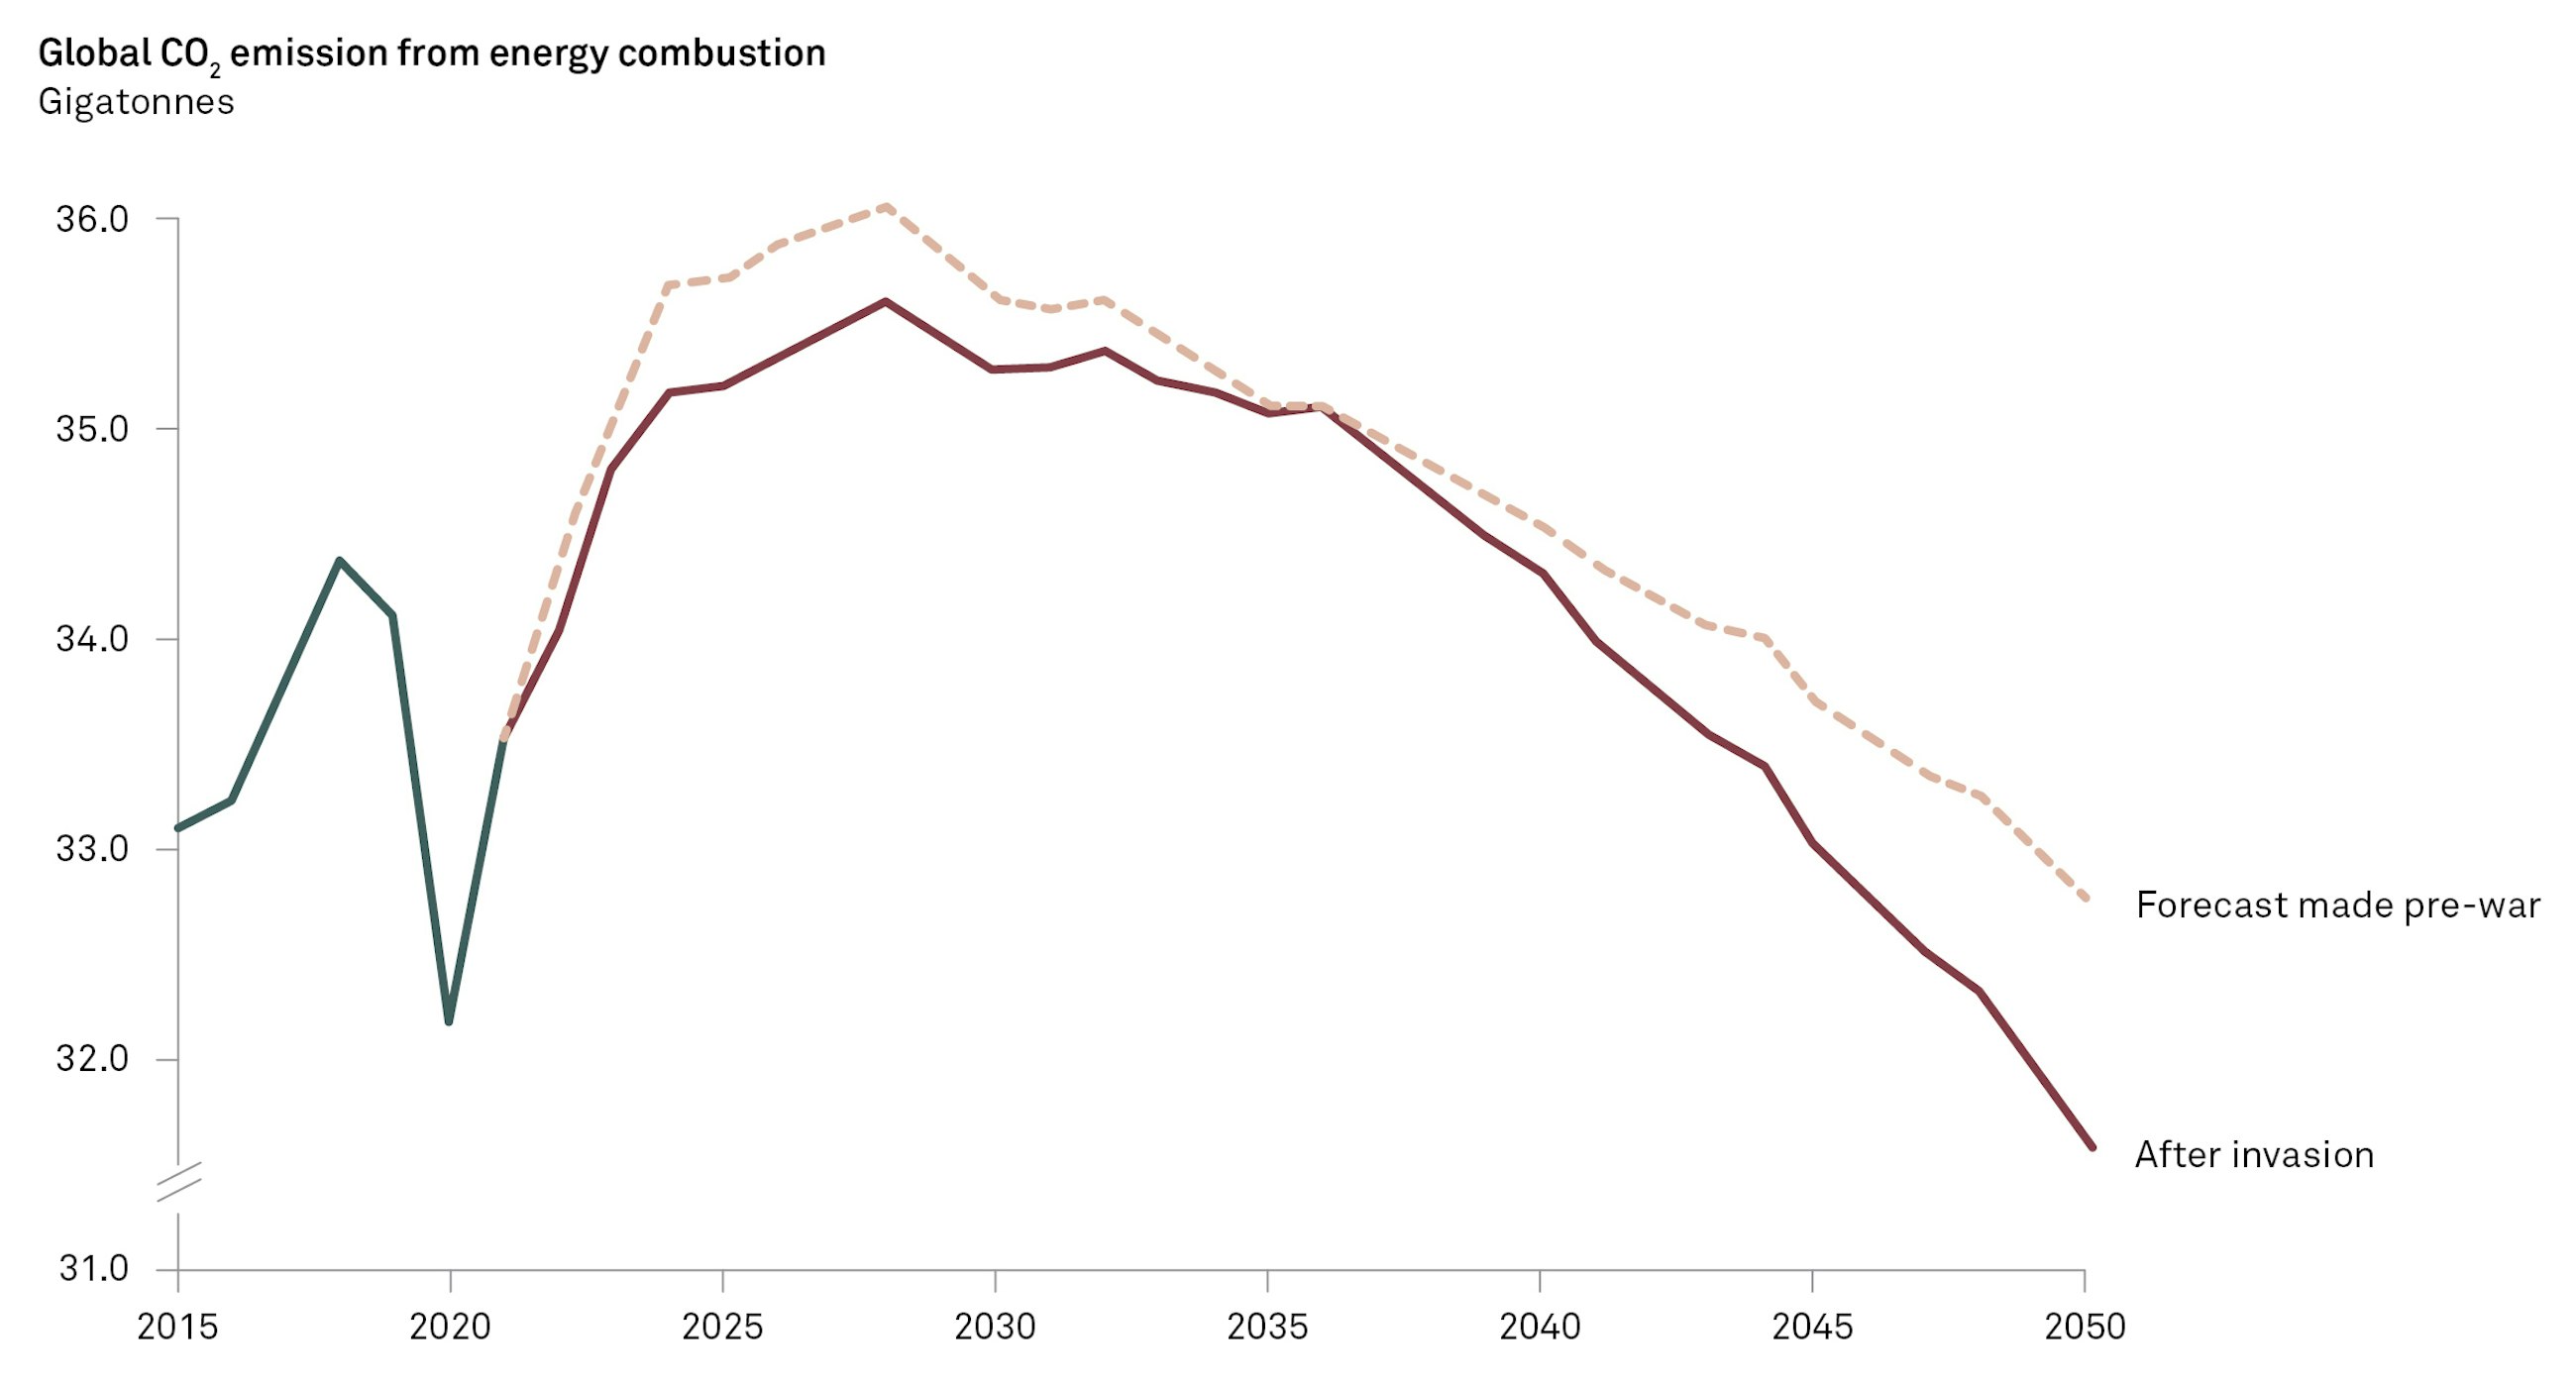
At a global scale, these changes will also tweak global energy use. The world will use less energy than foreseen before the war, and the world will use less gas, more oil and more coal but also more renewables. The net result is a speedier green transition which will knock five years off the timeline, meaning that the emission reduction previously expected for 2050 is reached four to five years earlier around 2045.
This is small, good news in all the tragedy. Although a smaller effect compared to the huge reductions needed to achieve net zero emissions by 2050, there are positive impacts from higher fossil fuel cost. The effect on demand is similar to a global CO2 tax – with the stark difference that the extra revenues become windfall gains for energy producers and not income for the national treasuries. This is an important element in the investment and risk incentives for attracting investment capital to renewables.
The underlying reason is the contraction of Russian gas supply which will push the long-term gas price up. Forward prices and model simulations suggest that gas prices in the coming 3-7 years will be significantly above pre-war averages. Some analyses suggest a lift in gas prices by a factor two to four from the pre-war levels. The lift in gas prices will also spill over to oil and coal, which serve as most direct substitutes for gas for certain types of use. Consequently, demand for oil and coal will increase, and these prices will also see a marked structural lift from their pre-war levels although less pronounced than for gas. As a result, electricity prices will go to a structurally higher level for a good period of time until renewables sources take over as the marginal and price setting technology.
The cost of renewable energy will not be affected by the shrinking gas supply and, consequently, there will be a sharp increase in the competitiveness of renewables relative to gas, oil and coal.
From a global climate change perspective, there are two counteracting effects at play. First, oil and coal, which contain more carbon than natural gas, will replace gas for certain uses (power generation and heavy industry). Global coal use increased to its highest level ever last year after having declined since 2013. This in isolation is bad for the climate and will pull global emissions upwards. Second, higher oil, gas and coal prices will improve the relative competitiveness of renewables and make more energy savings worthwhile.
Investment in renewable energy solutions will have a shorter payback time when the energy it replaces goes up in price. A typical solar plant takes less than three years to become profitable at current electricity prices against 11 years at pre-war levels. Likewise for energy savings. When gas, oil and coal become more expensive, businesses and households will take on investments in energy savings that would not pay off at pre-war price levels. This is good for the climate and will pull global emissions downwards.
As a consequence of these shifts, energy-producing and energy-using businesses are currently reassessing their investment plans in light of the new energy realities. Following where the money goes gives a clear answer with good hope for the global climate. During 2022, investment in wind and solar assets grew by almost 40 per cent coming close to the $500 billion mark – and exceeding investment in new and existing oil and gas wells for the first time. According to research by Rystad Energy, wind and solar investment will continue to rise over the next two years. Investment in green hydrogen, which can decarbonise activities that are hard to electrify, is also expected to grow significantly.
Russia’s invasion of Ukraine will mark a new era in world history with large economic and geopolitical changes. With the energy world, we will also enter a new era. The transition to the new energy reality is abrupt, bumpy and uncertain.
Energy-producing and energy-consuming businesses should prepare for at least four things being markedly different in years to come:
All actors in the energy field will have to actively choose strategies that will prepare them for the new energy era. When deciding how to proceed, the market participants must decide how to handle particularly large uncertainty regarding 2023 and 2024. The energy crisis is not over. We are amid a transition to a new energy era.
Bank of Finland Weekly 2022/23 (2022, August 19), Russia posts declines in gas production and gas exports: https://www.bofit.fi/en/monitoring/weekly/2022/vw202233_4/
Bertram, C., Luderer, G., Creutzig, F., Bauer, N., Ueckerdt, F., Malik, A., & Edenhofer, O. (2021). COVID-19-induced low power demand and market forces starkly reduce CO2 emissions. Nature Climate Change, 11(3), 193-196.
Bruegel (2023, February 23), European Natural Gas Imports: https://www.bruegel.org/dataset/european-natural-gas-imports
Bundesnetzagentur (2022). Aktuelle Lage der Gasversorgung in Deutschland. https://www.bruegel.org/dataset/european-natural-gas-imports
Council on Foreign Relations, Oil Dependence and U.S. Foreign Policy 1850-2022; https://www.cfr.org/timeline/oil-dependence-and-us-foreign-policy
ENERDATA (2022). Global Energy & Climate Trends 2022. Webinar slides June 28th
EU Commission (2022, May 18). Commission staff working document. Implementing the RePower EU plant: Investment needs, hydrogen accelerator and achieving the bio-methane targets. https://eur-lex.europa.eu/legal-content/EN/TXT/PDF/?uri=CELEX:52022SC0230&from=EN
European Union Agency for the Cooperation of Energy Regulators, Estimated number and diversity of supply sources 2021 https://aegis.acer.europa.eu/chest/dataitems/214/view
Eurostat (2022). Dataset: nrg_bal_s. https://ec.europa.eu/eurostat/databrowser/view/NRG_BAL_S/
Eurostat (2023, February 24), EU energy mix and import dependency: https://ec.europa.eu/eurostat/statistics-explained/index.php?title=Energy_imports_from_Russia_-_statistics&oldid=556977#EU_energy_dependency_on_Russia
Eurostat (2023, February 24), EU imports of energy products - recent developments: https://ec.europa.eu/eurostat/statistics-explained/index.php?title=EU_imports_of_energy_products_-_recent_developments#Main_suppliers_of_natural_gas_and_petroleum_oils_to_the_EU
ICE Endex Dutch TTF Natural Gas Future (2023, February 24): https://www.theice.com/products/27996665/Dutch-TTF-Gas-Futures/data?marketId=5508663
IEA (2022, March 21), Energy Fact Sheet: Why does Russian oil and gas matter?: https://www.iea.org/articles/energy-fact-sheet-why-does-russian-oil-and-gas-matter
IEA (2022, May 3). How Europe can cut natural gas imports from Russia significantly within a year. https://www.iea.org/news/how-europe-can-cut-natural-gas-imports-from-russia-significantly-within-a-year
MERIP (May 1974), A Political Evaluation of the Arab Oil Embargo
OECD Primary Energy Supply Data, https://data.oecd.org/energy/primary-energy-supply.htm#indicator-chart
World Bank (2023 Feburary), Commodity Monthly Price Data (The Pink Sheet): https://www.worldbank.org/en/research/commodity-markets
Yahoo Finance Dutch TTF Natural Gas Calendar (TTF=F), https://finance.yahoo.com/quote/TTF%3DF?p=TTF%3DF